

Encoding Categorical Data
4.1. Introduction
Models based on statistical algorithms, such as machine learning and deep learning, work with numbers. However, a dataset can contain numerical, categorical, date time, and mixed variables, as you saw in chapter 2. A mechanism is needed to convert categorical data to its numeric counterpart so that the data can be used to build statistical models. The techniques used to convert numeric data into categorical data are called categorical data encoding schemes. In this chapter, you will see some of the most commonly used categorical data encoding schemes.
4.2. One Hot Encoding
One hot encoding is one of the most commonly used categorical encoding schemes. In one hot encoding, for each unique value in a categorical column, a new column is added. Integer 1 is added to the column that corresponds to the original label, and all the remaining columns are filled with zeros. Let’s take a look at a very simple example of one hot encoding.
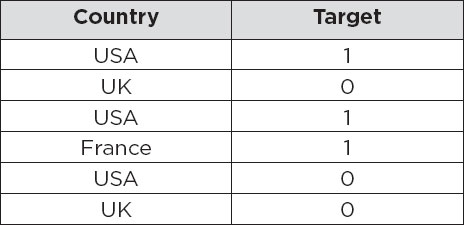
In the following table, we have a categorical column Country. The column contains three unique values: USA, UK, and France.

The following table contains the one hot encoded version of the above table. In the following table, you can see that three columns have been added, i.e., USA, UK, and FRANCE. In the original column, we had USA as the label in the first row of the Country column. In the newly added one hot encoded table, we have 1 in the USA column. Similarly, the original table contained UK as the label in the second row. In the one hot encoded table, we have 1 in the second row for the UK column.

As a matter of fact, you only need N-1 columns in the one hot encoded dataset for a column that originally contained N unique labels. Look at the following table:
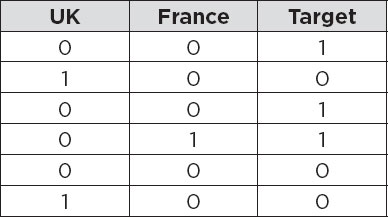
In this table, the USA column has been removed. However, we can still capture the information that the first column contained. For instance, the row where both UK and France columns contain zero actually represents that this record corresponds to the USA column.
Let’s see one hot encoding with the help of an example. Execute the following script to download the Titanic dataset, as we did in the previous chapters.
Script 1:
import matplotlib.pyplot as plt
import seaborn as sns
plt.rcParams[“figure.figsize”] = [8,6]
sns.set_style(“darkgrid”)
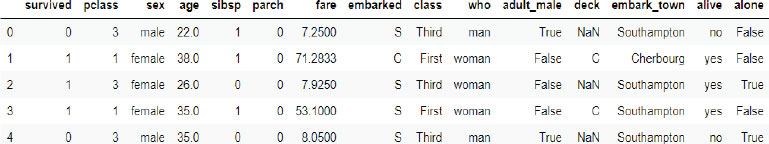
titanic_data = sns.load_dataset(‘titanic’)
titanic_data.head()
Output:
Let’s filter the titanic_data dataframe by removing all the columns except sex, class, and embark_town columns. These are categorical columns.
Script 2:
titanic_data = titanic_data[[“sex”, “class”, “embark_town”]]
titanic_data.head()
Output:

Let’s print the unique values in the three columns in the titanic_data dataframe.
Script 3:
print(titanic_data[‘sex’].unique())
print(titanic_data[‘class’].unique())
print(titanic_data[‘embark_town’].unique())
Output:
[‘male’ ‘female’]
[Third, First, Second]
Categories (3, object): [Third, First, Second]
[‘Southampton’ ‘Cherbourg’ ‘Queenstown’ nan]
The easiest way to convert a column into one hot-encoded column is by using the get_dummies() method of the Pandas dataframe, as shown below:
Script 4:
import pandas as pd
temp = pd.get_dummies(titanic_data[‘sex’])
temp.head()
In the output, you will see two columns, one for males and one for females.
Output:

Let’s display the actual sex name and the one hot encoded version for the sex column in the same dataframe.
Script 5:
pd.concat([titanic_data[‘sex’],
pd.get_dummies(titanic_data[‘sex’])], axis=1).head()
Output:

From the above output, you can see that in the first row, 1 has been added in the male column because the actual value in the sex column is male. Similarly, in the second row, 1 is added to the female column since the actual value in the sex column is female.
In the same way, we can convert the embark_town column into a one hot encoded vector as shown below:
Script 6:
import pandas as pd
temp = pd.get_dummies(titanic_data[‘embark_town’])
temp.head()
Output:

As you saw earlier, you can have N-1 columns one hot encoded columns for the categorical column that contains N unique labels. You can remove the first column created by get_dummies() method by passing True as the value for drop_first parameter as shown below:
Script 7:
import pandas as pd
temp = pd.get_dummies(titanic_data[‘embark_town’], drop_first = True)
temp.head()
Output:

Also, you can create one hot encoded column for null values in the actual column by passing True as a value for the dummy_na parameter.
Script 8:
import pandas as pd
temp = pd.get_dummies(titanic_data[‘embark_town’], dummy_na = True ,drop_first = True)
temp.head()
Output:

The main advantage of one hot encoding is that it makes no assumption about the dataset and all the categorical values can be successfully encoded. A major drawback of this approach is that the feature space can become very large since a categorical column can have a lot of unique values.
4.3. Label Encoding
In label encoding, labels are replaced by integers. This is why label encoding is also called integer encoding. Consider the following table:
The above table has been label encoded as follows. You can see that USA has been labeled as 1, UK has been labeled as 2, and France has been labeled as 3.

To implement label encoding, you can use the LabelEncoder class from the sklearn.preprocessing module, as shown below. You have to create an object of the label_encoder class. Next, you need to call the fit() method of the label_encoder object and pass it your categorical column. Finally, to convert the categorical column to numerical, call the transform method of the label_encoder object, and pass it the categorical column.
The following script performs label encoding on the class column of the Titanic dataset.
Script 9:
# for integer encoding using sklearn
from sklearn.preprocessing import LabelEncoder
le = LabelEncoder()
le.fit(titanic_data[‘class’])
titanic_data[‘le_class’] = le.transform(titanic_data[‘class’])
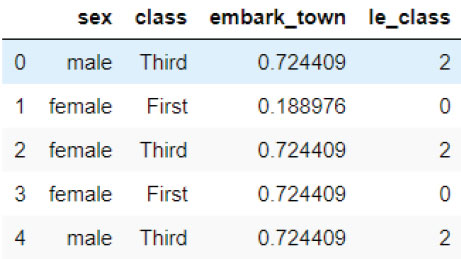
titanic_data.head()
Output:
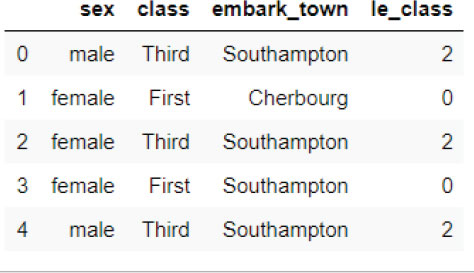
From the above output, you can see that the class Third labeled as 2, the class First is labeled as 0, and so on. It is important to mention that label encoding starts at 0.
4.4. Frequency Encoding
In frequency encoding, each unique label in a categorical column is replaced by its total count or frequency. For instance, in the following table, USA occurs three times, while UK and France have a count of two and one respectively.

After frequency encoding, the Country column looks like this.

Let’s apply frequency encoding on the embark_town column of the Titanic dataset. The column contains some null values that can be removed using the following script.
Script 10:
titanic_data.dropna(inplace = True)
Next, you need to call the value_counts() method on the categorical column, and then chain it with the to_dict() column to obtain the count for each unique label in the actual categorical column as shown below:
Script 11:
value_counts = titanic_data[‘embark_town’].value_counts().
to_dict()
print(value_counts)
Output:
{‘Southampton’: 644, ‘Cherbourg’: 168, ‘Queenstown’: 77}
Finally, call the map() method and pass it the dictionary containing the labels and count.
Script 12:
titanic_data[‘embark_town’] = titanic_data[‘embark_town’].
map(value_counts)
titanic_data.head()
In the output, you can see that the embark_town column contains frequencies of actual labels.
Output:

You can also add percentage frequency by dividing the label count by the total number of rows as follows:
Script 13:
frequency_count = (titanic_data[‘embark_town’].value_counts()
/ len(titanic_data) ).to_dict()
print(frequency_count)
Output:
{644: 0.7244094488188977, 168: 0.1889763779527559, 77:
0.08661417322834646}
Script 14:
titanic_data[‘embark_town’] = titanic_data[‘embark_town’].
map(frequency_count)
titanic_data.head()
Output:
4.5. Ordinal Encoding
In ordinal encoding, the labels are ranked on the basis of their relationship with the target. For instance, in the Country column of the table below, you have three rows where the Country is USA for these three rows, and the total sum of the target is 2. Hence, the targeted mean value will be 2/3 = 0.66. For UK, this value is 0 since for both the occurrences of UK, there is a 0 in the Target column. Hence, 0/2 = 0. Finally, France will have a value of 1.

Next, you rank the labels according to their mean occurrence against the target column. Our rank will be:
France -> 1
USA -> 0.66
UK -> 0
In the ordinal encoded column, the smallest value, i.e., UK will be assigned 0 label, UK will be assigned a label of 1, while France will be assigned 2 as shown below:

Let’s apply ordinal encoding on the class column of the Titanic dataset.
Script 15:
titanic_data = sns.load_dataset(‘titanic’)
titanic_data = titanic_data[[«sex», «class», «embark_town», «survived»]]
titanic_data.groupby([‘class’])[‘survived’].mean().sort_ values()
Output:
class
Third 0.242363
Second 0.472826
First 0.629630
Name: survived, dtype: float64
You can see that the First class has the highest mean value against the survived column. You can use any other column as the target column. Next, we create a dictionary where class labels are assigned corresponding integer labels. Finally, the map() function is used to create a column that contains ordinal values, as shown below:
Script 16:
ordered_cats = titanic_data.groupby([‘class’])[‘survived’]. mean().sort_values().index
cat_map= {k: i for i, k in enumerate(ordered_cats, 0)}
titanic_data[‘class_ordered’] = titanic_data[‘class’].map(cat_ map)
titanic_data.head()
Output:
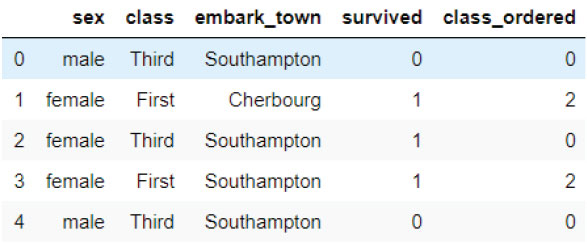
You can see that most passengers survived from the First class, and it has been given the highest label, i.e., 2, and so on.
4.6. Mean Encoding
In mean encoding, the labels are replaced by their mean values with respect to the target labels. For instance, in the Country column of the table below, you have three rows where the Country is USA for these three rows, and the total sum of the target is 2. Hence, the targeted mean value will be 2/3 = 0.66. For UK, this value is 0 since for both the occurrences of UK, there is a 0 in the Target column. Hence, 0/2 = 0. Finally, France will have a value of 1.
Actual Table:

Mean Encoded Table:

The following script applied mean encoding on the class column of the Titanic dataset.
Script 17:
titanic_data.groupby([‘class’])[‘survived’].mean()
Output:
class
First 0.629630
Second 0.472826
Third 0.242363
Name: survived, dtype: float64
Script 18:
mean_labels = titanic_data.groupby([‘class’])[‘survived’].
mean().to_dict()
titanic_data[‘class_mean’] = titanic_data[‘class’].map(mean_labels)
titanic_data.head()
Output:

Exercise 4.1
Question 1:
Which encoding scheme generally leads to the highest number of columns in the encoded dataset?
A.Mean Encoding
B.Ordinal Encoding
C.One Hot Encoding
D.All of the Above
Question 2:
Which attribute is set to True to remove the first column from the one-hot encoded columns generated via the get_ dummies() method?
A.drop_first
B.remove_first
C.delete_first
D.None of the above
Question 3:
What is the total number of integer labels in the frequency encoding?
A.One less than the total number of unique labels in the original column
B.Equal to the total number of unique labels in the original column
C.3
D.None of the above
Exercise 4.2
Apply frequency encoding to the class column of the Titanic Dataset: