
8
Sound Reasoning
I would not give a fig for the simplicity this side of complexity, but I would give my life for the simplicity on the other side of complexity.
—Oliver Wendell Holmes
Imagine working for a company facing a very important long-term decision that will shape its future. The frame of this particular decision problem leads to several compelling alternatives, each with its own set of uncertainties that affect how much value it could deliver over the next decade. It's impossible to intuit which alternative is best in a situation like this, where both complexity and uncertainty are high. Instead of going with our gut, we need a robust and rigorous approach to determine which alternative will provide the most of what we truly want. Sound reasoning, based on normative decision theory, allows us to reach clarity with confidence given the information we have.
In decisions that are simple, quick, or repeated frequently, the best alternative can usually be spotted based on experience and intuition. Little reasoning is required; a brief check is used to ensure that biases aren't misleading us. In slightly more complicated cases, basic calculations will reveal the best choice. Truly complex decisions require much more rigorous analysis.
Recall Michael's decision about whether he should keep his current job or accept a new position with a startup. This chapter begins with the reasoning for Michael's decision: Pencil, paper, and simple math will clarify the best choice. Next, the most useful decision tools for more complex situations are introduced. The chapter concludes with suggestions on when to seek help with reasoning, and how to judge the quality of the sound reasoning link in the decision quality (DQ) chain.
Reasoning for Michael's Job Decision
The reasoning required in Michael's decision problem is relatively straightforward. He has thought through his alternatives and his values, and he has captured the information he needs in the decision tree in Figure 8.1.

Figure 8.1 Michael's Decision Tree
As we saw in the values chapter, Michael has also clarified his tradeoffs between additional work hours and salary, and knows how to discount future income to account for delay, using his 10% discount rate. This has allowed him to calculate the total equivalent five-year income for each outcome. All of the calculations are now added to the tree's endpoints in Figure 8.2, rounded to the nearest thousand dollars.

Figure 8.2 Michael's Tree with Equivalent Endpoint Values
To gain insight about which alternative is best for him, Michael can start by looking at the top two endpoints of the tree. If the startup succeeds and he works less than 60 hours per week, he will be better off than in his current situation. Both of those outcomes, worth $388,000 and $340,000, are higher than his current equivalent income of $334,000, which was calculated in Chapter 7. However, if the startup fails, or if the successful startup requires 60 or more hours per week, Michael will be worse off than he is in his current job.
How can Michael choose between the two alternatives when ifs are involved? Because of the uncertainty, the answer is not obvious. A little more math, however, will clear this up. Michael needs to consider all of the possible outcomes if he goes to work for the startup, some of which are good, and others not so good. He also needs to factor in the probability of each one happening. To do so, he calculates what are called expected values, or EVs, in the tree. These are probability-weighted averages of the outcomes for each branch in the tree. (In fact, there is nothing expected about an expected value. The number obtained by calculating an expected value does not represent what Michael can expect to get. It's just a probability-weighted average of his outcomes.)
To calculate the EV for each alternative, Michael begins on the right side of the tree and begins rolling back, multiplying each outcome by its probability, and adding up the total to get the EV at each node. The tree in Figure 8.3 shows the result of the calculations.

Figure 8.3 Rolling Back the Tree to Find Michael's Best Alternative
First Michael calculates the EV for the node after “startup succeeds,” finding a value of $343,000. Then, for the “startup fails” node, he calculates an EV of $293,000. In the next step of rolling back the tree, Michael uses the EVs he just computed. He weights the EV of the startup succeeding by its probability, and does the same for the failure branch. The result is the final EV for the startup job, which Michael can compare with the calculated value for his current job. Since there is no uncertainty associated with keeping his current position, the EV for that is $334,000, which is based on a five-year discounted total. Now Michael can determine which of his alternatives will provide the most of what he wants.
The EV for taking the startup job, $328,000, is less than $334,000, the value of staying with his current job. So he's a bit better off staying put. He will miss out on the upside possibilities of the startup, but he will also avoid all the downside cases as well.
Based on his EV calculations, Michael concludes that the startup opportunity is not quite as valuable as his current job.1 Before making a final decision, he may want to see how he can further improve the situation. Armed with an understanding of his values, and knowing how to build and roll back a simple tree, he can now look for better employment opportunities—jobs that will give him more income without sacrificing too much of the time he spends now with family. He might negotiate a higher salary with the startup company, or limit work hours there, making that opportunity more valuable. Straightforward reasoning has given Michael insights into which of the two alternatives he should choose, and what he might do to create an even better alternative.
Reasoning in More Complex Decisions
With only two alternatives and relatively simple value tradeoffs to make, Michael could build and solve a decision tree with pencil, paper, and simple math. In many strategic decisions, when things are highly important, uncertain, and complex, reasoning to find the best alternative requires more effort and a computer. Strategic decisions typically require the use of decision trees with many branches (built within a computer program), or other computerized decision tools (like Monte Carlo simulation) that can deal with a large number of uncertainties. These tools may require training in decision analysis, or the help of a decision professional,2 someone trained in the art and science of guiding an organization through complex and important decisions. It's useful to be aware of the analytical power that can be brought to bear on difficult decision problems when needed.
The Relevance Diagram: A Tool for Structuring Complex Decisions
One of the tools frequently used to structure a complex decision is the relevance diagram, which shows the factors considered to be relevant to a decision and indicates the linkages among them. Construction of a relevance diagram begins with the ultimate direct value that will be used to compare alternatives. In the example in Figure 8.4, that direct value is net present value (NPV), shown as an octagon at the right of the figure. Ovals represent the uncertain input factors that influence NPV and squares represent the relevant decisions. In this case, the factors directly affecting NPV are revenue, total cost, and the decision about the sale of the company. As the figure illustrates, revenue is a function of sales volume and price for each product, both uncertainties. Total cost is also calculated using a number of uncertainties, and several uncertainties are impacted by various decisions. The complete set of connections between the decisions, uncertainties, and value are shown with arrows. A good relevance diagram (also called an influence diagram3) is just detailed enough to show the important decisions and uncertainties that influence the final value calculation.
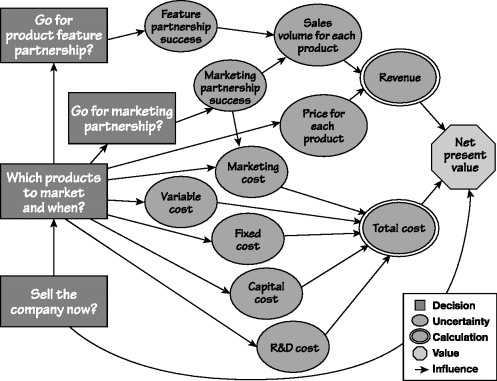
Figure 8.4 Example of a Business Relevance Diagram
The Decision Model: A Tool for Analyzing Complex Decisions
When a decision has multiple alternatives and complex value calculations, a decision model is used to translate the many input variables into value outcomes. The decision model incorporates the relationships and captures the uncertainty of the input factors shown in the decision's relevance diagram. A well-constructed decision model will calculate the value outcome of any combination of the input factors. Typically, a spreadsheet program like Microsoft Excel is used to build the decision model. With a decision model, it is easy to run many thousands of cases representing different combinations of the uncertain input factors.
Like a good relevance diagram, an effective decision model should be “as simple as possible, but no simpler,” as described in Albert Einstein's adage. A decision model captures the essence of the situation without unnecessary detail. Good decision modelers start with something very simple and add more structure as needed to quantify and differentiate the value of alternatives. While many organizations use financial models to project earnings and other important metrics, few have mastered the art of building reliable decision models that support DQ in an uncertain world.
The Tornado Diagram: A Tool for Displaying the Relevance of Information
A decision model can be used to answer questions about how uncertainty affects the decision, particularly when there are many uncertain variables. A tool called the tornado diagram uses the decision model to identify the uncertainties that have the greatest impact on each alternative's value. These uncertainties are the most relevant for the decision—they matter most. Once these value drivers are identified, we know where further information-gathering efforts should be directed.
Recall that in a quality decision, uncertain information is represented with a range of possible outcomes. A tornado diagram uses these ranges to perform a sensitivity analysis, creating a series of bars that show the swing in an alternative's value when one of the uncertain inputs moves through its range while others are unchanged. The wider the swing in a bar, the more impact that uncertain factor has on the decision's overall uncertainty.
Figure 8.5 shows a tornado diagram for a typical business strategy alternative. When all the input factors are set to their base case (50th percentile) estimates, the decision model calculates an NPV for this alternative of $871 million. The top bar shows how much the NPV changes when the peak sales number for Product A moves away from its base case estimate of 2.5 million units sold. At the low (10th percentile) estimate of 1.5 million units sold, NPV drops to roughly $500 million. At the high (90th percentile) of 6.0 million, NPV rises to $2.1 billion. Thus, the swing in NPV caused by uncertainty in Product A's peak sales is about $1.6 billion ($2.1 billion minus $0.5 billion), a very large swing on an alternative whose base value is $871 million. This variable is the biggest contributor to uncertainty in NPV, followed by success of the product technology, then price for Product A, and so on.

Figure 8.5 A Tornado Diagram for a Typical Business Alternative
By looking at this diagram, it's clear that factors related to Product A are much more important than those for Product B, in terms of contributing to uncertainty in NPV. What's more, the top four bars account for 97% of the total variation4 in NPV for this alternative, so to develop a clear picture of the associated uncertainty, only the top uncertainties need to be considered.
The tornado diagram is an incredibly powerful tool. First, it provides direct guidance on which information should be carefully considered with a rigorous assessment processes. We can work to strengthen the reliability of the information in the top bars, and we can accept the base case estimates for the others without underestimating the overall uncertainty.
Tornado diagrams also serve a second important purpose. They highlight the areas where influencing uncertainty will be most valuable. For example, the company facing the tornado diagram in Figure 8.5 would be wise to invest in efforts to increase Product A sales or to improve the chances of technological success; it should not focus on improving Product B sales. Insights like these frequently become clear after decision makers review tornado diagrams. The following example demonstrates how this happened at one company.
A tornado diagram reveals how each individual uncertainty can affect the value of an alternative. In doing so, it offers clues about what information is most important. Eventually, though, many uncertainties combine to create the uncertainty in value. In a business example, a company might have low operating costs and a high market share. Those things could work together to create higher value. Alternatively, high capital expenditures might occur when product prices are low, leading to lower value. What's needed is a way to see how all uncertainties combine and impact overall value.
Decision trees can show how things combine in decisions like the one Michael faces about his job. When the problems get more complex, decision tree software packages can be combined with decision models to calculate values at the endpoints for very large trees. Simulation tools (like Monte Carlo) can also be used to calculate outcomes for thousands of different combinations. With today's computers and software, huge numbers of possible outcome combinations can be weighted by their probabilities of occurring to calculate the EV for each alternative. This is the best single number for comparing alternatives. To make a decision, however, more than the probability-weighted averages are usually needed. The range of outcomes is also important. That is where flying bars come in handy.
Flying Bars: A Tool for Displaying Overall Uncertainty
A flying bar highlights the range for an alternative's value when all the relevant uncertainties are combined. It shows the 10th percentile and the 90th percentile of all possible outcomes. That means there is an 80% chance that the alternative's value will fall within that range. Comparing flying bars across alternatives helps us choose the highest value alternative while considering the range of possible value outcomes. A quick glance at the example in Figure 8.7 reveals that Alternative B has the highest EV: $250 million. It also has a better downside (the 10th percentile) than Alternative A does: negative $100 million, versus A's negative $250 million. Alternative B's upside (the 90th percentile) is almost as good as Alternative A's, making it easy to choose B as the best alternative both in terms of EV and the range of possible outcomes.
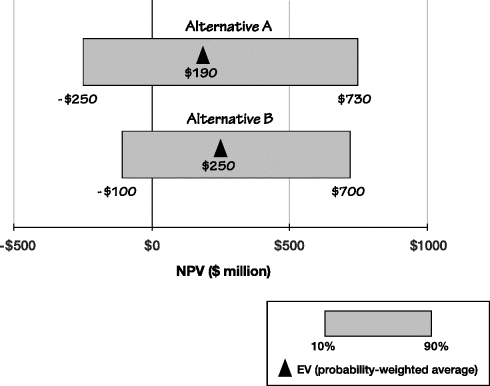
Figure 8.7 An Example of a Flying Bar Diagram Comparing Two Alternatives
Things That Can Go Wrong
The main thing that goes wrong with sound reasoning is that people don't do it explicitly. When facing significant decisions like Michael's job choice, many will think hard about the information and values, but fail to take the necessary next steps: building the decision tree, specifying probabilities and values, and doing the simple math. Simple decision trees, used regularly, can help compensate for our innate lack of intuition when combining probabilities.
Uncertainty is an area in which things often go wrong. Financial modeling is a must in strategic business decisions and it requires recognition of uncertainty. Unfortunately, too many companies take shortcuts when dealing with uncertainty, using a few high and low scenarios, or business cases, instead of using range estimates for all of the important uncertainties. When this shortcut is taken, decision makers have no way of knowing how uncertainty will impact the value of their alternatives.
In another inappropriate shortcut, financial analysts account for risk by discounting the future cash flows with higher hurdle rates for alternatives that are perceived to be risky. Discounting is an accurate way of reflecting differences in the timing of cash flows; it is not a proper way of accounting for differences in risk. Discounting for risk merely distorts the value of alternatives, penalizing any alternative with long-term value delivery relative to one with short-term payouts, even though the long-term alternative's value delivery may be more certain.
The presence of many interrelated factors in a complex situation can also lead decision makers to oversimplify and thus compromise decision quality. Imagine making decisions about a product line while deliberately ignoring the complicating factor of direct competition, potential technical obsolescence, or limited materials availability. That may sound ridiculous, but the human desire for simplicity often encourages us to go too far. We must be mindful of the level of complexity required to effectively address the true situation. Like uncertainty, complexity must be addressed explicitly and correctly when complex alternatives are evaluated and compared.
When to Get Help with Reasoning
One of the most challenging aspects of reasoning is recognizing when it's worth getting help. We don't run to the doctor every time we cut a finger or get a cold; nor do we need a decision professional for every choice we face. For decisions that aren't highly complex or important, the decision quality requirements can serve as a checklist to assure that we're thinking well about the problem. Strategic decisions are another matter. For these more difficult problems, the tools of sound reasoning are essential and their larger consequences often make the assistance of decision professionals a good investment.
Good decision professionals are skilled in analytics and the application of decision tools. They also have experience in facilitating teams toward quality on all of the requirements for DQ, as well as getting the right perspectives on a problem, managing organizational complexity, and building alignment. They can be helpful if a decision is important, with big potential impact on the future, and if the best solution is difficult to spot. When uncertainties or interrelationships make it hard to describe the outcomes of the choice, a decision professional can help get the reasoning and analysis right.
The Power of Iterating from a Simple Start
Getting the reasoning right doesn't mean making it overly complicated. The goal is to arrive at the best choice efficiently and effectively. To achieve this, sound reasoning starts as simply as possible and uses the appropriate tools to iterate as needed. A quick value calculation from a simple decision model with rough uncertainty estimates can be used to identify worthwhile improvements. Initial results will begin to answer the question “Which alternative seems best, and why?” Those first answers help determine whether a more detailed model is needed to differentiate among alternatives, or whether value tradeoffs must be quantified more carefully. An early tornado diagram will answer the question “Which uncertainties lead to the biggest changes in value, depending on how they come out?” This helps identify which information estimates should be refined through additional research and structured conversations with multiple experts. And as the decision model, inputs, and analysis results are refined, it's often possible to create a hybrid alternative that combines the best of the different alternatives, delivering even more of what we want.
Guiding analysis with sound reasoning ensures that effort is applied to the things that matter most and not on unnecessary evaluation. The analysis stops once the best alternative is clear and the requirements of DQ have been met, providing decision makers with the basis for a confident choice.
Judging the Quality of Reasoning
It is through sound reasoning that everything comes together in a decision. By the time reasoning is complete, we should have reached Oliver Wendell Holmes' goal: the simplicity on the other side of complexity. When we have reached 100% on this DQ requirement, we are clear which alternative gives us the most of what we truly want, and we have transparency about why it is the best choice. Through the process of iteration, effective reasoning also helps improve the quality of the other DQ requirements. Questions to judge quality should focus on the reasoning process and on the insights generated by the analysis, including those about the other DQ requirements. Useful questions include:
- “Which alternative looks best? Why is it better than the others? What drives the differences in value?”
- “How robust is the answer? What changes in inputs would shift our decision?”
- “Which uncertainties can lead to the biggest changes in value, depending on how they come out?”
- “How would the decision change if we were to make different tradeoffs?”
- “Is there a hybrid that combines the best of the other alternatives?”
- “Is the level of reasoning appropriate for this problem? Has the problem been oversimplified or made more complex than necessary?”
- “Have decision trees and other decision tools been used appropriately to represent the uncertain outcomes associated with each alternative?”
Sound reasoning provides clarity about what should be done—clarity of intention. Even when the choice seems clear, however, a decision needs one more thing to satisfy the definition of high quality: commitment to action. That's the topic of the next chapter.
Key Points to Remember
- Sound reasoning reveals the choice that gives us the most of what we truly want, taking into account what we can do (our alternatives) and what we know (our information), given our framing of the problem or opportunity.
- Significant decisions that are not overly complex can usually be solved with paper, pencil, and simple math by sketching decision trees and collecting the information needed to roll them back. (A spreadsheet model isn't needed for a four-hour decision.)
- Many strategic decisions require the power of decision tools. When complexity and uncertainty are high, these tools help decision makers compare the alternatives.
- A relevance diagram identifies the many factors and interrelationships that generate the value of alternatives.
- A decision model calculates the value outcome for any combination of input estimates.
- A tornado diagram summarizes sensitivity analysis to show how each uncertain factor contributes to the uncertainty in the final value.
- A flying bar diagram summarizes the range of value outcomes for each alternative.
- A decision professional is trained in facilitative leadership skills and the use of the analytical tools for solving complex decision situations.
- Sound reasoning seeks insight and clarity, using an iterative process and the appropriate tools to reach simplicity on the other side of complexity.