Continuous monitoring is at the heart of security operations. After threat intelligence is gathered and vulnerabilities identified and managed, the entity must detect unwanted activity in the network. In the smallest of organizations, this is no easy task. Data generated by a single laptop running Windows 10 is quite large. Dozens of log entries are generated on startup alone. A Windows endpoint running Microsoft’s Sysmon tool generates tens of thousands of logs in a matter of hours. Take into account the network traffic generated by a simple HTTP connection as well as normal broadcast traffic generated internally and you immediately begin to understand how complicated monitoring can get.
What is the rate of false positives?
Did any false negatives occur?
Too many false positives waste resources. Spending hours looking into a potential event only to learn the behavior detected should be expected is frustrating. The hope is maturity over time leads to alerts and detections that are the real thing. False negatives are more serious. This means unwanted activity went undetected.
Continuous Monitoring
What protocols are used and why?
What protocols are used inbound, outbound, and internally?
What internal connections occur between endpoints and are they allowed?
What data flows over the network in clear text and encrypted?
What does normal login activity look like?
The answers to these questions, and potentially many more, are based on business processes in place, the characteristics of operations, and what is safe for the data and digital assets.
Starting from scratch, continuous monitoring begins with endpoints, since users are vulnerable to attacks and the use of applications creates opportunities to increase the attack surface. Quick detection of a compromise starts with identifying the indicators at the endpoint. Then collection of network data is implemented to view internal and external connections. If bits and pieces of the monitoring program are in place, then the team focuses on creating a prioritized list of gaps to address. Data collected from endpoints and from the network form the basis for establishing visibility into the environment to find and eradicate unwanted behavior.
Endpoints
- Windows
Host Firewall and/or Intrusion Detection
Endpoint Protection, Detection, and Response
Event Logging and Forwarding
Sysinternals Suite (specifically Sysmon)
- Linux
Host-Based Firewalls: Iptables on laptops and servers
SELinux: Provides granular access control beyond traditional file permissions such as read, write, and execute
Logging and Auditing with Syslog Forwarding
Host-Based Firewalls
Host-based firewalls are an integral part of monitoring and detecting events of interest. Some concern exists about the number of logs firewalls on endpoints generate, but since many attacks begin with a compromised end user, the monitoring program must focus on endpoints to detect attacks early. If nothing else, endpoint logging should alert on attempted connections between user endpoints, laptop to laptop connections, and server to server connection attempts. The SOC should also monitor for instances of new ports listening for connections. Windows and Linux operating systems come with firewall and logging capabilities. For the purposes of this discussion, the focus is on Windows endpoints.
Windows Firewall

Configuration screen for Windows 10 firewall
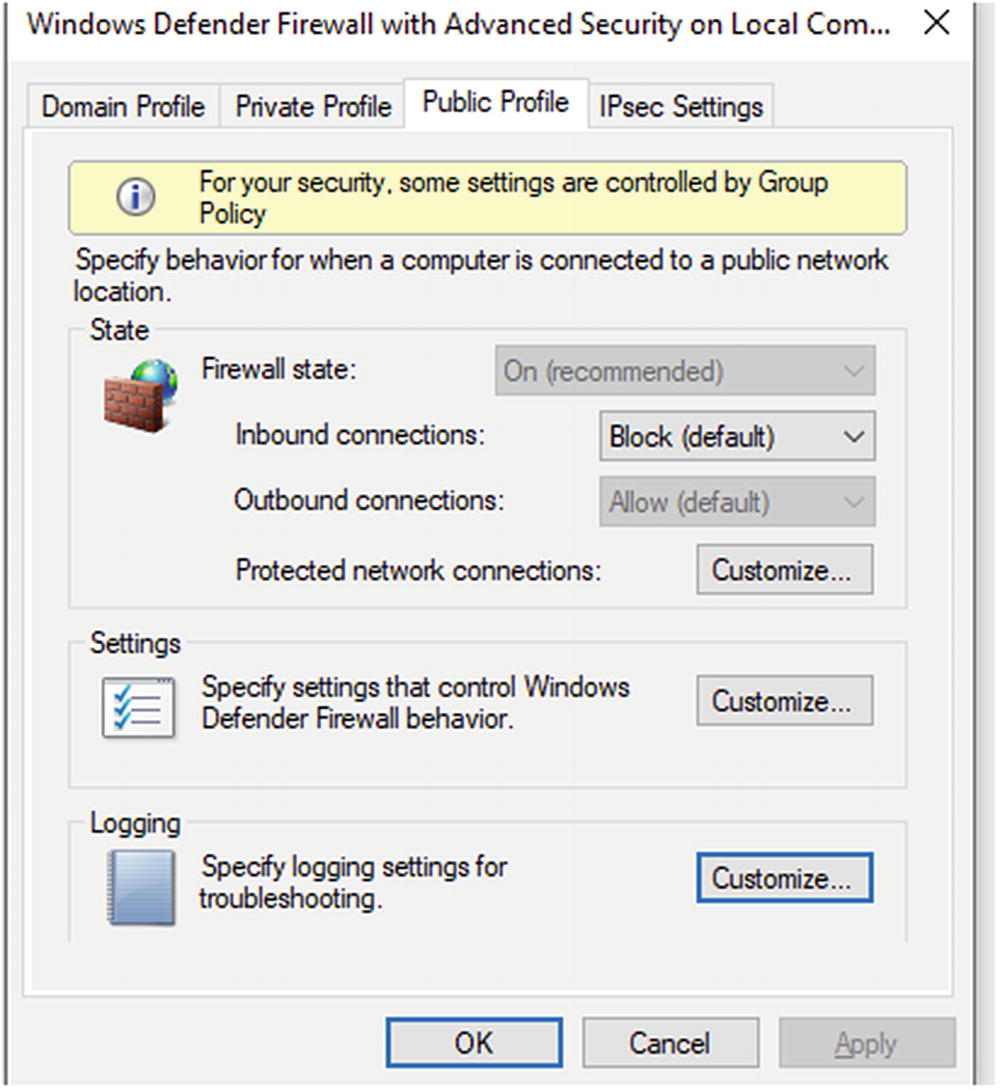
Pop-up box where firewall profiles are configured
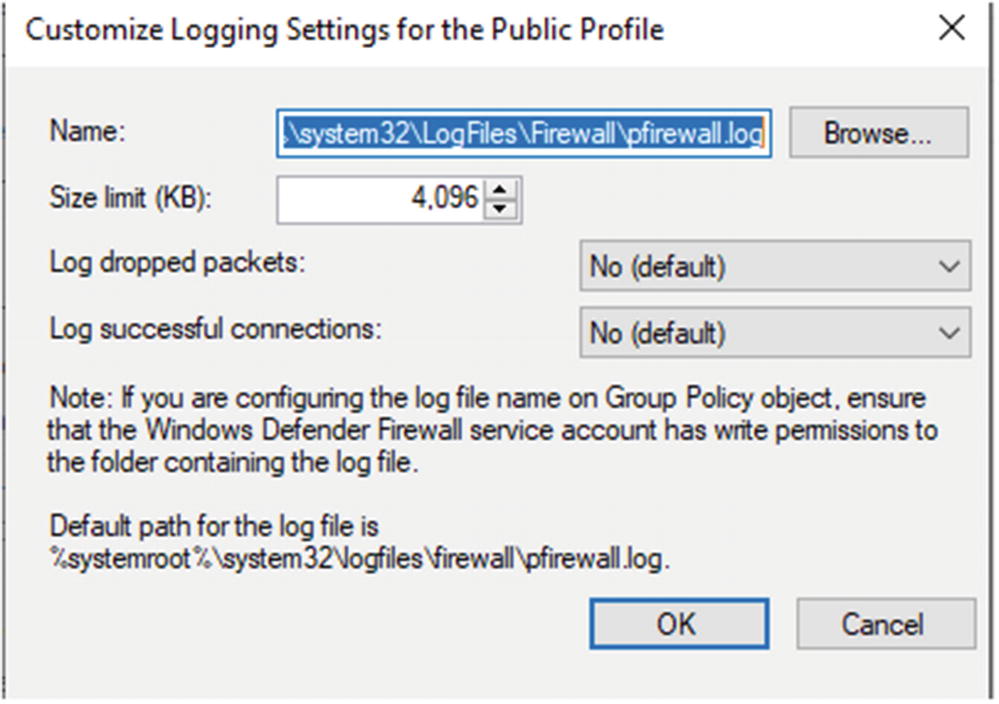
Customized settings for Windows Firewall Logging
Administrator also set what is logged, successful connections, and dropped packets. Each of these can be interesting to analysts monitoring endpoint behavior. Another key setting is log size. If the log is too small, it may have important data overwritten. If the setting is too large, performance issues are possible since logs reside on disk.
Configuration of what to monitor is best done when moving logs into the SIEM solution. Depending on the solution employed, filtering can occur during collection and forwarding by the agent or at the log aggregator before logs are indexed and pushed into long-term storage.
Windows Event Logging

Windows Event Viewer logs by category
Clicking each shows the details in a pane to the right of the category listing. Demonstrations are shown here.
Microsoft Sysinternals Suite
Sample of tools offered by the Microsoft Sysinternals Suite.
Tool | Description |
|---|---|
AccessChk | Shows administrators access users and groups have to files, directories, registry keys, global objects, and Windows services |
AccessEnum | Provides a view of file system and registry security settings |
AdExplorer | Active Directory viewer and explorer |
AutoLogon | Allows for specified user to be automatically logged into a system |
AutoRuns | Shows all programs configured to run at boot up and user login |
BgInfo | Displays configuration information about a computer on the desktop background. Examples include computer name, IP address, service pack, and more |
BlueScreen | Simulates a blue screen of death |
CacheSet | Used to modify and tune the system cache sizes |
Contig | Contig is a single file defragmenter |
DiskMon | Logs and displays all hard disk activity on a system |
DiskView | Displays a graphical image of the hard disk |
DiskUsage (DU) | Reports on disk space usage for the directory identified |
EFSDump | This is the encrypted file system |
FindLinks | Reports on the file index and the hard links for any specified file |
Handle | This utility displays files opened by programs, object types, and handles of a program |
ProcDump | This is a command-line tool used to analyze and understand the causes of spikes and crashes within a system |
ProcessExplorer | Process explorer shows the handles and DLLs a process has opened or loaded |
Process Monitor | Shows real-time file system, Registry, and process/thread activity |
PsExec | Allows for execution of processes on remote systems |
PsFile | Command-line utility that lists open files remotely |
PsGetSid | This translates SIDs to their display names and vice versa |
PsInfo | Command-line tool that gathers information about local/remote Windows 2000/NT systems. Give all the vitals including installation, kernel build, owner, number of processors, memory, etc. |
PsKill | Allows administrators to kill processes by either using the process name or process ID |
PsList | Allows for viewing several parameters related to processes running on a machine |
PsLoggedOn | Allows administrators to see who is using resources on a remote machine |
PsLogList | Allows administrators to access Windows Event Viewer logs and retrieve message strings on the logs of interest |
PsPasswd | Assists with mass changing of passwords on computers managed by the administrator |
PsPing | Administrators can use ping, TCP ping, to test for bandwidth and latency issues |
PsService | Displays the status, configuration, and dependencies of a service |
PsTools | All the previously documented PS tools can be downloaded in one package using PSTools |
RegDelNull | Assists in searching for and deleted Registry keys with embedded null characters |
Autoruns, process monitor, and process explorer are used by malware analysts and reverse engineers. Other tools are valuable to administrators and others troubleshooting network and endpoint issues.
Microsoft Sysmon

Windows Security Events during startup
These events show process creations and logons. Figure 5-5 shows 114 events were logged during system startup.
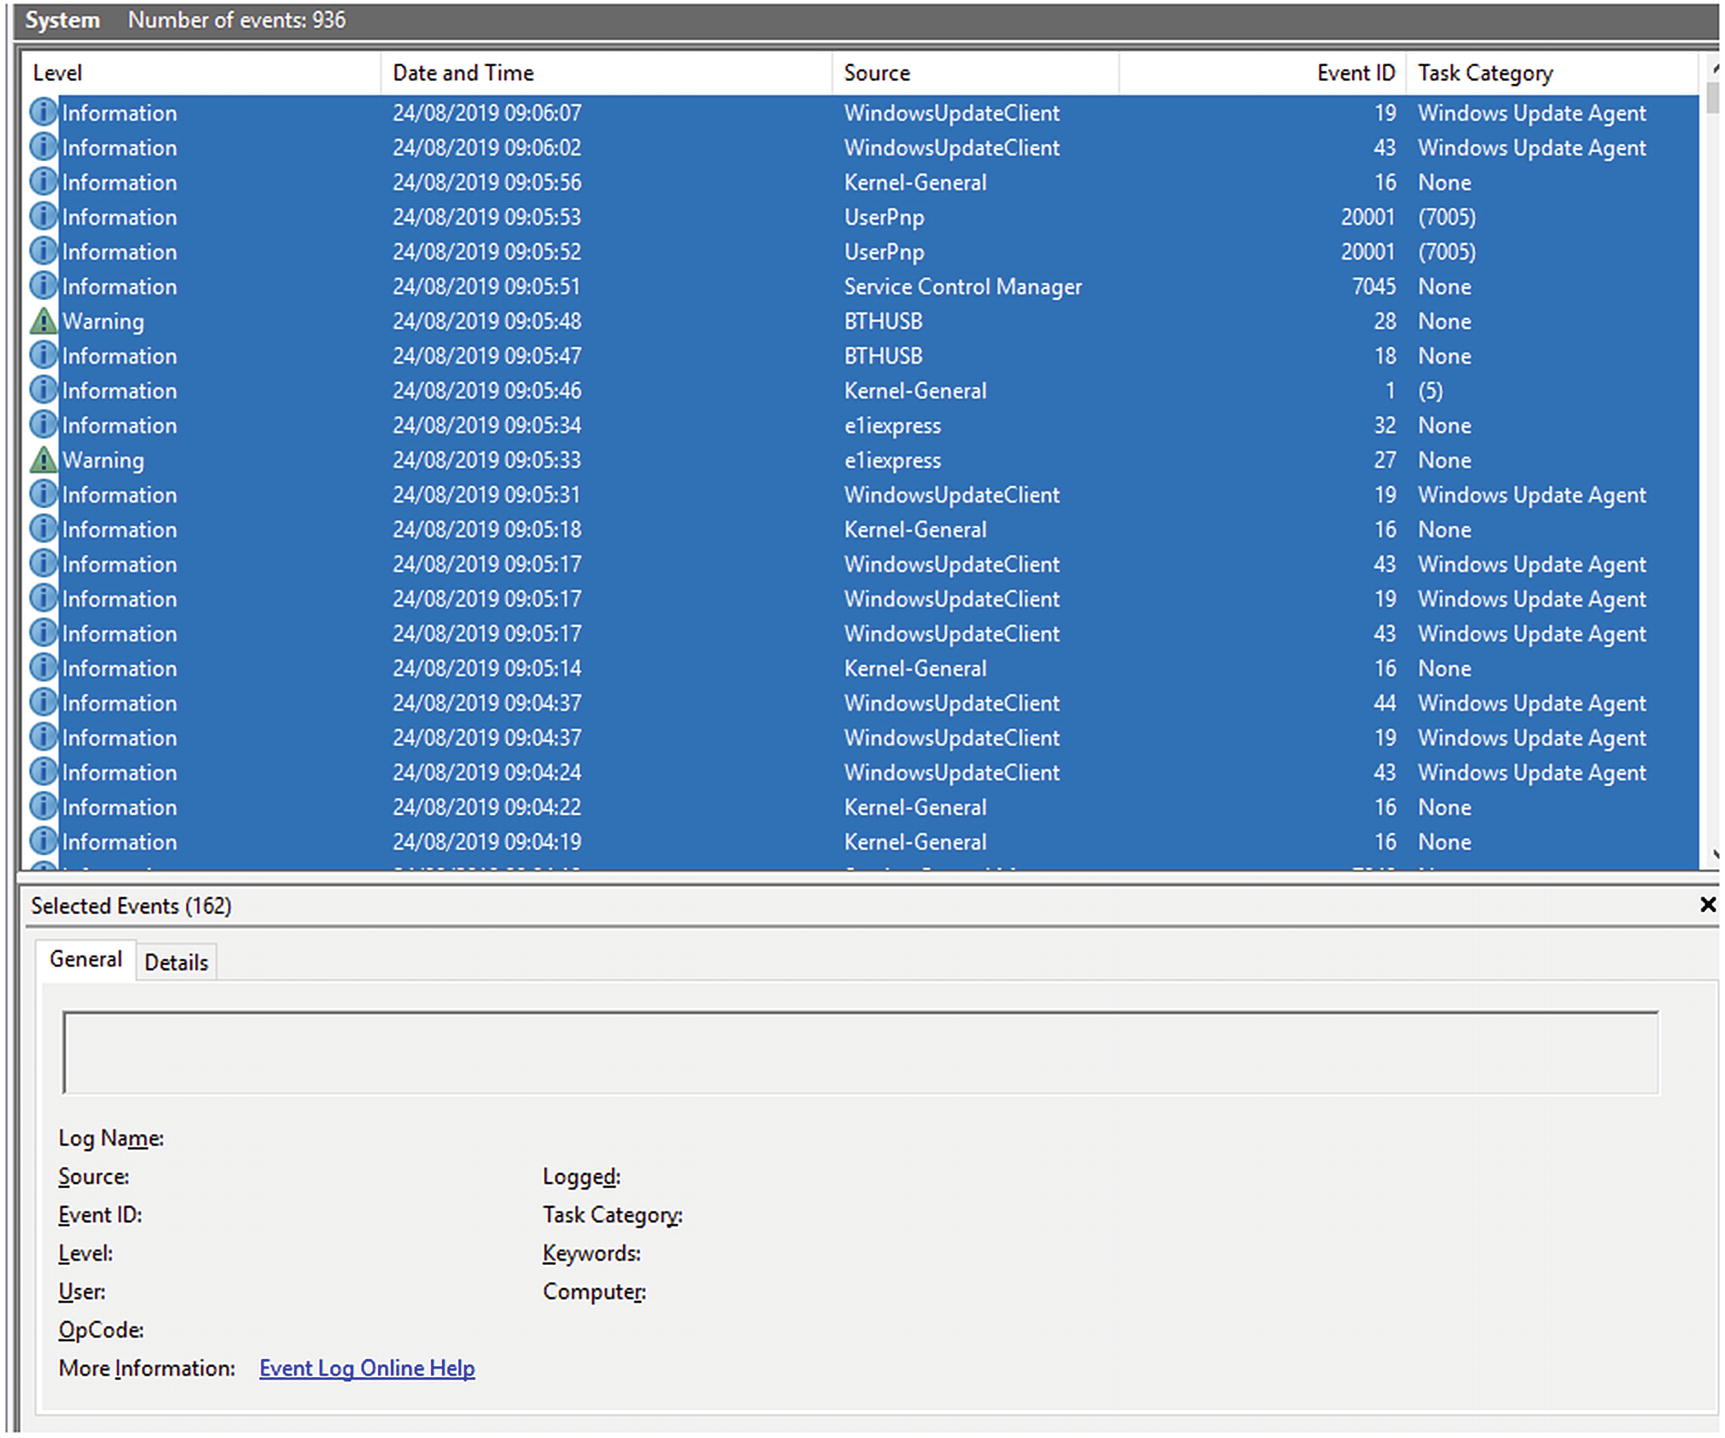
System Events logged during Windows startup
Events logged by Sysmon
Event ID | Description |
|---|---|
1 | Process created |
2 | Process changed file creation time |
3 | Network connection event logs |
4 | Sysmon service state changed |
5 | Reports when a process is terminated |
6 | Information about a driver when loaded |
7 | Image loaded |
8 | CreateRemoteThread |
9 | RawAccesRead |
10 | ProcessAccess |
11 | FileCreate |
12 | RegistryEvent (Object create and delete) |
13 | RegistryEvent (Value Set) |
14 | Registry Event (Key and Value Rename) |
15 | FileCreateStreamHash |
17 | PipeEvent (Pipe Created) |
18 | PipeEvent (Pipe Connected) |
19 | WmiEvent (WmiEventFilter activity detected) |
20 | WmiEvent (WmiEventConsumer activity detected) |
21 | WmiEvent (WmiEventConsumertoFilter activity detected) |
22 | DNS Event (DNS Query) |
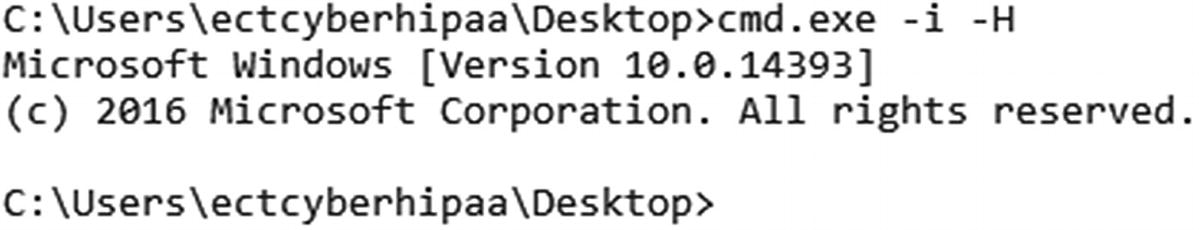
Command-line execution starting a new process
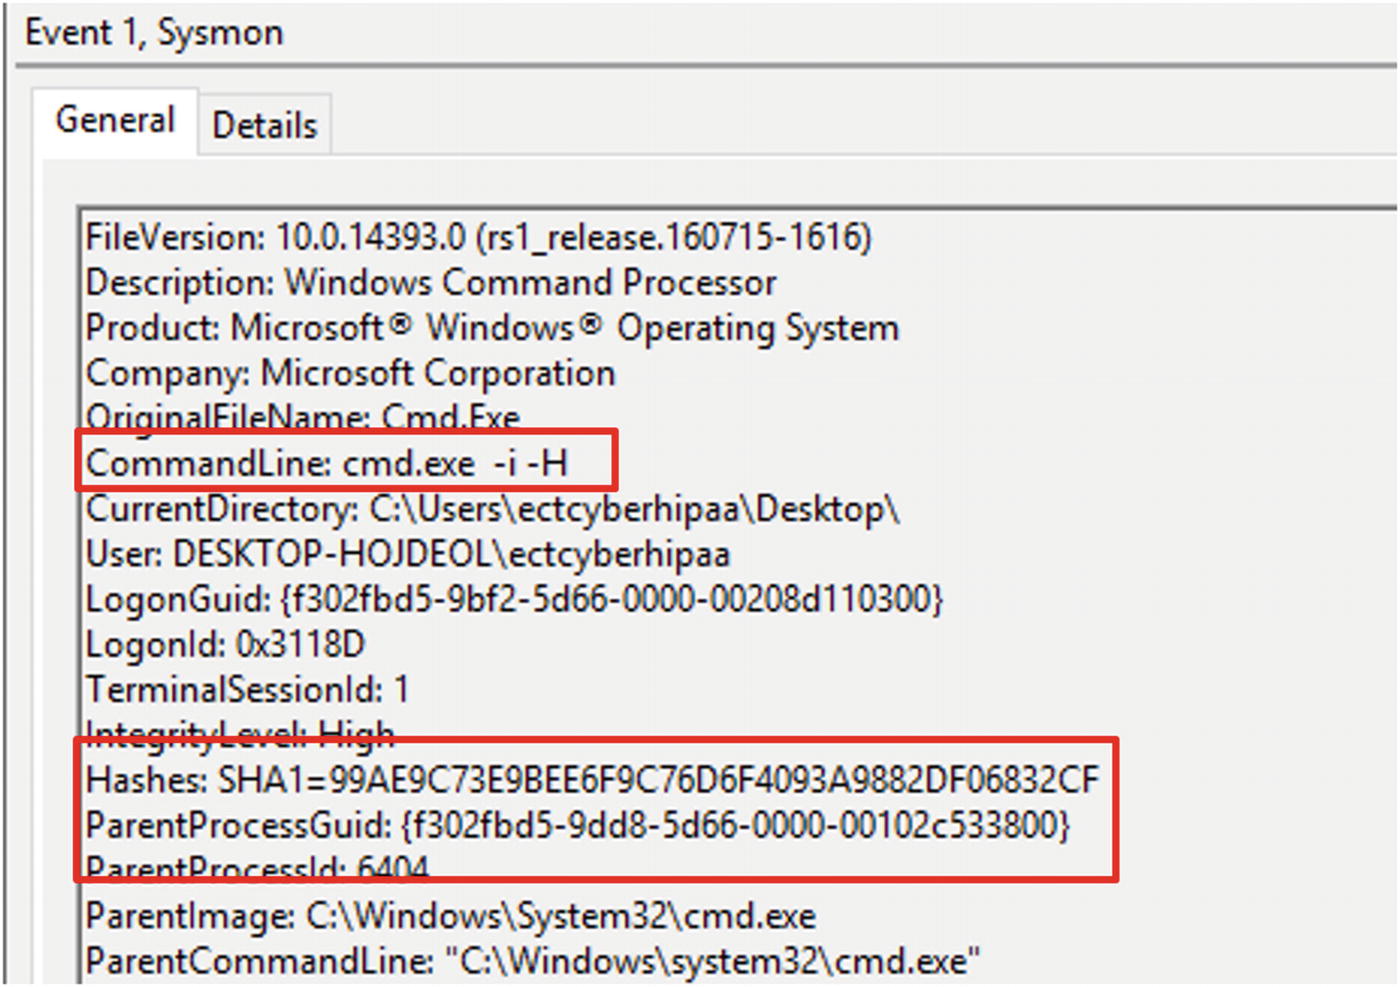
Details of the Sysmon logged event. The command executed in Figure 5-7 appears in the sixth line from the top

Command executed to turn on all firewall profiles in Windows 10

Command line used to activate the firewall profiles captured by Sysmon
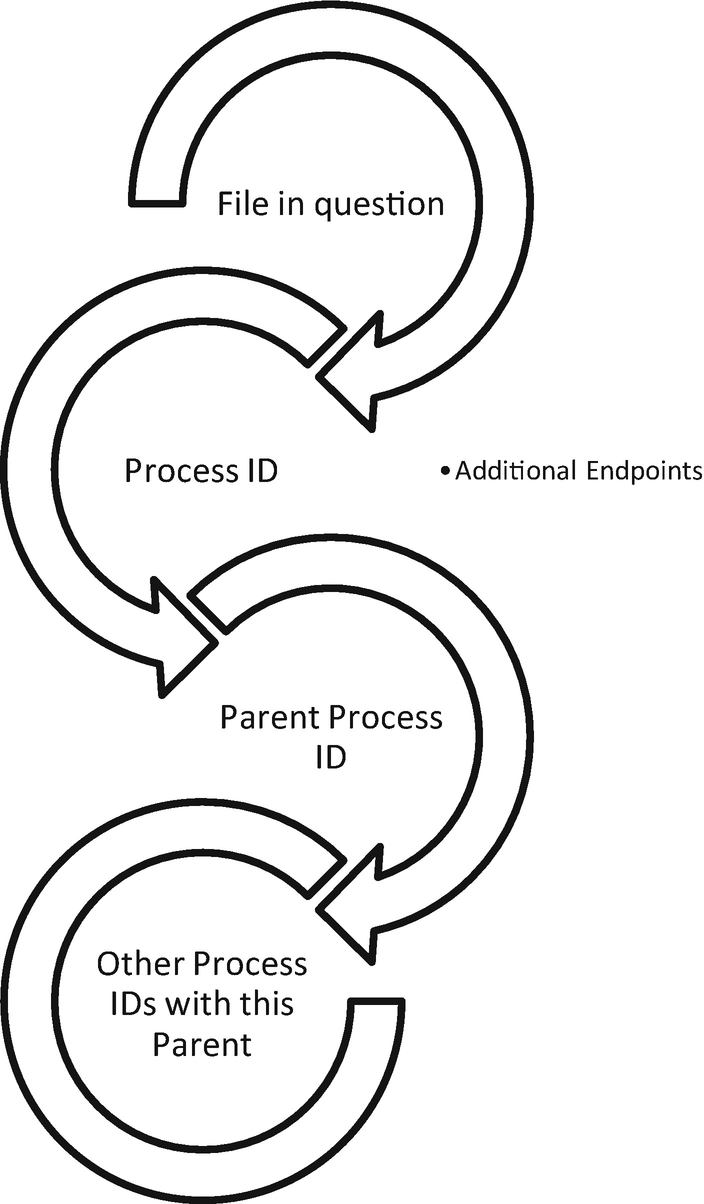
Threat hunting with Process and Parent Process IDs
More data points for understanding normal baselines in the environment
Increasing the efficiency of the cybersecurity team when searching for unusual occurrences in the network
Endpoint Security Suites
Crowd Strike Falcon
Carbon Black cb Response
FireEye Endpoint Security
RSA NetWitness Endpoint
Cybereason Total Endpoint Protection
The Network
Many entities struggle to understand what is happening on the wire. Baselines of protocol use, services, and connections and an understanding of why these things are happening rarely exist in most organizations, especially healthcare entities. It is impossible to spot anomalies if no understanding of what normal looks like exists. A detailed walkthrough of Zeek takes place in the “Intrusion Detection Systems” section. Zeek is more than simply and IDS solution. It is a network analyzer. It can find abnormal uses of network protocols, such as HTTP over an uncommon port. It is able to do this because Zeek recognized HTTP traffic by characteristics such as GET and POST requests, not relying on the ports used during the session. When Zeek sees this on unexpected ports, it can log this activity. This capability to parse application layer protocols makes it perfect for gaining an understanding of what is happening on the network daily. Overtime a baseline is created.
Intrusion Detection Systems
Intrusion detection systems (IDS) are a front-line monitoring/detection tool. In passive mode, the IDS is connected to a mirroring port on a switch. The best placement for a passive IDS is connected to a core switch where a significant portion of the network traffic flows. This is commonly referred to as a choke point. Intrusion detection can also operate inline, blocking traffic based on rule matches. Operating inline means the solution also acts in an intrusion prevention manner. Time and care are necessary to tune the rules, so detection errors are minimized. The most common error is the false positive, alerts SOC analysts respond to that turn out not to be real intrusions. Worse are errors for traffic that should generate an alert or be blocked that passes through the IDS undetected. False positives are dangerous because they become a denial of service because traffic is stopped that should be allowed to continue. Business processes are halted. Inline placements of IPS solutions also need to consider throughput. High-volume traffic times can overload the IPS device causing packets to be dropped and potentially malicious traffic to continue unabated.
Architecting and Deployment
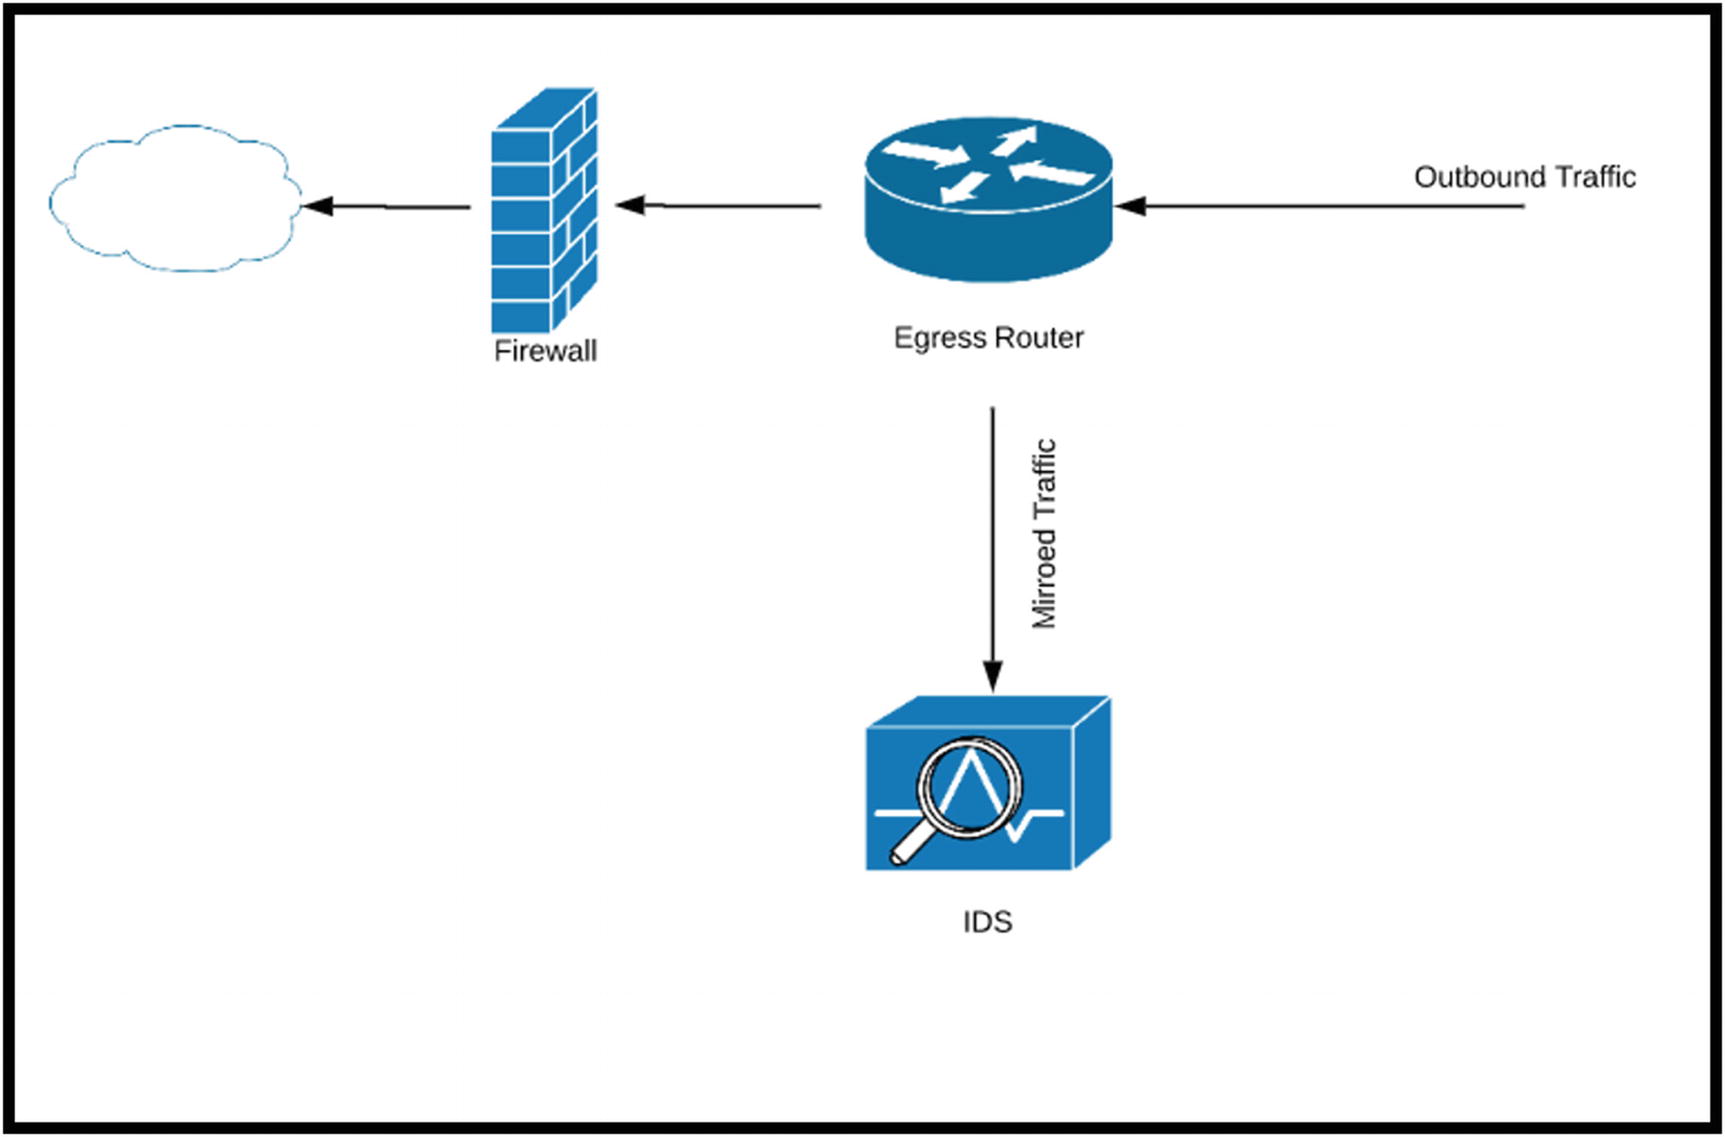
Deploying an IDS such as Snort to capture ingress/egress traffic
Deployments should also be placed to capture east-west traffic, traffic traversing inside the network not destined for external locations. This is an important piece of visibility. When unauthorized individuals are inside the network, IDS devices can capture traffic indicating lateral movement. Other considerations when deploying an IDS include the data to protect and an understanding of threats and vulnerabilities in the network. This context is necessary to develop rules applicable to the entity.
Zeek
Zeek log file descriptions.
Log | Activity Captured |
|---|---|
Conn.log | All TCP/UDP and ICMP connection |
DHCP.log | Listing of all DHCP leases |
DNS.log | DNS queries and answers |
HTTP.log | HTTP requests and replies |
Files.log | Connections with files contained |
Pe.log | Connections involving the movement of portable executables |
Intel.log | Matches to threat intelligence integrations with Zeek |
Notice.log | Notices generated based on matches in bro scripts |
Signatures.log | Matches to signatures |
Dpd.log | Dynamic protocol detection |
Software.log | Logs software in use on the network |
Weird.log | Unexpected network behavior |
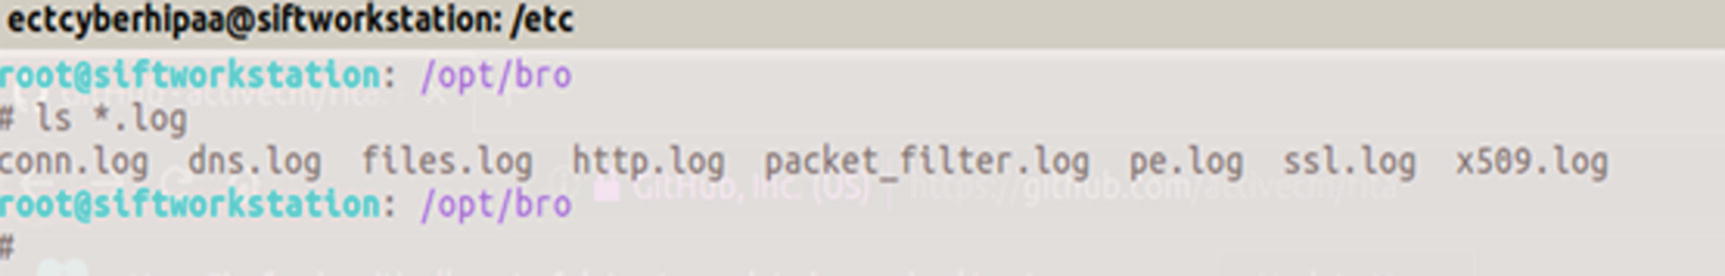
Screenshot of the logs available after running a PCAP through Zeek
conn.log
dns.log
files.log
http.log
pe.log

Output of the conn.log viewing connections from source to destination and the number of packets transferred in each direction
Zeek connection states
Conn_state | Description |
|---|---|
S0 | Connection attempt seen, no reply |
S1 | Connection established, not terminated |
SF | Normal establishment and termination |
REJ | Connection attempt rejected |
S2 | Connection established and close attempt by originator seen (but no reply from responder) |
S3 | Connection established and close attempt by responder seen (but no reply from originator) |
RSTO | Connection established, originator aborted (sent an RST) |
RSTR | Responder sent an RST |
RSTOS0 | Originator sent a SYN followed by an RST; we never saw a SYN-ACK from the responder |
RSTRH | Responder sent a SYN ACK followed by an RST; we never saw a SYN from the (purported) originator |
SH | Originator sent a SYN followed by a FIN; we never saw a SYN ACK from the responder (hence, the connection was “half” open) |
SHR | Responder sent a SYN ACK followed by a FIN; we never saw a SYN from the originator |
OTH | No SYN seen, just midstream traffic (a “partial connection” that was not later closed |
Figure 5-15 shows two commands so analysts can see the top source and destination IP addresses. By using AWK, a scripting language used to parse text files, and great for parsing through Zeek logs, we can see 10.5.1.102 was the most talkative internal endpoint. Three connections originated from 185.117.119.157, which is an external address.
Keep in mind we are focusing on continuous monitoring in this section. This packet did come from Brad Duncan at Malware-Traffic-Analysis with a sample of Emotet and TrickBot. We are not conducting forensic analysis right now; the purpose of this section is to show how Zeek can help establish a baseline and find anomalous situations.
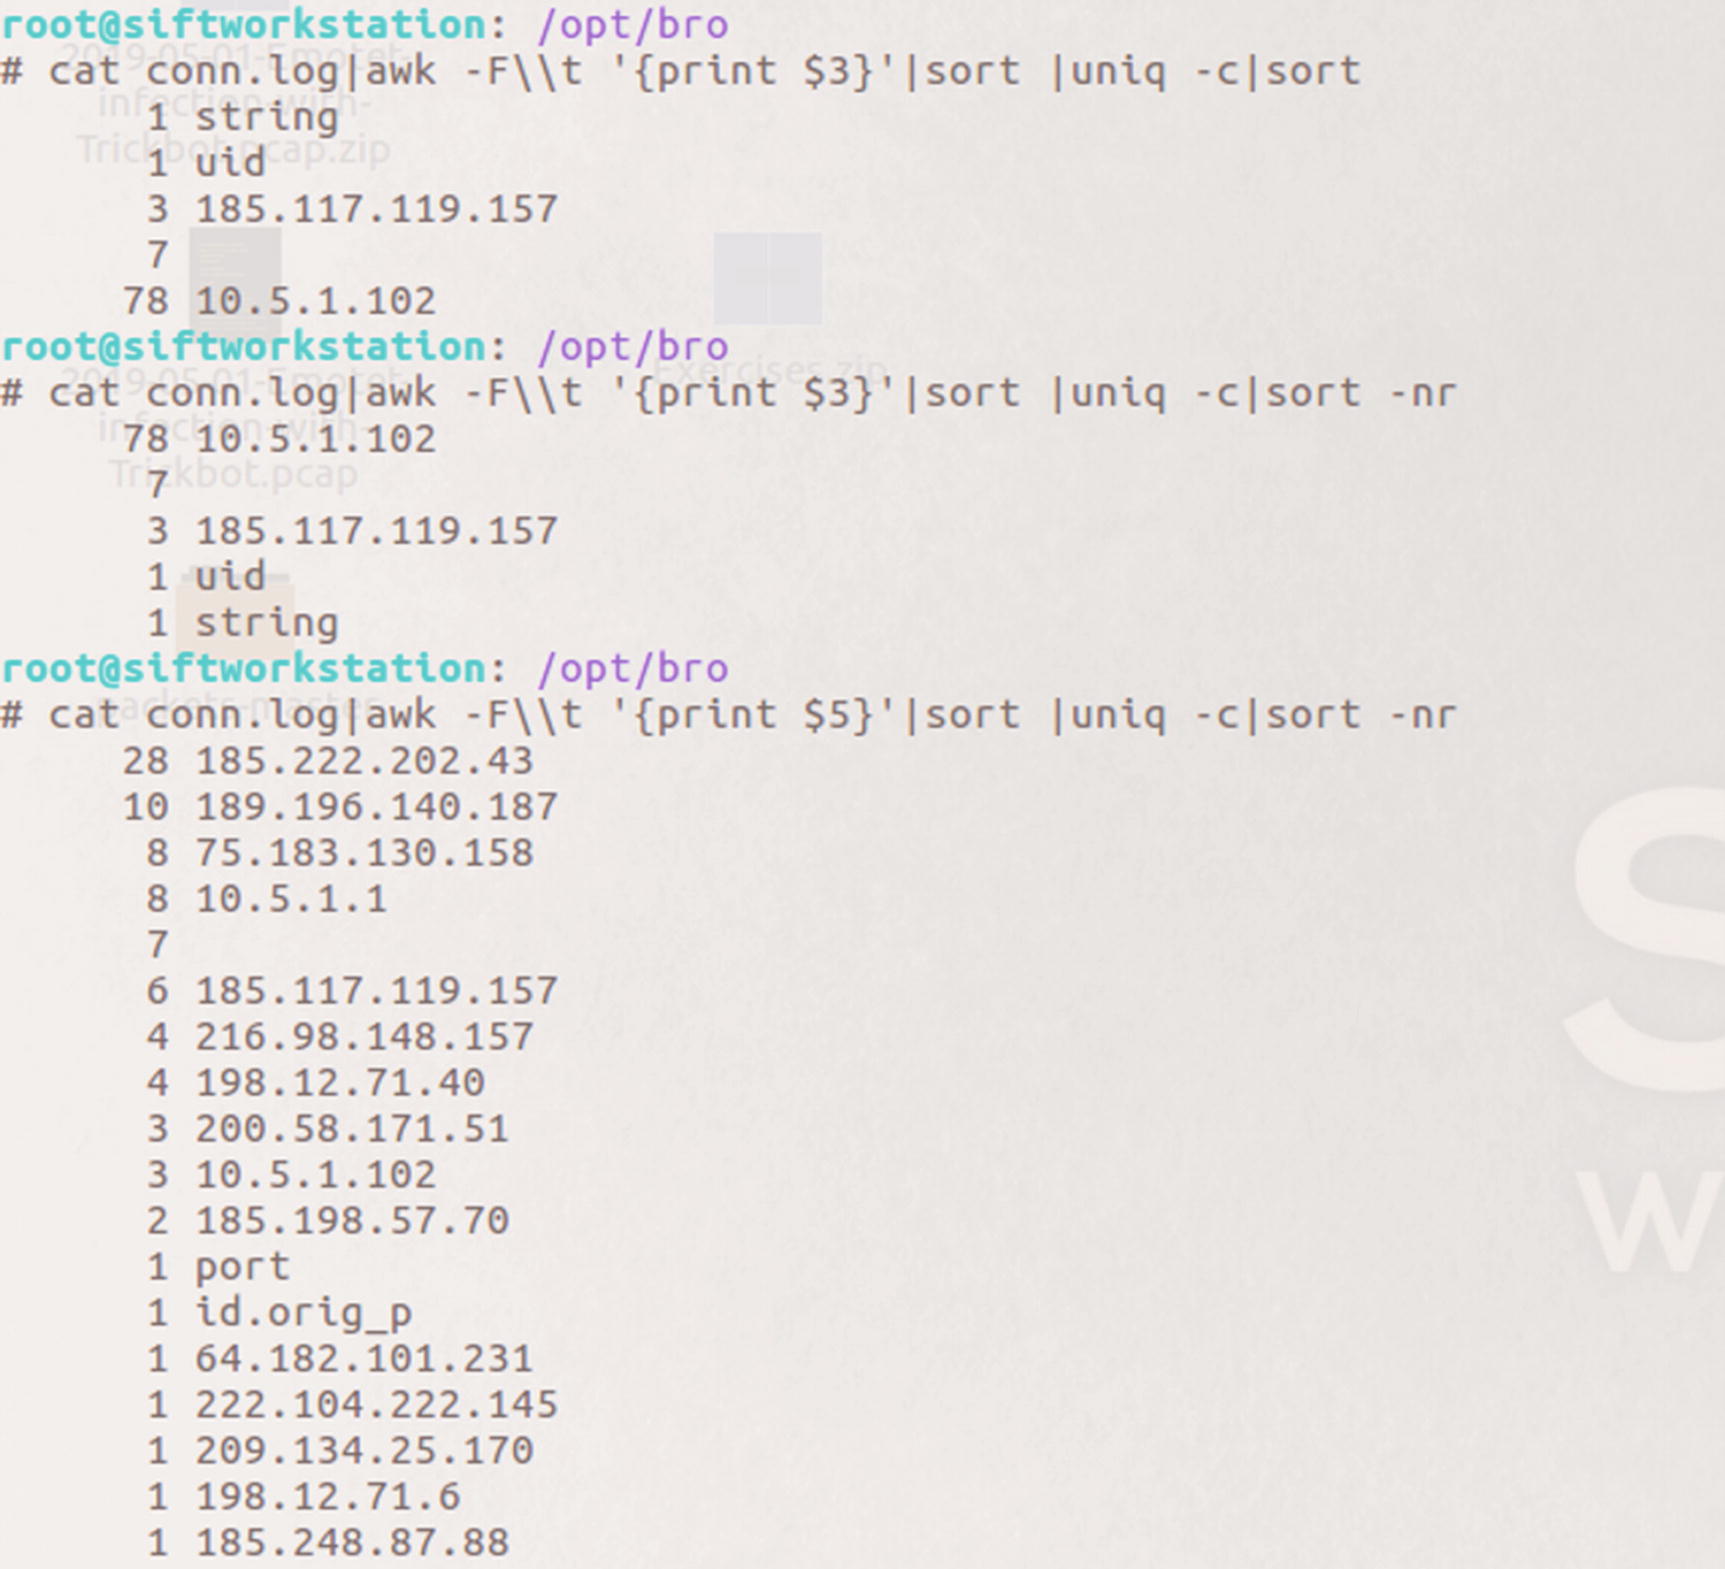
Example output showing top connections for source IP addresses and destination IP addresses
Here we see two addresses with double-digit connections. 185.222.202.43 was the destination 2.8 times more than the next busiest destination with 28 total inbound connections. Depending on the context of the situation, this could be meaningful to an analyst. Knowing we are looking at traffic of a known malware attack, these two addresses make a good starting point for an investigation.
id.orig_h: Source of the query
query
query type
answers
TTL of the query
Size of the payload
If Zeek is deployed where it sees traffic between the endpoints and the internal DNS server, analysts can see what endpoint made all the requests. This is the east-west traffic discussed earlier. If the deployment only analyzes traffic at the egress point, all the DNS requests appear to come from internal DNS server, out to the authoritative DNS server externally. This helps analysts see spikes in requests by an endpoint. Obviously, visibility into the queries is an important data point in the log. The type of query is important because certain types like TXT are used during C2 and data exfiltration. The number of answers to queries can indicate C2 traffic. Monitoring for queries returning ten or more answers, for example, might indicate C2. The time to live (TTL), anomalous because the value is either much lower or higher than typical values, may indicate malicious activity. One example is monitoring the size and duration of the communications for evidence of data tunneling via DNS.

The contents of the Zeek DNS log after reading the Emotet/Trickbot packet capture into Zeek
Common DNS record types and uses
Request Type | Description |
|---|---|
A | The most common request, maps a hostname to the IP address when IPv4 is used |
AAAA | IPv6 mapping of hostnames to IP addresses |
MX | Points to the SMTP server for a specific domain |
TXT | Small field used to carry additional data, often used by attackers to exfiltrate data |
PTR | Seen during reverse DNS lookups |
CNAME | Forms an alias to another hostname |
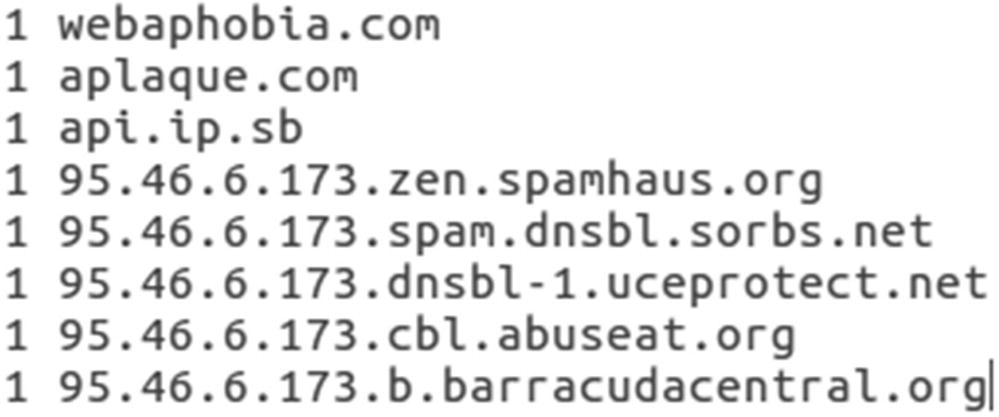
DNS log output showing the unique queries captured by Zeek
Zeek stores logs in a directory by date. Inside the directory each log is compressed into one log for each hour. The logs are searchable by the analysts. If the SOC team suspected an endpoint was beaconing to a command and control server using DNS, an analyst can search those logs over the suspected date range and look for evidence of command and control.
fuid: Identifier associated with a single file
tx_hosts: Source of the transfer over the Internet
rx_hosts: Destination of the host or hosts file traveled to
source: Network protocol used to transfer file
mime type
file name
seen bytes: Number of bytes provided to the file analysis engine
MD5: An MD5 digest of the file contents
SHA 1: SHA 1 digest of the message contents
SHA 256: SHA 256 digest of the message contents

File names captured by Zeek when reading the Emotet/TrickBot pcap
The * is a wildcard symbol that means search through all files with the .log suffix and look for the fuid value assigned to the grep command. Any return communications showing results will also be of interest to the analysts. This is demonstrated here during the PE log discussion.
grep is a regular expression engine used to search text-based files and return values based on the search parameters. We are using it here to find our fuid in other log files and return the entry to the screen.
It is also easy to assess the hash values. Uploading to a site such as VirusTotal scans the values and reports matches against any of the 50+ malware engines available.
Method: GET/POST and so on
url
referrer
user_agent
request_body_length
response_body_length
status_code

Analysis of the Zeek http.log showing the HTTP connection associated with the executable file

Results of the search for the id found in the pe.log file
Both executable file ids return information from the http.log file. What is not shown is a GET request from 209.134.25.170. The GET request method was linked to webaphobia.com, a domain seen earlier. GET requests are HTTP methods used to download information from a web site. This action downloaded an image file.
Real Intelligence Threat Analytics (RITA)
Beacons
Blacklisted hostnames
Blacklisted source IP addresses
Blacklisted destination IP addresses
Exploding DNS – DNS requests with large amounts of subdomains
Long connections
Strobes
User agent strings
This is another tool available to SOC teams to identify unwanted communication and activities in the network.
Snort
Snort is one of the more well-known intrusion detection/prevention solutions. It is open source and available for download at snort.org. Snort makes it easy for entities to get started. Depending on the infrastructure in place, Snort has downloads and repositories available for many flavors of Linux and Windows as well. There are three tiers of rules available for newcomers to Snort. There are the Community Rules available for all who download and begin to use Snort. Users who create an account with Snort get an oinkcode and get the rules for registered users. There is a set of rules available for users who pay for a subscription. Security operations teams can also write custom rules based on the environment and what the team needs to monitor.
Just as was discussed in the IDS section, Snort can be configured to run inline as an intrusion prevention systems (IPS) blocking and taking action against unwanted traffic, or it can be used as an IDS, monitoring and logging events of interest. If the business is interested in only passive mode, a copy of traffic can be sent to Snort via a network tap or aggregator or by using a SPAN port to send the traffic to Snort.
How Snort Works
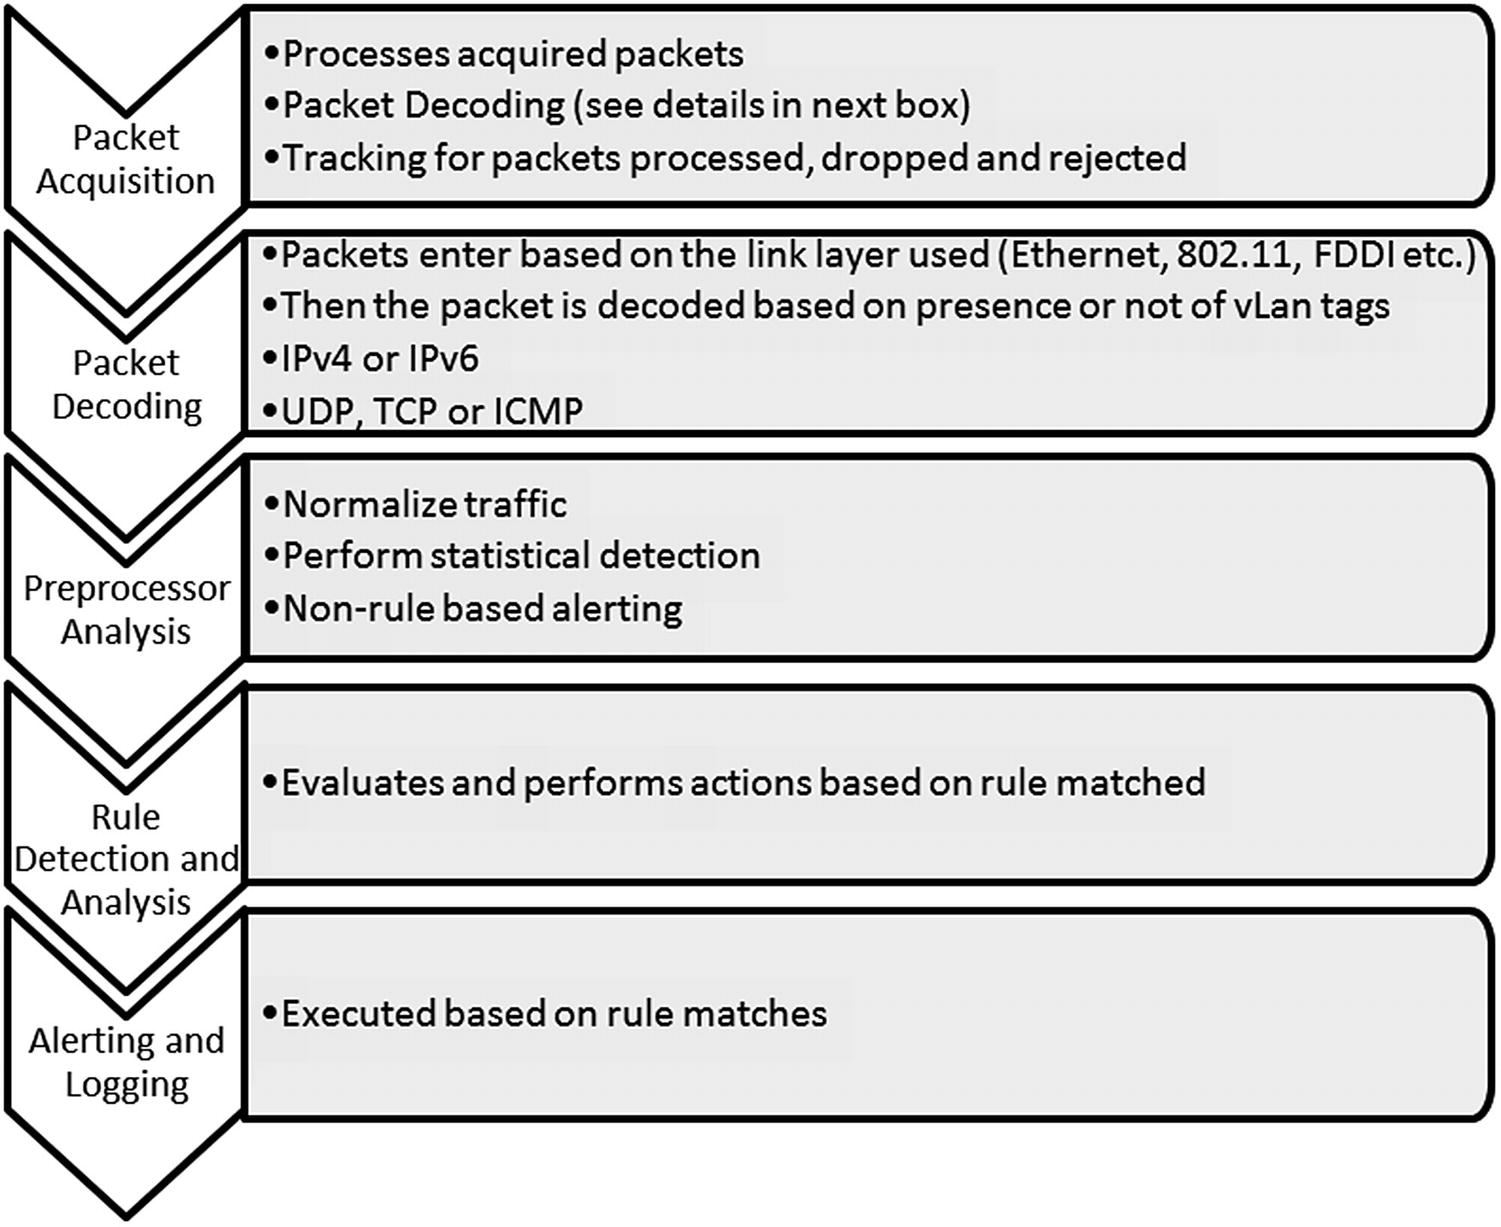
Activities performed internally by Snort
Forwarded without modification
Forwarded with replacement content
Rejected
Silently dropped
Snort processes packets one by one. If Snort gets behind on packet processing, limited buffering cannot prevent packets from dropping and not being processed. Dropped packets cause traffic of interest to be missed. This applies if Snort is running in passive mode, receiving copies of traffic from a network device. If Snort is running in inline mode, then packets are not dropped, but network performance issues may occur.
Packets are decoded based on the type. An Ethernet packet is passed into the decoder where once the Ethernet portion of the packet is decoded it passes to the IP layer. If virtual LANS (vLANs) are used, 802.1Q decoding occurs. This is the protocol used for vLANs.
If the IP protocol used is IPv4, then Snort decodes this layer as such. Then based on the transport layer protocol used, TCP, ICMP, or UDP decoding comes next. This process prepares the packet for the preprocessor and rules engine. Common preprocessors used once packets are decoded include fragmented packets are reassembled, verification packets are part of an established session, and preprocessors exist to examine the application layers and find incorrect implementations of protocols. Once the pre-processing is complete, packets are evaluated against the rules in Snort and actions are taken based on the rule header: alert, log, drop, and so on.
Snort Rules
App (Application)
Browser
Content
Deleted
Exploit-Kit
File
Indicator
Malware
NetBIOS
OS
Policy
Protocol
PUA
Server
SQL
X11
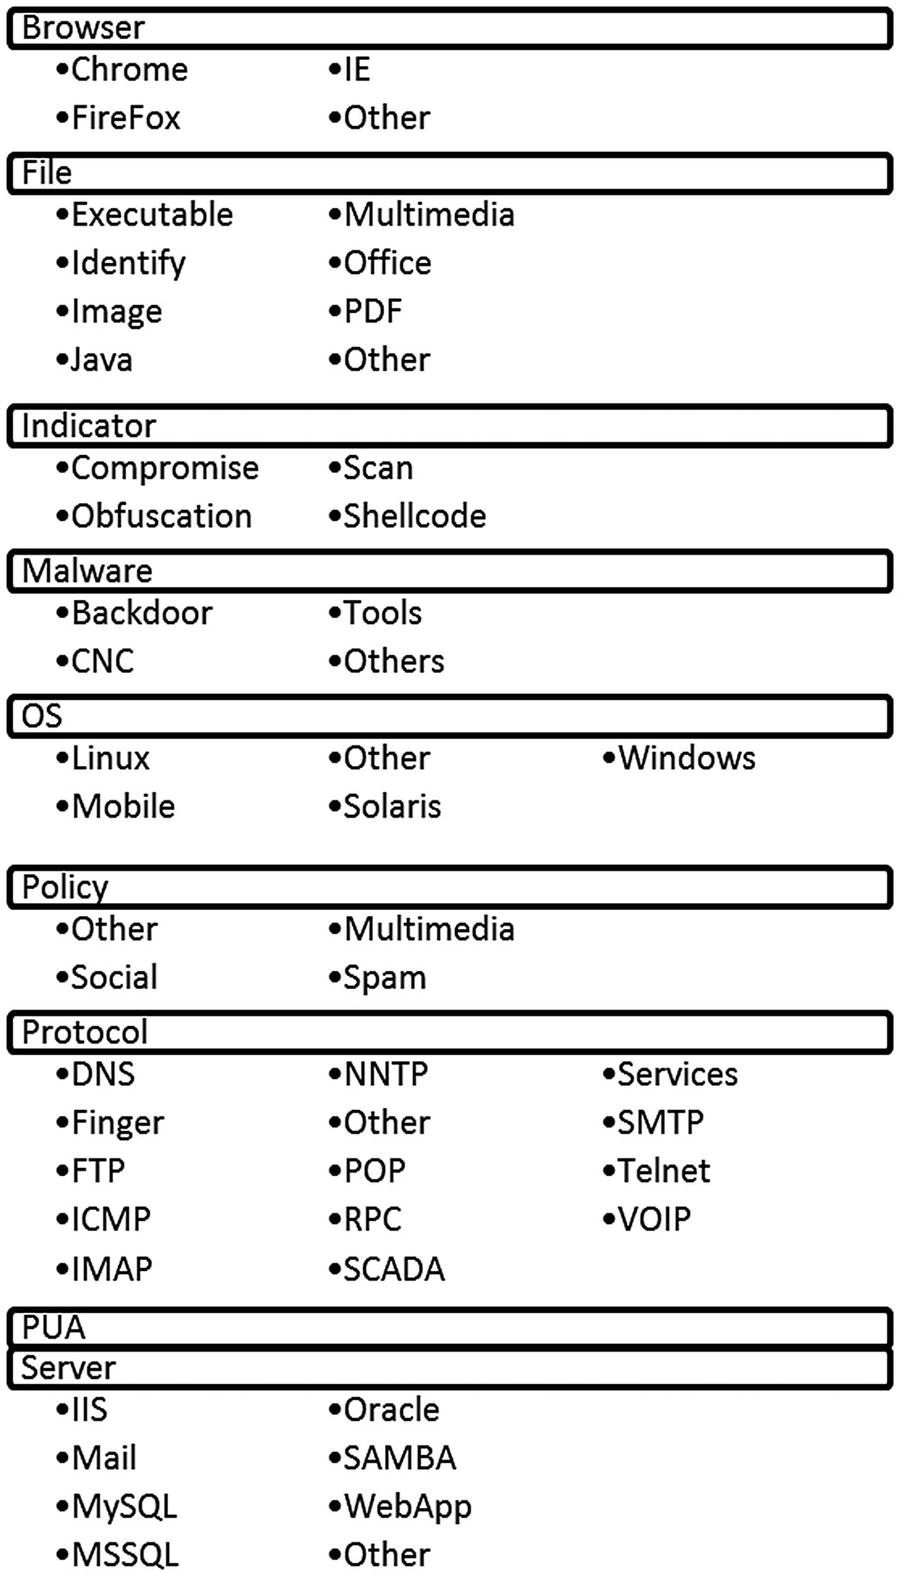
Snort rule categories and sub-categories
The nice thing about this set-up in Snort is the ease of configuration when it comes to certain types of rules. If, for instance, a standard exists within the entity to only use Internet Explorer (IE) in the environment, then the rules for Chrome, Firefox, and others can be disabled allowing for less overhead by the rules engine when examining packets. The only alert necessary might be to detect uses of other Internet browsers. That way, no rule in those categories triggers and wastes analysts’ time. Same can be said for the non-Windows-based operating systems. If no operating systems outside of Windows are used, then none of those rules need to be enabled making the processing of packets more efficient.
How Rules Are Constructed
Action: Alert, log, pass, block
Protocol
Source IP Address and Port
Destination IP Address and Port
Direction
This rule alerts on a TCP connection with any external address communicating on any external port to the network on port 80. The -> designates the flow is inbound. The options section is where content matching can occur on the rule. As this is written, any connection made from an external location to an internal resource on port 80 will trigger an alert.
this tells Snort to begin looking for the interesting content at byte offset 100. Snort will search the rest of the packet for the content match.
This matches on A and B within 10 bytes of A. If we were worried about content matches with at least several bytes between, then the distance parameter is used.
Snort processes rules in buckets. First Snort groups rules by protocol and port. TCP rules with port 80 are grouped; same for other ports using TCP. It will group all the TCP connections using 20 and 21 for FTP transmissions, 25 for SMTP, and so on. If there is not a protocol/port combination that applies to the packet, then it is evaluated separately. Once the rules covering protocol/port are evaluated, the contents are evaluated next. Snort evaluates content and fast_pattern match rules based on length. To differentiate between two content matches, Snort evaluates the longest non-negative content to match on. Fast_pattern allows shorter content to be specified for evaluation prior to longer patterns. As you can see, rules that do not specify a protocol/port combination or content are very inefficient.
Running Snort
Most times when used as a component of continuous monitoring, Snort will analyze traffic directed to it on a specified interface. Snort is also useful in examining traffic for investigative purposes. If an entity possesses captured traffic of interest that came from a part of the entity not monitored by Snort, the captured traffic can be analyzed by reading it into the solution.
The implementation of Snort used for the following demonstrations was configured to run on the SANS (SIFT) workstation. This workstation was developed as part of SANS Digital Forensics and Incident Response (DFIR) offerings.11 To run Snort against a PCAP, the analyst must be in the directory where Snort is located or specify the path to Snort. The path to the configuration file also needs to be specified on the command line.

Screenshot showing command to run Snort against a pcap

The number of rules and breakdown by category

Summary of packets analyzed by Snort
All the packets were Ethernet and IPv4. The majority were TCP protocol since only 16 were identified as UDP.
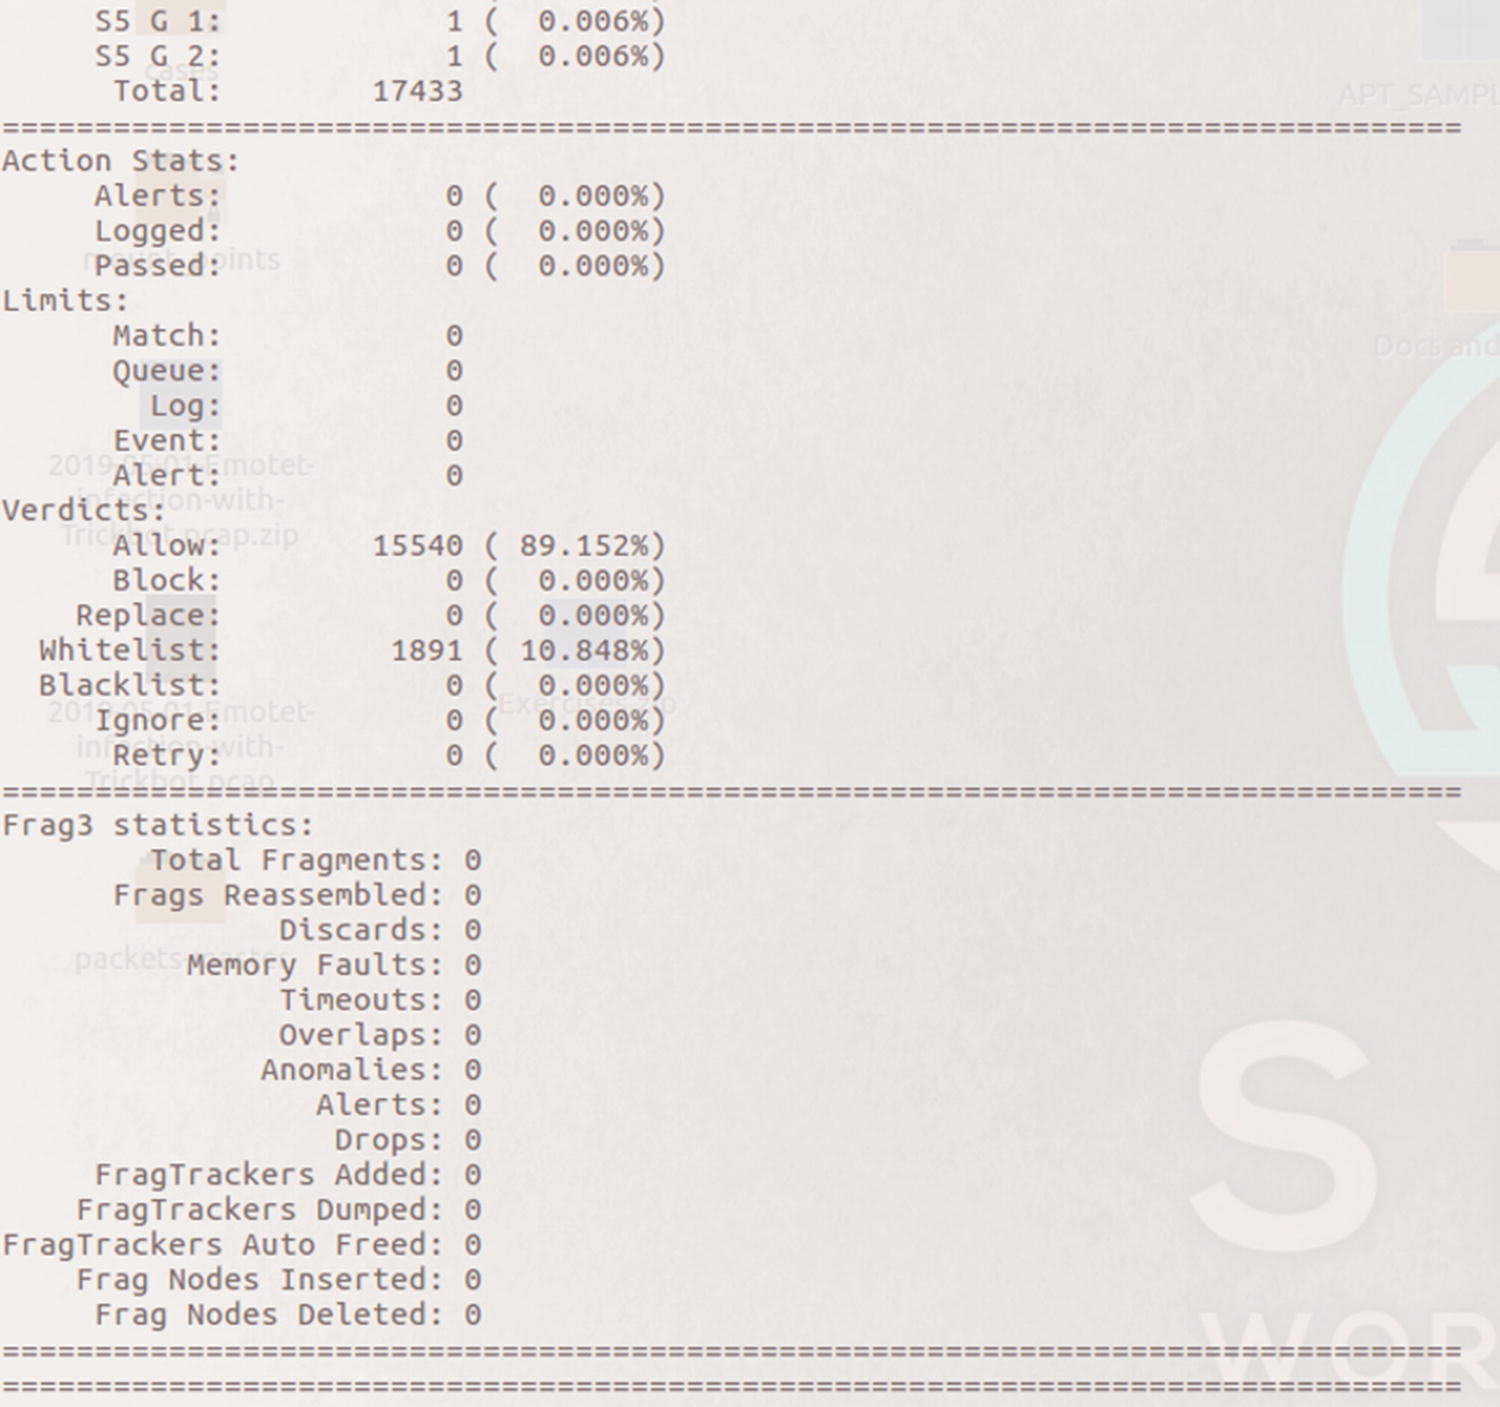
Actions taken by Snort and Frag3 preprocessor stats

Stream statistics and HTTP preprocessor statistics
Snort counted 75 total sessions, 67 TCP and 8 UDP. The stats also show 1709 segments were queued and released.
The next several figures highlight statistics of packets processed by Snort’s preprocessors. The first category in Figure 5-28 is the HTTP Inspect preprocessor. HTTP Inspect identifies HTTP fields and normalizes them for processing by the rules engine. Snort identified 24 HTTP request headers with 20 POST methods and 4 GET methods. In a client-server architecture, POST methods represent the client providing data to the server. A simple example is a user filling in form fields on a web site. A GET request method example is when someone requests a download of content from the web site.
The next section shows preprocessor stats for SMTP, mail traffic. This traffic capture did not contain mail traffic based on Snort’s analysis. Snort also did not identify traffic related to Distributed Computing Environment or Remote Procedure Call (DCE/RPC).

HTTP, SMTP and SSL preprocessor statistics
Snort Alerts
This rule looks for any endpoint and any port making an outbound connection attempt to the address and port listed in the rule. A threshold was set whereby only five alerts are generated in any given 60-minute time frame.
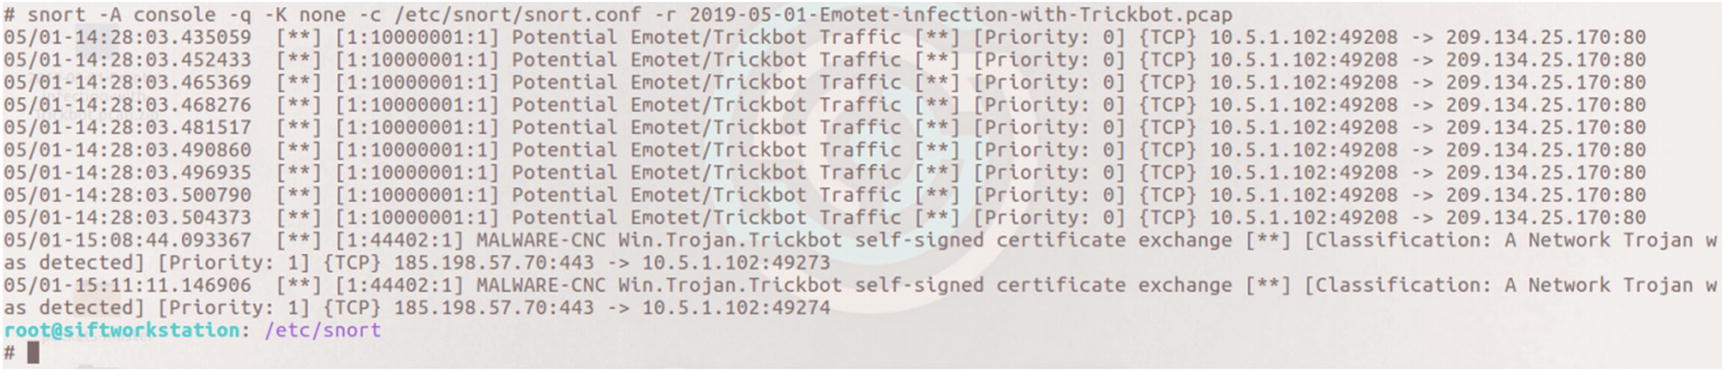
Alerts generated to the console when running the Emotet/TrickBot pcap against Snort

The content match of John_Alaska in the Snort rule 44402 detecting TrickBot command and control traffic
When alerts are generated, the first thing an analyst should do is review the rule to understand why Snort triggered the alert. Loading the Emotet/TrickBot traffic into Wireshark allows the analyst to verify the content causing the alert.
It is possible for Snort to capture packets when alerts are triggered so analysts can view the packet in question. Settings are also available to capture the preceding and succeeding packets. That setting was not utilized during this walkthrough.

Reviewing Conversations once traffic is loaded in Wireshark
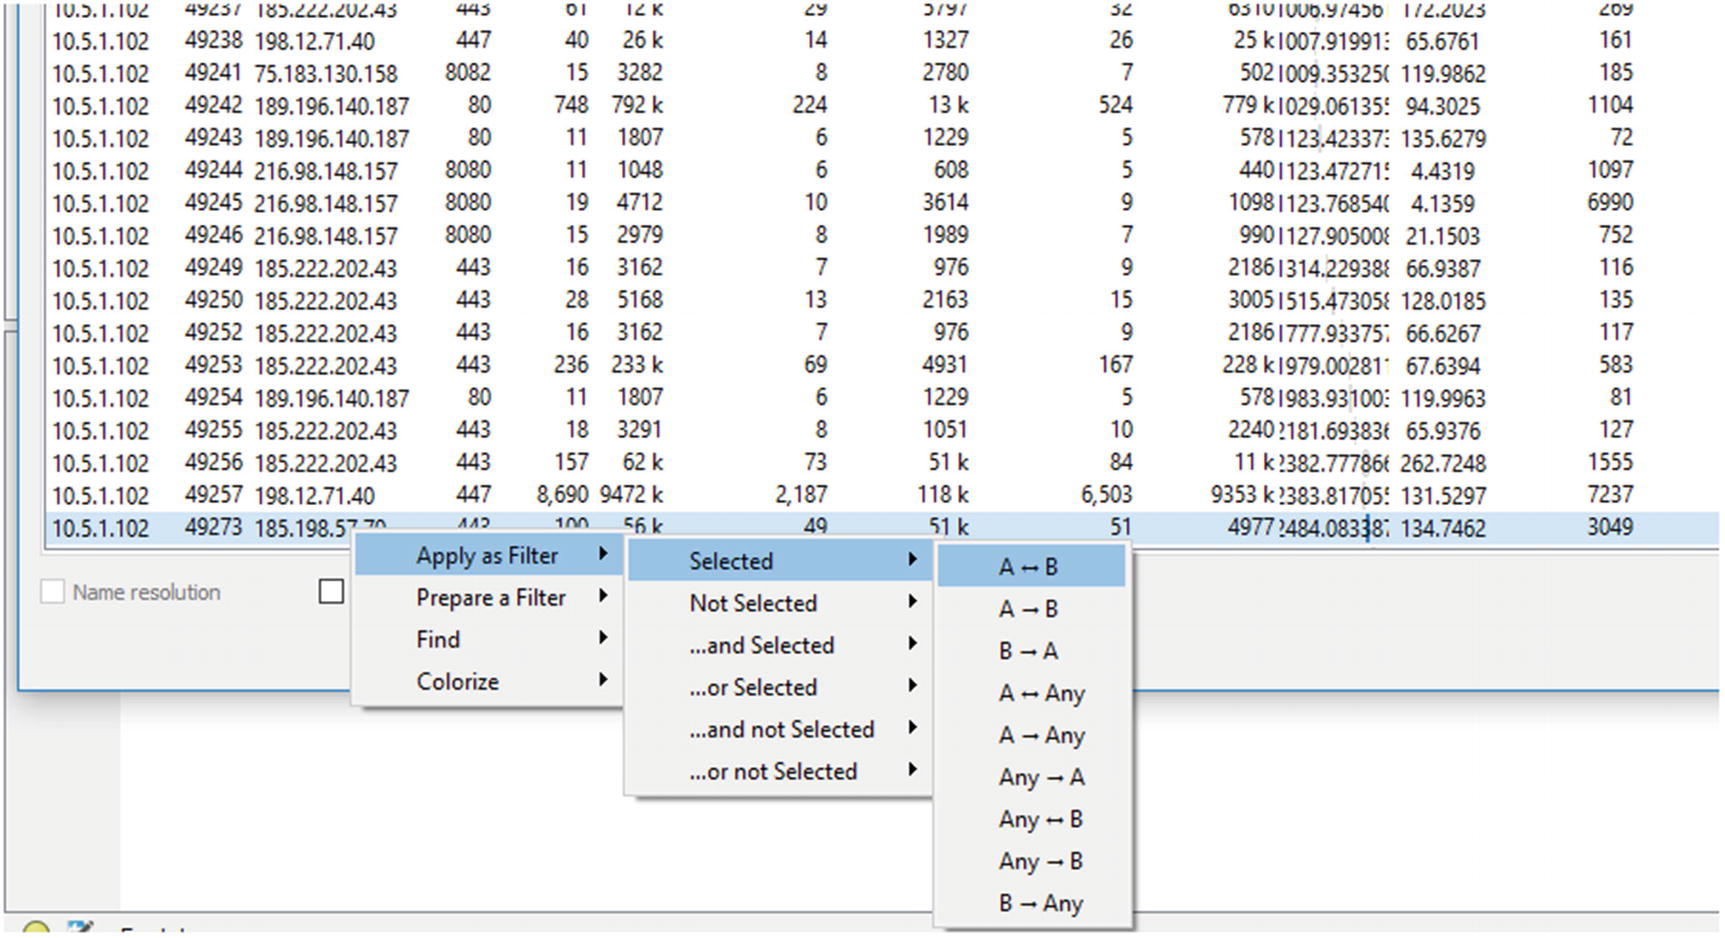
Once the conversation in question is found, it is possible to filter on this conversation only

The traffic is further filtered based on source IP address

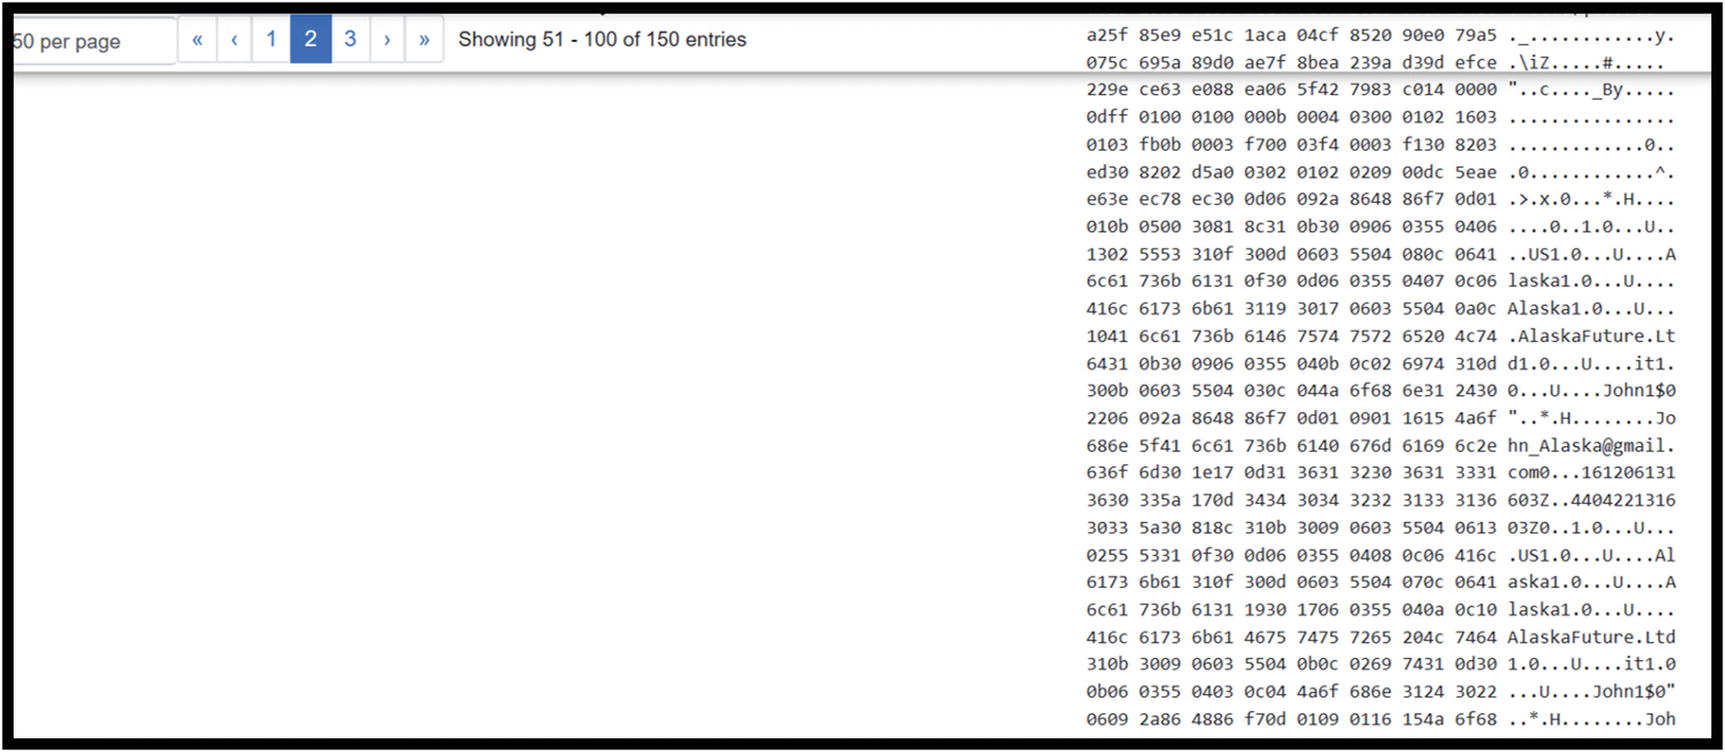
The payload details for the highlighted packet showing [email protected]
At this point, it seems there is an indicator of TrickBot activity on this endpoint.
Other IDS/IPS Solutions
Besides the Snort and Bro solutions we discussed for IDS and network traffic analysis, there are many other solutions available for healthcare entities building security operations centers. One open source solution not discussed in detail is Suricata. One of the differences between Suricata and Snort is that Suricata detects protocol usage based on what is in the traffic and not relying on ports identified in the traffic. For instance, seeing POST and GET requests causes Suricata to identify the traffic as HTTP, similar to what Zeek does.
McAfee Network Security Platform
Trend Micro Tipping Point
Hillstone NIPS
Darktrace Enterprise Immune System
NSFocus NGIPS
Selecting an IDS/IPS solution depends on a number of factors: cost, support, internal resources, and so on. Open source solutions provide the benefits of lower initial investment. Some provide strong community support or have entities that provide paid support. If the organization has resources with deep understanding of how the solution works, then opportunities exist for customization. Zeek is a great example. Someone with strong understanding and scripting skills with the Zeek language creates customized signatures. Commercial solutions must be evaluated based on fit within the organization.
Data Loss Protection
Data loss prevention (DLP) solutions have evolved over the past few years. Native DLP solutions monitor data egress and alert when sensitive data may be present. For healthcare organizations, personally identifiable information (PII) and diagnosis information exfiltration are cause for concern. Some vendors now offer endpoint security suites and malware detection, in addition to the DLP solution.
DLP solutions encompass several components. Those include network DLP (nDLP), endpoint DLP (eDLP), and egress monitoring. Network DLP deals with data flowing through the network. For entities using vLANS where ePHI is expected to only traverse specific parts of the network, nDLP alerts when this data is potentially found traveling in unexpected areas. Endpoint DLP, depending on the solution, can prevent the use of portable storage devices, printing, and uploading of data to sites like Dropbox, Google Docs, or other similar sites. Egress monitoring detects data leaving via email or uploads to off premise sites like Dropbox or other similar sites. Since not all implementations of DLP include all types, endpoint, network, and egress, it is important to understand what blind spots exist and how the implementation can be adjusted to cover these areas.
Email Security
Email is the source for many types of attacks. It allows adversaries to bypass perimeter security capabilities and get inside the network. Email gateways or proxies are a key piece of the security program. These solutions block many easily identifiable attempts to gain access, mainly mass attempts to get past the perimeter with low-quality attacks. We are talking about emails originating from known bad sources, spoofed email addresses easy to detect, and poorly worded emails. These come from attackers’ attempts to throw everything against the wall and hope something sticks. What types of attempts are made by threats, who are the biggest targets, and are the blocked attempts consistent or trending upward? All good things to know. Another key prevention and detection technique includes preventing outbound connections when a user clicks a malicious link or attachment. When a phishing attempt is successful, normally once the user kicks off the attack by clicking the link or attachment, a DNS request or outbound connection to the command and control site occurs. Some email security solutions rewrite the URLs of links in the emails or block the attempted connection. This helps stop the attack process and alerts the SOC analyst(s) of the attempt. Logging done by email gateways is valuable during investigations. Confirmation of when an email entered the network and who the recipient(s) were helps define the scope of an attack. Having these logs readily available for searching is key.
There are many players in this space including FireEye, Trend Micro, Proofpoint, and Forcepoint as examples.
Web Proxy
Pornography
Gambling
Social Media
Entertainment
These sites are blocked for data protection purposes but also for operational reasons. Companies might feel if social media and entertainment sites are available to employees, it might interfere with production. Proxy logs are very helpful when things go wrong. Malicious insiders are very dangerous. People planning to leave or suspect he or she will be invited to leave want to take documents and resources that might be useful at the next opportunity. Investigations into loss of intellectual property are aided when investigators and SOC members can review Internet activity. What searches were conducted? What pages were visited? Was data uploaded and what data was downloaded? Being able to answer these questions helps understand the motivations of the insider.
Squid is an open source proxy that is very popular and scales well in large organizations. Symantec’s Blue Coat is a popular commercial solution. Other providers include Zscaler, Forcepoint, and McAfee.
Security Information and Event Management (SIEM)
The SIEM is a mystery. Is it a detective capability meant to identify attacks? Could it be a tool used for investigations, a response tool? It depends. Entities must plan on how the SIEM shall be implemented, what is the goal and objectives of using such a solution, and how will the entity go about identifying and collecting log sources. Some entities try to absorb everything at once, then whittle out what is not needed after evaluating what is being captured. Others take a wait and see approach, collecting logs once a use case is defined.
In their book, Security Information and Event Management (SIEM) Implementation,13 the authors outline log management, event correlation, active response, and endpoint security as some of the use cases for the SIEM. Here, the use cases cover elements of the Mandiant Kill Chain and indicators of attack in each. This process covers the same elements outlined in the book. To ensure notifications from the SIEM or any device is useful, the right logs must be collected efficiently with as much noise filtered as possible. The ability to correlate among different sources of data, especially endpoints, is necessary to quickly alert on events of interest.
Tactical Uses of the SIEM
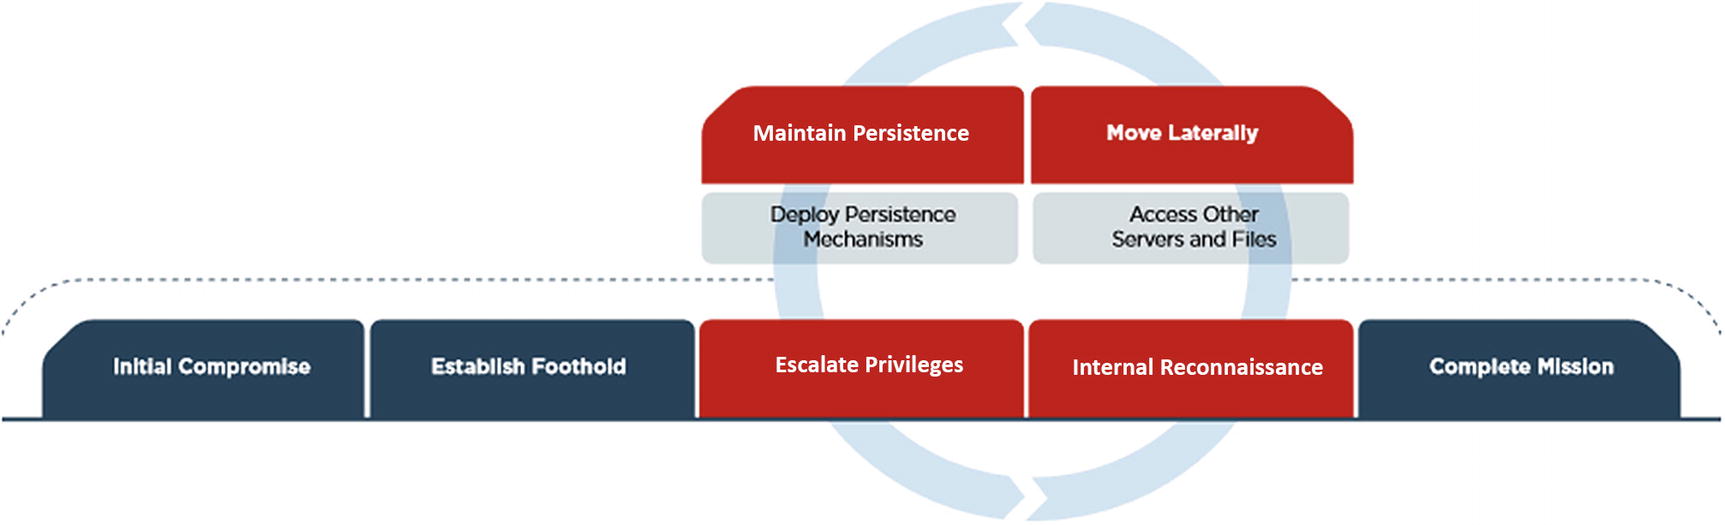
The Mandiant/FireEye Kill Chain
Kill Chain Use Cases
Baseline: Not part of the kill chain, but necessary to find anomalies
Initial Comprises and Foothold
Privilege Escalation
C2 Communications
Lateral Movement
Persistence
Data Exfiltration
Persistence
Baseline
A baseline dashboard exists to help the SOC know what is expected in the environment. This is done by capturing several types of information such as what application protocols are used inbound and outbound, what ports are used, connection lengths, and who are the top talkers internally and externally. It takes this type of understanding to efficiently identify anomalies.
Inbound Layer 7 Protocols
This answers the question, what protocols are used coming into the network and why? It is easy to capture this traffic via Zeek. Analyzing traffic via egress and ingress points develops a picture of Layer 7 protocols in use. A simple table showing the protocols used and counting the number of instances makes it easier to spot unusual traffic. Based on the infrastructure supporting the Zeek implementation, the table can show these occurrences over a week or month.
Outbound Layer 7 Protocols
Again, using Zeek or another traffic analysis/capture tool, it is possible to uncover what protocols are in use with egress traffic. Naturally, there are protocols analysts would not expect to see such as Remote Desktop Protocol (RDP) connecting to external endpoints. This type of view allows the SOC to quickly see unusual one-off protocol uses. Low occurrence protocols become interesting to investigate.
Top Outbound Talkers
Any solution capturing flow traffic can present this data to analysts. Again, Zeek is perfect for this job. Flow information found in the conn.log captures flow information. Analysts can pull this information directly from Zeek logs or by sending the log data to a SIEM and creating views there.
Connections over Ports 25 and 53
Outbound traffic using these two ports should only be seen coming from specific servers. Port 25 is the Simple Mail Transfer Protocol (SMTP) and should only have traffic coming from the mail server. Port 53 using either UDP or TCP is the Domain Name System (DNS) protocol used to map domain names to IP addresses. Internally specific servers run DNS services, and those servers are the only ones that reach out to authoritative servers. Any other endpoints connecting on these ports outbound require investigation.
Initial Compromise and Foothold
Monitoring for initial compromise attempts to detect indicators of compromise (IOCs) early in the kill chain. Many of these use cases are focused on laptops or desktops.
Command and Control (C2) Communications
The purpose of this dashboard is to identify evidence of command and control communication between an internal endpoint and an outside server/domain. This type of communication is often used by malware to check in with the command and control server. Malware sometimes sends updates or asks for further directions. HTTP and DNS are commonly used for during command and control.
Hosts per Domain
Some C2 sites use multiple subdomains, so tracking the number of hosts per domain creates detection opportunities when new domains are detected with unusually high numbers of hosts. There is no magic number for what is considered a high number of hosts; analysts are looking for anomalies. Again, new domains not seen before are of interest and so would domains with more hosts than others on the list.
Communication on Ports Used by Known Malware
The work done by MITRE ATT&CK in Chapter 3 documented specific ports used by the software Deep Panda historically employed. Infections by Emotet and Trickbot use specific ports for communication. It is possible to monitor outbound communications on those specific ports and investigate any uses. This type of alert is low-hanging fruit since ports used by malware is not high on the Pyramid of Pain. Changing the port used by malware is not a difficult coding change.
URL with High Entropy
When it comes to HTTP traffic, monitoring the Universal Resource Locator (URL) for high entropy/randomness. C2 domains can quickly change. Attackers sometimes employ random domain generators. There are tools available for the SOC conducting this analysis. Mark Baggett, SANS instructor and creator of the Automating Information Security with Python, created two tools to calculate the frequency scores of domains seen. One version calculates the scores when an analyst manually executes this tool against list of domains. The other creates an automated process.14 Each does the same thing; it’s a matter of whether the organization can take advantage of the automated process.
Monitoring this randomness regularly makes it easier to spot abnormally random domains. There are different ways to calculate entropy for this section depending on the solution implemented. We will discuss a few examples in the SOF-ELK and Splunk sections.
New Domain Connections
Using historical analysis, the SIEM can monitor for connections to domains never seen before. A list of domains visited is kept in a file, and when a domain name is seen on the wire, the lookup file is referenced to see if the domain exists. If not, then it is logged, or an alert is generated for the SOC analysts to investigate the new domain connection. Over time there should be fewer and fewer domains visited never seen before. Andrew Dauria wrote a blog post called “Finding NEW Evil: Detecting New Domains with Splunk” that outlines how Splunk users can monitor for this activity.15
User Agent String Analysis
Monitoring for user agent strings falls in the middle of the Pyramid of Pain, under the network-based indicators. Sometimes interesting indicators are found. Some attackers place information about the malware, version, and so on in the user agent string to keep track of what malware is reporting. Other times, configuration information about the infected endpoint is sent via the user agent string. Attackers also use user agent strings that are common and expected.
Another indicator to monitor for is user agent (UA) strings that do not belong on the network. For instance, if the SOC is monitoring a primarily Windows-based environment, it would be unusual to see UA strings associated with iPhone or Android devices. This might detect attackers connecting out with traffic where the UA string was set to a non-Windows string for a different intrusion and never changed when used in the Windows environment. It also detects malicious insider behavior. If Windows 10 does not have Bluetooth disabled, an end user can pair his or her phone with the laptop/desktop and move files between the two endpoints. Any use of HTTP by the device paired with a Windows machine creates an unusual UA string on that network segment.
Beacon Detection
Malware often connects with its host server. It receives instructions and sends data during the intrusion. Detecting beacons is as simple as monitoring for connections to known domains and IP addresses used for C2. It also involves detecting randomly generated domain names. Detecting on high-frequency connections to domains with many subdomains and domains considered highly random are other indicators of this type of communication.
NXDomain Returns
Sometimes attackers take down C2 servers when not in use. This can happen during maintenance periods or periods when malware is not active. Yes, these attack groups do plan for outages to conduct maintenance. Examples exist where the DNS records for the domains residing on those servers point 127.0.0.1, or no response is given resulting in an NXDomain answer to the DNS query. A spike in these occurrences might indicate an endpoint attempting to communicate with a C2 server.
Lateral Movement
Once inside a network, threats work through the network searching for the data/assets targeted. This means accessing other systems en route to the primary target. The use cases defined in the following sections may indicate this type of behavior.
Logins to Multiple Devices
There are specific groups where multiple logins across the network are expected. Then there are users where remote access to one or many endpoints is highly unusual. Or logons by accounts not recognized might indicate something unusual occurring. This monitoring should not focus only on user accounts but service accounts as well.
Login Attempt to Disabled Accounts
Most intruders use resources available in the network. Abusing disabled accounts is one way to use resources of an entity against itself. Attackers might be inclined to think this activity is not monitored and attempt to gain access to disabled accounts. Monitoring this activity often yields instances where certain services trigger failed logins when attempting to sync. Microsoft’s Active Directory Federated Services (ADFS) is common. Consistent monitoring allows the analyst to become familiar with what is expected and detect what is out of the ordinary.
Persistence
It is one thing for an attacker to successfully get malware into an environment. But once in malware needs to keep its presence in the environment. This is done by creating new processes and services and making changes to registry settings to maintain persistence. This allows the malware to survive reboots of the victim systems.
New Process Creation with Entropy
To run malware must create new processes. Sometimes these processes closely resemble processes already running with very subtle differences. Viewing a list of processes running on an endpoint, svchost is a common occurrence. Svchost allows multiple services to share a process to save on computing resources. Malware may create a new process called svch0st, changing the o to a zero. It would not be hard to overlook such an occurrence. Attackers not as concerned with stealth might create new processes with randomly generated process names. Detecting new process creation and measuring the level of randomness is another opportunity to detect malicious activity.
New Services Created
Windows Event ID 7045 means a new service was created. Monitoring these for execution in unusual directories, like the temp directory or highly random names, may indicate the process helps malware persist.
Registry Key Changes
Registry key changes are used to maintain a foothold for malware. In Chapter 3, we saw how Sakula, a malware variant used by Deep Panda, makes changes to registry settings to survive reboot. Specifically, autorun registries are where Sakula makes changes. With the right endpoint monitoring, these changes might be detectable. There are some forms of malware that install themselves in the AutoStart registry and operate without installing files making detection more difficult.
New Scheduled Tasks
As stated before, malware needs to run, and hiding it within scheduled tasks is one way attackers do this. By monitoring these new tasks, analysts can see if new tasks are created that are randomly generated. Attackers will at times use randomly generated names for tasks, and if these fall outside the norms based on random scores than baselines in the network, then investigation into the new processes is warranted.
Data Exfiltration
It is ideal to detect malicious behavior before data exfiltration begins, but it is better to catch data exfiltration than completely miss it. Some ways to find data exfiltration is by monitoring increases in TXT query types for DNS, unusually high numbers of POST methods over HTTP(S) or large data transfers via HTTP(S) POST methods.
DNS Queries by Type
Earlier in the chapter, the types of DNS requests were discussed. The SOC team should track numbers of requests by type over time looking for spikes in TXT and NULL requests. These types of requests are used to place plaintext and encoded data in available fields for exfiltration.
Review for Connections with More POST Than GET Bytes
This is another indicator of possible data exfiltration. During normal operations, an HTTP connection expects to transfer more data via GET requests than POST requests. This behavior is unusual and needs to be investigated.
POST Requests over Five Minutes
This is another event/alert that works best with mature baselines of network activity. Elevated POST methods over five minutes affords the SOC team another opportunity to detect data exfiltration or at the very least C2 connections.
Open Source vs. Commercial (Paid) Solutions
There are many pros and cons to using open source solutions vs. paid solutions. Paid solutions usually have a higher upfront cost but come with professional services and support. Customization limits may create feature gaps. Open source solutions may not have support or services to assist with implementation, but access to source code and knowledgeable resource create opportunities for customization and adding features to the solution. Elastic16 offers an open source SIEM solution built with three open source offerings: Elasticsearch, Logstash, and Kibana. Splunk is one example of a commercial solution.
ELK and SOF ELK
Components of ELK stack
Component | Capability |
|---|---|
Beats Shippers | Agents for moving logs to either Logstash or Elasticsearch |
Logstash | Log aggregator |
Elasticsearch | Search and analytics engine |
Kibana | Web interface |
Kafka | Log aggregation broker |
Logstash delivers log parsing and enrichment. These steps are performed before the logs are passed on to Elasticsearch where each is stored and maintained for analysis. Kibana is a web front end allowing users to create indexes, manipulate data, and conduct analysis.
ELK is popular not only because it is open source, but the solution can scale in entities of all sizes from single instances in small- to medium-sized networks to large-scale enterprises with locations spread across the globe. A lot can be done with ELK, but it must be configured from scratch. It does nothing out of the box and can be laborious to maintain long term.
SOF-ELK is a distribution of the ELK stack configured for Security Operations and Forensics (SOF). It too is free and open source. It is available on GitHub at https://github.com/philhagen/sof-elk. This solution was developed by Lewes Technology Consulting, LLC and is used by SANS in several classes including FOR572, Advanced Network Forensics and Analysis.
Elasticsearch
Elasticsearch indexes, facilitates queries, and stores logs long term. Elasticsearch scales in large Fortune 100 companies and small- to medium-sized companies.
Logstash
This gives security and operations teams the ability to process and enrich logs prior to transfer to Elasticsearch. Logstash comes with configuration file allowing the security operations team to parse logs and enrich logs prior to transfer to Elasticsearch. Common parsing includes IP addresses, usernames, and other fields/values that are important for security operations team. The operations team can add GeoIP or ASN information to IP addresses to help filter out events not of interest. Hash values can be added to files captured.
Logs in formats such as JSON, XML, or CSV allow Logstash to parse the data into fields and values with minimal processing or effort.
Logstash and log aggregators in general act as the point where logs are pulled together into a central location. This allows for logs to be parsed, meaning data that is relevant or interesting to the security operations team is pulled from the logs, so it is easily visible. Depending on the size of the network, the architecture must be designed to handle the logs generated. A medium-sized network can generate a lot of logs.
Logstash comes with many plugins to make ingesting, parsing, and enrichment easier. We will not cover these in depth, but here is a list of those you may want to consider if using ELK for your data visualization/SIEM capability. A full list is located at www.elastic.co/products/logstash. Essentially when logs are ingested by Logstash, they are processed through any configured plugins prior to forwarding.
Kibana
Kibana provides a web front end for analysts to view and analyze data from logs. Kibana offers a robust list of visualizations for SOC analysts. Besides basic line, bar, pie, and histograms, Kibana can perform time series analysis.
Log Shippers
Several types of log shippers work with ELK, known collectively as Beats. Agents on each endpoint monitor for new logs to transfer either to Elasticsearch or Logstash. These agents can normalize their logs prior to shipping. Filebeat sends raw files, and Winlogbeat sends Windows event logs. Packetbeat extracts network protocol data and forwards the data to either Logstash or Elasticsearch. Metricbeat sends system status logs.
Log Ingestion Examples
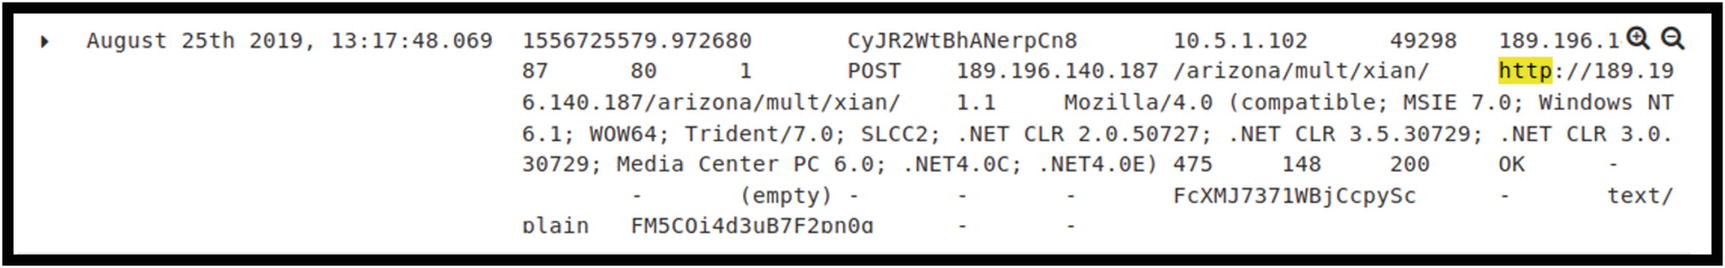
Example of log generated via ingestion of Zeek HTTP logs
This log entry was filtered by HTTP. This is an example of a POST request from an internal address 10.5.1.102 to 189.196.140.87/arizona/multi/xlan. The string of characters starting on line 3 with Mozilla/4.0 and ending on line 5 with .NET4.0E) is the user agent string. We discussed earlier how these strings are used and can detect malicious behavior.

Example of log generated via ingestion of Zeek DNS logs
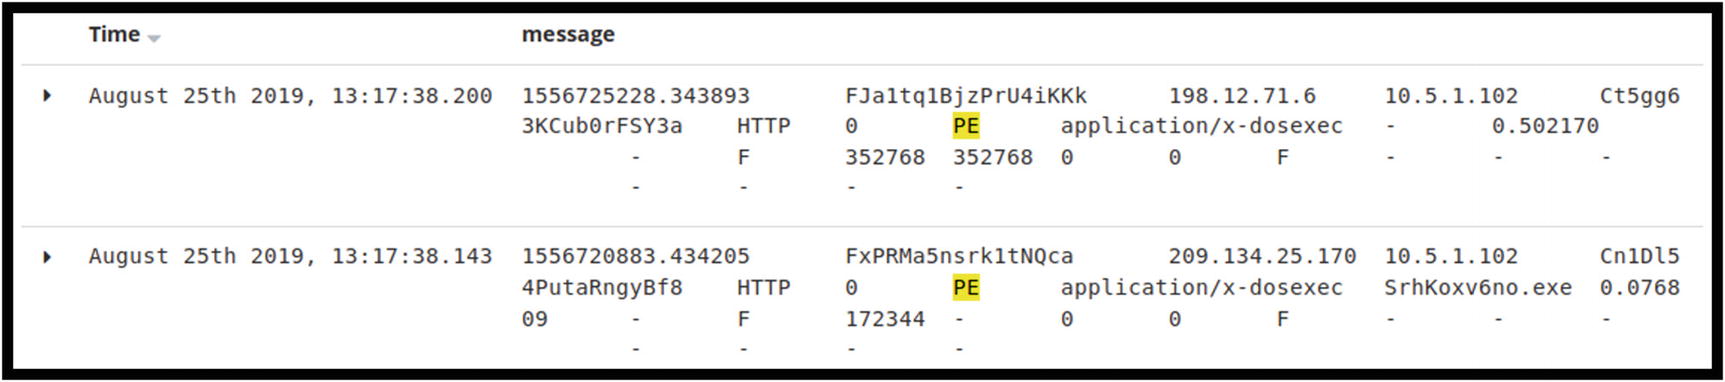
ELK logs showing two instances of executable files seen by Zeek

Snort alert in ELK. Note the lack of details in the alert

View of the Win.Trojan.Trickbot rule in Snort. No specific IP addresses are documented in the rule

The alert inside Snort shows more detail
RHOST: 192.168.237.139 – Victim machine
RPORT: 445 – Common with SMB protocol
SMDPass: password
SMBUser: ectcyberhipaa
LHOST: 192.168.237.133
LPORT: 4444 – Common Meterpreter port

Metasploit SMB attack executed against the Windows 10 machine
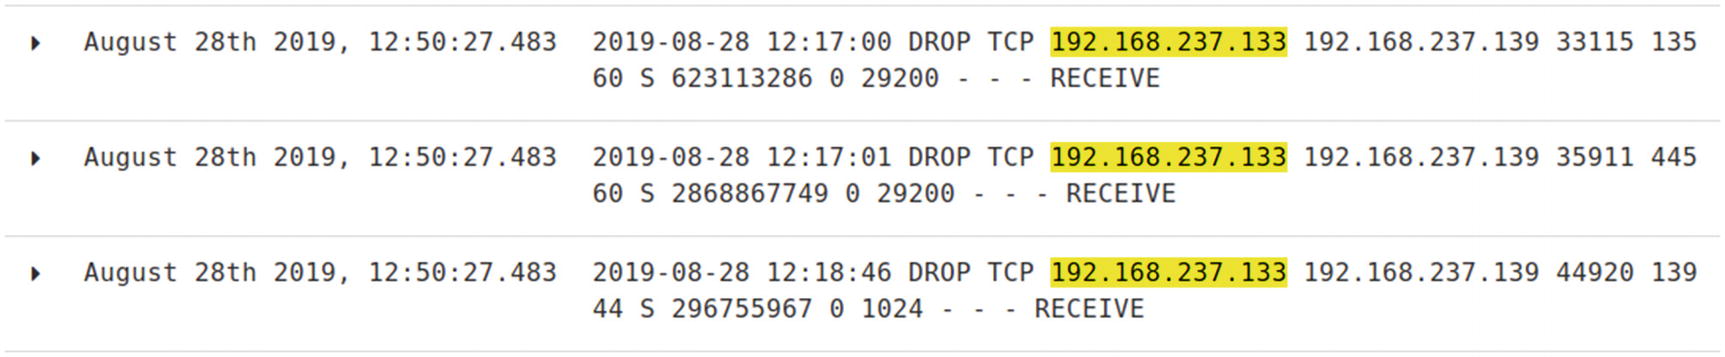
Windows 10 firewall logs
Right after the timestamp on the first line of the logs is the indication the packets were dropped. Not all Windows events need to be ingested in the SIEM solution. Configuring the environment to forward events of interest adds value to the monitoring program.
AlienVault offers an open source SIEM solution called OSSIM.
Splunk
Splunk is a commercial tool that has found a strong niche in the security marketplace. It offers many ways for SOCs to monitor the use cases documented earlier in this chapter. One of the experts at Splunk, Derek King, wrote two blogs focused on several kill chain use cases. The first, “Hunting Your DNS Dragons,”17 documents ways to use Splunk to detect C2 communications and data exfiltration using Splunk. The second, “Spotting the Signs of Lateral Movement,” focuses on detecting lateral movement.18
Command and Control Traffic
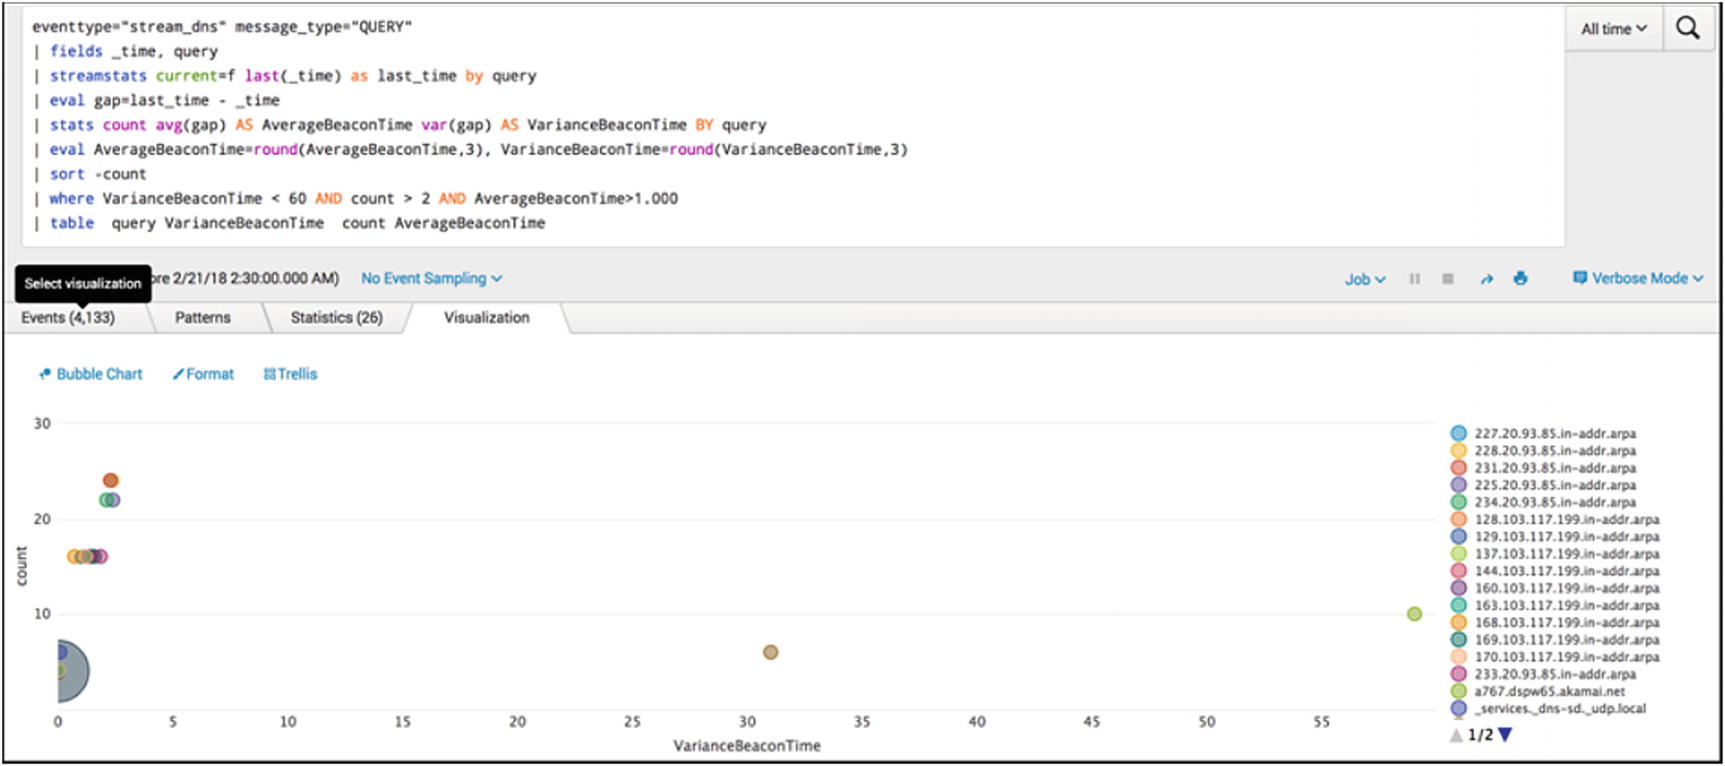
Top ten talkers on the network
The analyst can view the chart looking for unusually high connections. The bottom left corner shows endpoints beaconing with very little variance in beacon times. The vertical axis counts the number of hosts beaconing within the variance time. The farther the bubbles appear on the right of the graph, the more variance there is between beacons by the potentially infected host. The SOC analysts can review the endpoints from left to right eliminating false positives until the review is completed.
Lateral Movement
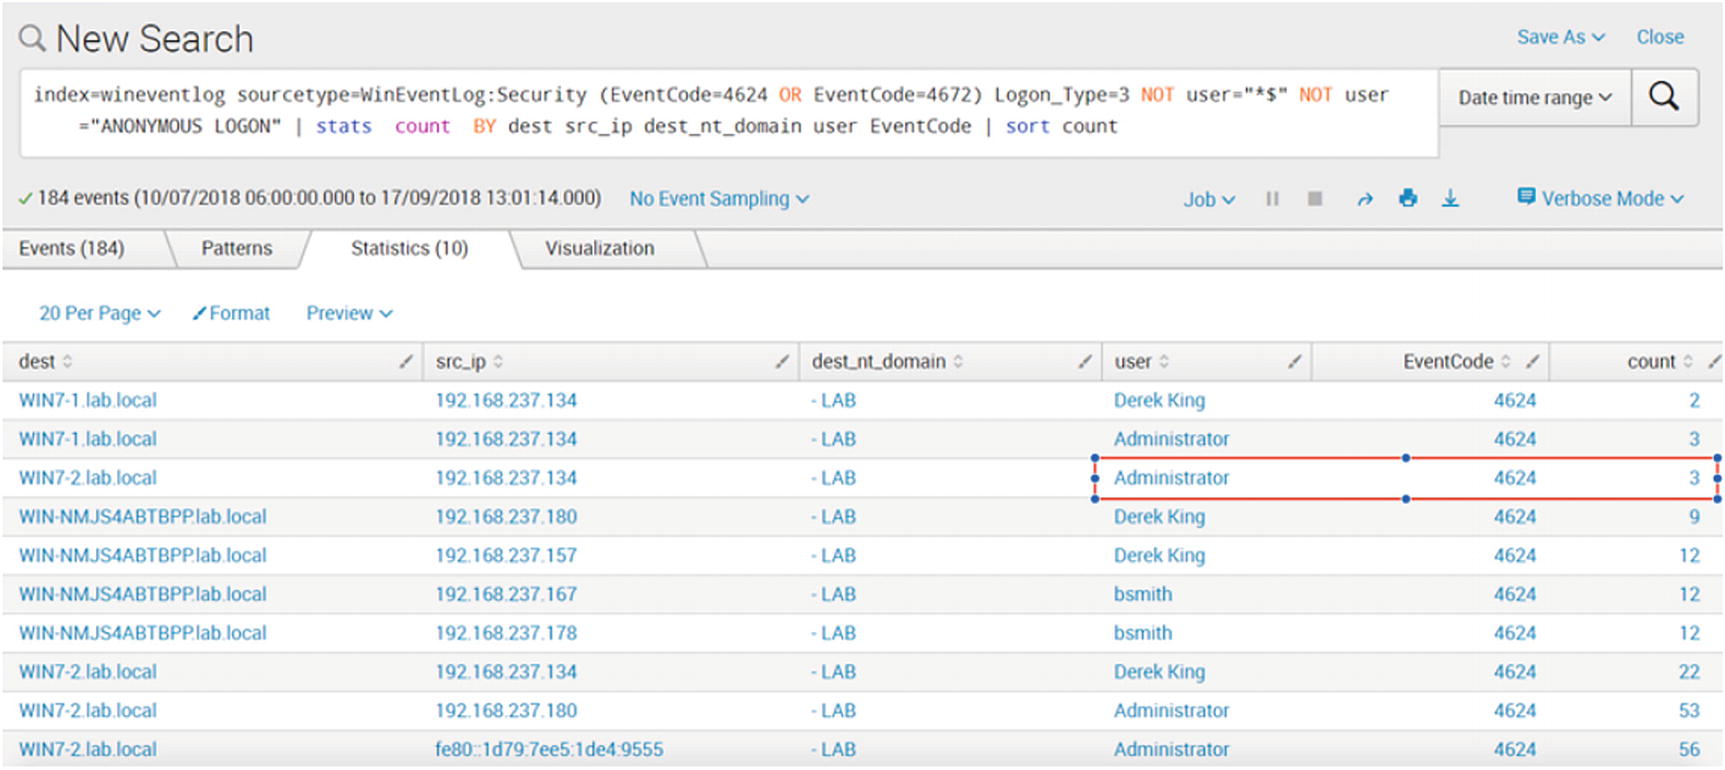
Table created to show successful logins by type
The single logon by an Administrator account from the same source as Derek King might be worth looking into by the SOC team.
Data Exfiltration

Dashboard monitoring for increases in DNS TXT activity
This is just a sample of the dashboard possible with Splunk. Many commercial solutions exist for SIEM solutions. AlienVault, IBM, LogRythm, and SolarWinds offer SIEM solutions. These concepts outlined here are not specific to just the solutions described. Once understood, the ability to create specific dashboards and alerts is universal.
Full Packet Capture
Full packet capture is valuable source of data when investigating alerts, events, and incidents. It is not always necessary to have full packets, but doing so does shed light on otherwise missing details when wanting to understand what communications were present before, during, and after an event of interest. The main obstacle when implementing packet capture solutions, besides cost of hardware and software and professional services, is storage. The longer the retention period and the larger the amount of traffic generated daily, the higher the cost of storing packets long term. There are organizations that consider themselves lucky if packets can be retained for 30 days.
One open source solution available to fill this need is Moloch.19 The latest version of Moloch, version 2.0, is available on the site with specific packages available for CentOS and Ubuntu.
The components of Moloch include the packet capture function, the viewer that provides the web-based GUI, and Elasticsearch. Just like in the ELK-based SIEM discussed earlier, Elasticsearch is used to store, index, and search for packets.
Moloch is architected with live traffic captured via a network tap connecting to a mirror port on a core network switch or ingress/egress router. This is a very similar set-up to the IDS architecture outlined earlier in the chapter. The Moloch capture sends the traffic to Elasticsearch and the Elasticsearch database. The Viewer provides the interface for user to query and view packet data.

The Sessions page in Moloch
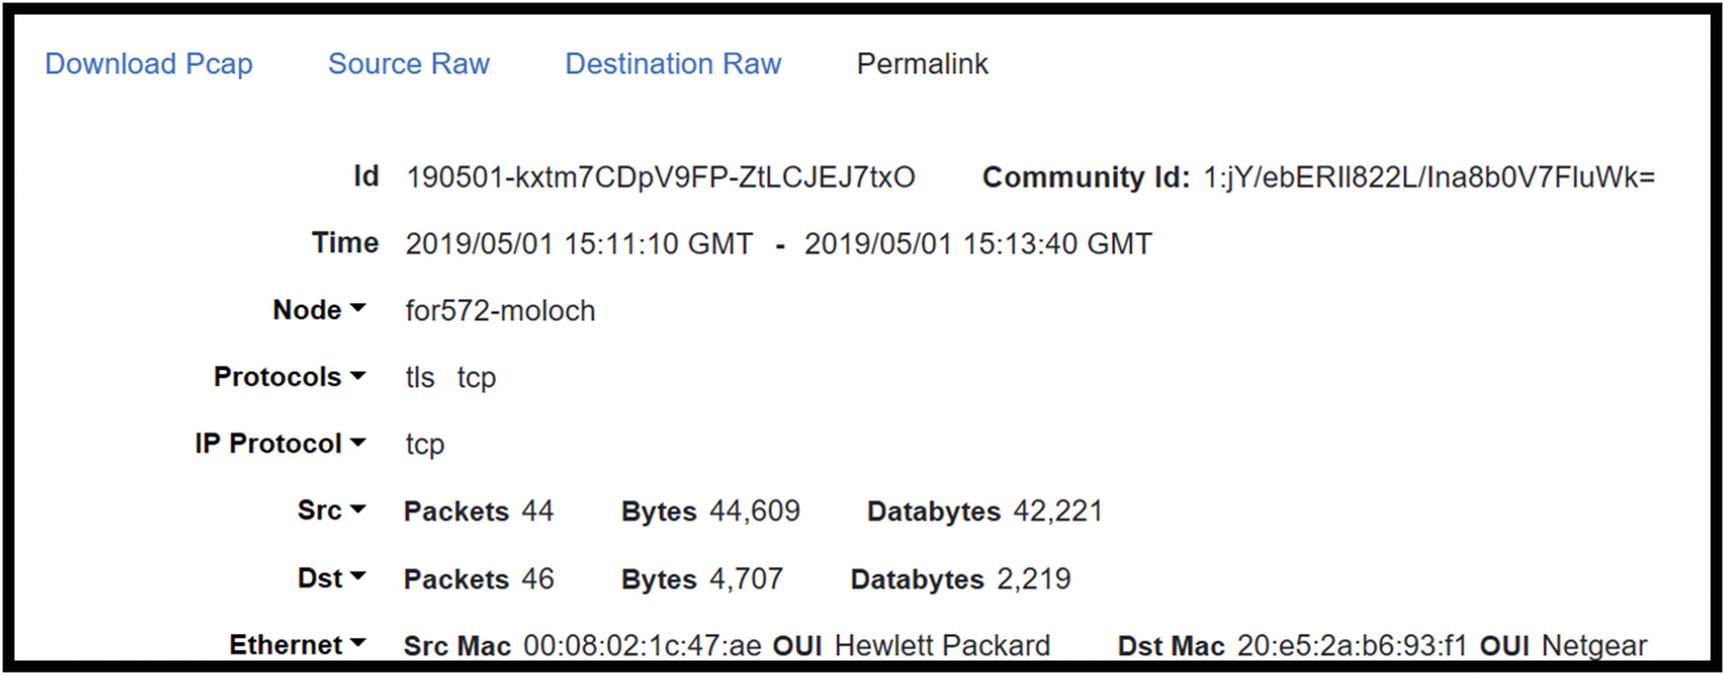
Top of the session details in the Moloch Sessions screen: Id, time, protocols, and source/destination statistics

This figure focuses on the Data Link layer and Internet protocol layer information
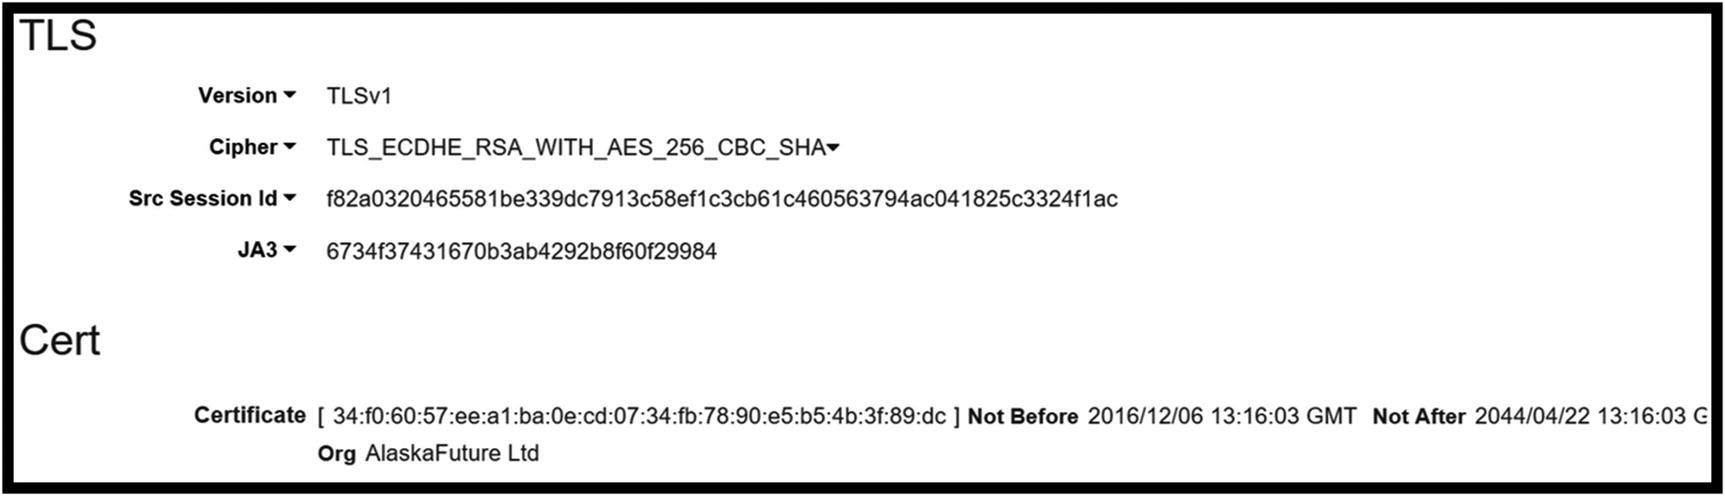
TLS data for the session including JA3 hash
The GitHub site where the JA3 project is housed lists the TrickBot JA3 has as 6734f37431670b3ab4292b8f60f29984. This hash value matches the value Moloch pulled from the capture. It is possible to implement Moloch and use it to detect matches with other JA3 hashes calculated for known attacks.
Payload details showing the pattern content match of [email protected]

Example of a connection map in Moloch
Full packet capture is great. Nothing beats having packets available when investigating anything out of the ordinary. The issue with packet capture is the cost of long-term storage. Capturing everything and keeping it for a year, or six months for that matter, costs hundreds of thousands in capital investments. Entities are lucky to have three months of packets retained. Some of this cost is alleviated by filtering what is captured. Packets transferred across the network for backups may not be necessary to store long term. Traffic based on updates from Microsoft or other providers are good candidates for filtering. These approaches must be thought about during the planning stages.
Conclusion
Windows endpoints possess event logging/forwarding capabilities and host-based firewalls key to detecting unwanted behavior. Sysmon and other tools located in the Sysinternals Suite enhance monitoring and detection capabilities on Windows desktops and laptops running the latest versions of the Windows OS. Zeek is a powerful network analyzer that organizations should consider for augmenting monitoring tools already in place. Its ability to parse network data enhances visibility; it is useful to view all events occurring during a single network event. An analyst can correlate the downloading of an executable file during an HTTP session and subsequent DNS requests and outbound connections.
Intrusion detection systems detect the presence of malicious or unwanted traffic passing into and out of the network or across the network between segments. These devices generate alerts the SOC team must investigate. Full packet capture adds detail to investigative pictures, but this comes at a cost. Packet storage is expensive, and the cost goes up based on amount of data captured and length of retention. Since the average time to detect an intrusion is close to 90 days, it would be great to keep packet captures that long. The key to lengthening the retention period is filtering what is captured and retained. Benign traffic to and from whitelisted sites may not be necessary. Neither are DNS requests for the most commonly visited sites. Any filtering helps increase retention periods and reduce costs.
The SIEM is at the center of continuous monitoring. Having one place where alerts and events of interest are viewed increases efficiency. When planned properly, a SIEM is a tactical tool where most of the SOC’s efforts are focused. A final note about continuous monitoring is this. Just like security in general, continuous monitoring improvement and maturity does not have an end. It is constant. It’s an iterative process where each time through the capabilities gets better.