
Thermoplastic composites for bridge structures
Abstract: The primary objective of this chapter is first to introduce and demonstrate the application of thermoplastic (woven glass reinforced polypropylene) in the design of modular fiber-reinforced bridge decks, and next the development of jackets for confining concrete columns against compression and impact loading. The design concept and manufacturing processes of the thermoplastic bridge deck composite structural system are presented by recognizing the structural demands required to support highway traffic. Then the results of the small-scale static cylinder tests and the impact tests of concrete columns are presented, demonstrating that thermoplastic reinforcement jackets act to restrain the lateral expansion of the concrete that accompanies the onset of crushing, maintaining the integrity of the core concrete, and enabling much higher compression strains (compared to CFRP composite wraps) to be sustained by the compression zone before failure occurs.
13.1 Introduction
In the last few years, the presence of composite materials in the construction industry has become more common. Today, fiber-reinforced composite materials are used in a wide array of civil infrastructure applications [1]. Most of these applications utilize prepreg thermosetting composites, the most common of which is carbon fiber-reinforced polymer (CFRP). Thermoplastic composites are relatively new materials in civil engineering applications and lack the history of use in civil infrastructure. Limited time has been spent investigating the usage of thermoplastic materials. These materials offer comparable material characteristics to thermosetting composites. The ability to readily form these materials using epoxy makes them much more desirable. Thermoplastic polymers have several advantages over ther-mosets: they can be reshaped by reheating, are recyclable, are cost-effective and possess superior impact properties. They have comparable mechanical properties, higher notched impact strength, reduced creep tendency, and very good stability at elevated temperatures in humid conditions [2]. Long fiber reinforcement thermoplastics have significantly higher heat deflection temperature and better heat aging properties than the corresponding short fiber-reinforced matrix materials. Because of their good heat aging properties, thermoplastic composites like glass reinforced polypropylene components are suitable for continuous service temperatures up to 266 °F (130 °C) [2]. Fatigue strength is critical for designing girder components that are subjected to fluctuating stress. No significant loss of rigidity was recorded on a prototype glass reinforced thermoplastic composite slab during two million cycles of load at 2 × 24.8 kips (110.25 kN). The mode of failure is punching in the loading area and this mode of failure does not represent a catastrophic failure [3].
Thermoplastic composites typically comprise a commodity matrix such as polypropylene (PP), polyethylene (PE) or polyamide (PA) reinforced with glass, carbon, or aramid fibers. Progress in low-cost thermoplastic materials and fabrication technologies offer new solutions for very lightweight, cost-efficient composite structures with enhanced damage resistance and sustainable designs [3]. The primary objective of this chapter is to introduce and demonstrate the application of thermoplastic (woven glass reinforced polypropylene) first, in the design of modular fiber reinforced bridge decks, and next on the development of jackets for confining concrete columns against compression and impact loading.
13.2 Manufacturing process for thermoplastic composites
The process used to make long fiber thermoplastic products was generally very expensive. Thus, the market for long fiber thermoplastic composites was very limited due to the high cost of producing these products. Recently, a novel hot-melt impregnation technology has been developed that allows complete impregnation of long fibers with thermoplastic polymers at very high production rates, producing high-quality, low-cost thermoplastic composites. This technology, called DRIFT (Direct ReInforcement Fabrication Technology) [3], yields products that can be made as continuous rods, tapes and pultruded shapes, or they can be chopped into pellets of any length for injection or compression molding [2]. The process has been shown to work well with glass, carbon, aramid, and other polymer fibers and also with a wide variety of thermoplastic polymers.
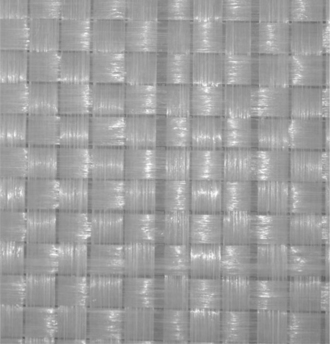
E-glass/PP tapes of 0.5" (12 mm) width and an average layer thickness of 0.024" (0.6 mm) were produced using the DRIFT process [4]. The unidirectional E-glass/PP tape material with a fiber content of 67 wt% (42 vol%) has the tensile strength of 87.6 ksi (604 MPa), tensile modulus of 4,300 ksi (29,648 MPa) and density of 99 lb/ft3 (15.5 kN/m3) [4]. The hot-melt impregnated E-glass/PP tape can be woven into broad goods with various weaving patterns appropriate to the application. The unidirectional E-glass/PP tape material can be woven into a plain weave architecture fabric form (Fig. 13.1) through textile weaving operation.
Thermoforming is being used to produce large sized plastic components with varying wall thickness (greater than 0.04" (1 mm)), formed under low molding pressures (less than 50 psi (0.345 MPa)), with molds made of aluminum alloy, wood, or polymer composites. A simplistic overview of the single sheet thermoforming process consists of heating a plastic (or composite) sheet and forming the sheet over a male mold or into a female one. The operation deforms the sheets of the material into curvilinear shapes with the help of tools or molds. The process uses various configurations such as vacuum forming, drape forming, matched mold forming, etc. Basic vacuum forming represents the conventional technology; a vacuum is created between a female mold and a heated plastic sheet, which is forced to comply with the mold walls. The components can be produced with increasing thickness from the center to the edges. The process involves heating of polymer sheet that is firmly constrained along its perimeter above its transition temperature or the melt temperature, forming in a mold through vacuum and cooling by conduction in the case of thin films or through fans in the case of thick walls [4].
13.3 Bridge deck designs
An integral modular fiber thermoplastic composite bridge structural system is described. To demonstrate the design concept, two bridge deck systems with different spans are modeled. The design concept of both decks presents a unique approach for a structurally efficient and low-cost bridge deck system. A modular fiber-reinforced thermoplastic panel with hat-sine rib stiffened shape is used as a bridge deck system. It consists of two/three components, i.e. top flat face, hat-sine rib, and/or bottom flat face. The other parameters are the interface contact length between shells of flat face and sine rib, wavelength of sine rib, depth of deck, and thickness of each deck component. All these parameters can be determined by considering the deck stiffness criteria set by the AASHTO code.
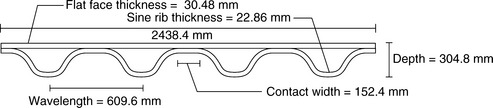
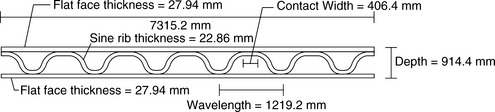
The deck shape based on the hat-sine rib stiffened design concept is selected by considering various issues such as the processability of the E-glass/PP woven tape, and the practical issues such as tooling, and design flexibility for the prototype studies. The glass/PP woven tape is relatively stiff, unlike the typical thermoset pre-pregs (such as glass/epoxy or carbon/ epoxy); the material cannot be molded into tight radii/corners. The hat-stiffened rib design is shown to be structurally efficient in several studies [5–7]. A deck system as shown in Fig. 13.2 features E-glass/PP woven tape hat-sine shape ribbed profile bonded to a flat E-glass/ PP woven face. A three-step concept was pursued for manufacturing the glass/PP thermoplastic composite floor segment type: (a) manufacture the flat face, (b) manufacture the hat-sine rib, and (c) adhesively bond the face to the hat-sine rib. The face and the rib portions of the deck floor can be processed through a number of choices, which include thermoforming, double belt press consolidation of the tape forms, reaction injection molding, and/or extrusion. The contact area of the ribs to the face could be bonded adhesively and/or by a combination of adhesive bonding and fasteners [4].
13.3.1 Design criteria
The design criteria are set by following the loading conditions and performance limitations described in the AASHTO LRFD Bridge Design Specifications [8]. The dead load and the vehicular live load must be applied in different combinations to obtain the maximum effect. The dead load, DC, includes the weight of the structural system, wearing surface, and all attachments. The loads are taken as 15 psf (0.72 kPa) (self-weight of the deck) and 5 psf (0.24 kPa) (polymeric wearing surface) [9] applied as a uniformly distributed load over the surface of the bridge. The three specified types of vehicular loading, LL, are:
1. Design truck load: three axles with loads 32 kips (142 kN), 32 kips (142 kN) and 8 kips (35.6 kN). The spacing between the 32 kips (142 kN) axles varies from 14 ft (4.26 m) to 30 ft (9.14 m), and is chosen by the designer to produce the maximum effect for shear, moment, and deflection.
2. Design tandem: a pair of 25 kips (111 kN) axles spaced 4 ft (1.22 m) apart with transverse spacing of 6 ft (1.83 m).
3. Design lane load: a uniformly distributed load of 640 psf (30.64 kPa) applied over a 10 ft (3 m) wide strip.
The AASHTO category strength I load combination is used to compute the ultimate capacity of the bridge, i.e.
The live load should include either a design truck load combined with a lane load, or a tandem design load combined with a lane load for every lane in the bridge. The AASHTO service I loading combination is used for checking the deflection of the bridge design, i.e.
For maximum deflection, the truck or tandem is placed such that the center of gravity of the truck or tandem is on the center of the bridge, i.e. AASHTO arrangement I. The shear stresses are checked by using arrangement II (with the rear axle of the truck or tandem at one end of the bridge) of the truck or tandem load.
The AASHTO specifications 3.6.1.3.2 and 2.5.2.6.2 are used to adopt the deflection limit of L/800 (where L is the span of the bridge). The deflection resulting from the design truck/tandem alone or that resulting from 25% of the design truck/tandem taken together with the design lane load should not be greater than the maximum allowed limit.
The maximum work theory of Tsai-Hill is used to determine the failure of the structure which can be defined by the following equation:
where σx, σy, and τxy are longitudinal, transverse, and shear stresses due to applied load, and σx(ult), σy(ult), and σxy(ult) are the ultimate stresses in the longitudinal, transverse, and shear directions. These ultimate strength values in checking ply failure using the Tsai-Hill approach are adopted from the literature using experimental results whenever possible.
13.3.2 Analysis and design procedure
E-glass/PP is used in the design of the bridge structure. The ply properties, i.e. E(fiber), E(matrix), G(fiber), G(matrix) are based on experimental results mentioned in Vaidya et al. [4]. The elastic properties of the laminate for a specific volume fraction of fibers are analytically evaluated using laminate theory; these elastic constants used for analysis are Young's modulus in the longitudinal and lateral/transverse directions (Ex, EY, Ez), Poisson's ratio in each direction (vxy, vxz, vyz), and shear modulus (GXY, Gxz, Gyz). Table 13.1 lists the elastic properties for the composite laminate.
Table 13.1
Material properties of E-glass/PP woven tape composite
| Property | E-glass/PP woven tape composite 40% fiber content by volume |
| EX | 1,437 ksi (9,900 MPa) |
| EY | 1,437 ksi (9,900 MPa) |
| EZ | 149 ksi (1,027 MPa) |
| VXY | 0.11 |
| Vyz | 0.22 |
| VXZ | 0.22 |
| GXY | 184.16 ksi (1,270 MPa) |
| gYZ | 108.75 ksi (750 MPa) |
| GXZ | 108.75 ksi (750 MPa) |
| EFIBER | 10,150 ksi (69,982 MPa) |
| EMATRIX | 149 ksi (1,027 MPa) |
| gFIBER | 4,350 ksi (29,992 MPa) |
| GMATRIX | 108.75 ksi (750 MPa) |
The finite element analysis to model the bridge deck is carried out on Ansys 8.0 software, the composite face and the hat-sine ribs are modeled using the Shell 99 elements. The Shell 99 element used has six degrees of freedom at each node constituting the x, y, and z direction nodal translations and rotations. Each element is defined by eight nodes (the mid-plane and the corner nodes), average or corner layer thickness, orthotropic material properties, and ply orientations [10]. The contact region between the face panel and the hat-sine stiffened ribs is developed by merging the common nodes and key points. The hat-sine ribs were subjected to parametric studies, which included the amplitude of the hat-sine, the wavelength, and the contact width between the face panel and the ribs. Based on the combination of least deflection and corresponding stresses, the right combination of the sine amplitude with the other deck components (i.e., wavelength and contact width) is determined and is described in detail elsewhere [4]. Following the selection of the right combination of parameters, further analysis on the bridge deck was conducted as summarized in the following sections.
13.4 Design case studies
13.4.1 Single-lane bridge deck system
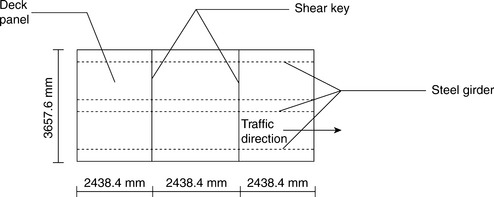
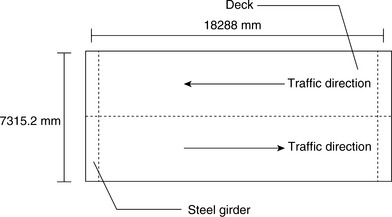
A typical single-lane bridge deck is modeled having width of 12 ft (3.65 m) and total length of 24 ft (7.30 m). The deck is supported on three steel girders having a span of 6 ft (1.83 m) and is divided into three panels, each having 8 ft (2.44 m) length and 12 ft (3.65 m) width with hat-sine rib direction perpendicular to the direction of traffic (Fig. 13.2). Typically, connection between deck and girder consists of shear studs cast into the cell of an FRP sandwich deck. Steel spirals are then positioned around each shear stud to aid in grout confinement.
Section with top flat face and hat-sine rib
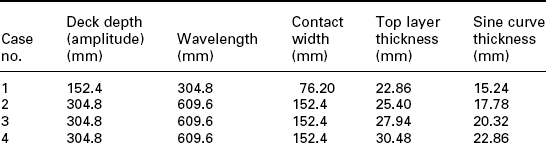
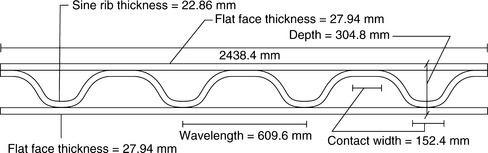
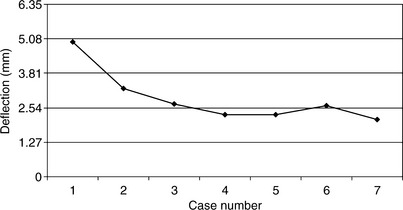
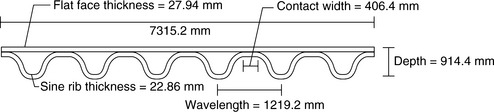
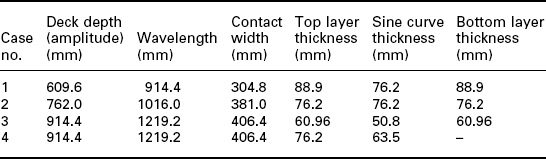
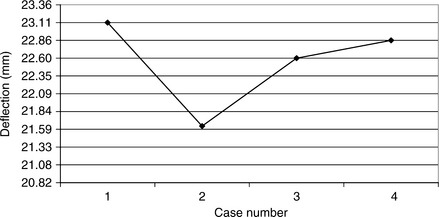
In this case, we used a hat-sine shape ribbed profile bonded to a flat face (Figs 13.3 and 13.4), and each component was made of glass/PP woven tape ply which can be modeled as a 0/90° layer. Using the material properties as in Table 13.1 with the loads mentioned, the bridge decks are subjected to optimization studies. Several deck model case simulations were carried out on ANSYS with appropriate amplitude, wavelength, and contact width as shown in Table 13.2(a). The simply supported boundary condition was chosen since the design was stiffness-based (deflection limited). It should be noted that the optimization of hat-sine rib is controlled by stiffness criteria satisfying the deflection criteria of AASHTO for bridge decks. The optimized section was checked for the Tsai-Hill failure limit and critical buckling load analyses were performed to obtain the thickness for the sine ribs [8]. Based on the combination of the least deflection (as shown in Fig. 13.5) and adequate stresses (not shown here for the sake of brevity), the bridge deck dimensions were determined to be optimal at 12 in. depth, 24 in. wavelength and 6 in. contact width. The corresponding layer thicknesses were 1.2 in. for top flat face and 0.9 in. for hat-sine rib (case 4 in Table 13.2(a) and Fig. 13.5). The 6 in. (150 mm) contact width was particularly chosen to have adequate bonding area of the hat-sine rib section to the flat face.
Section with top and bottom flat face with hat-sine rib
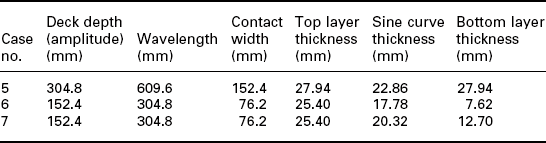
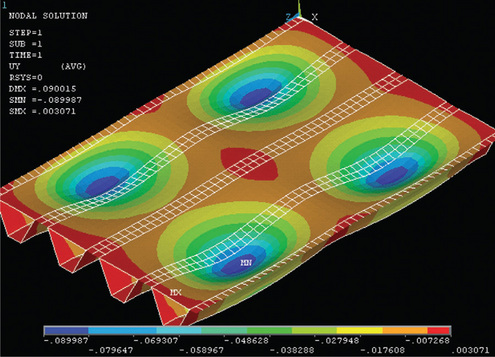
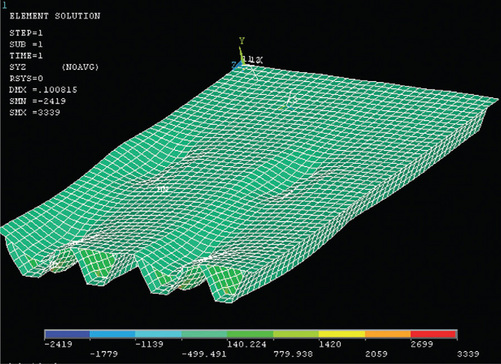
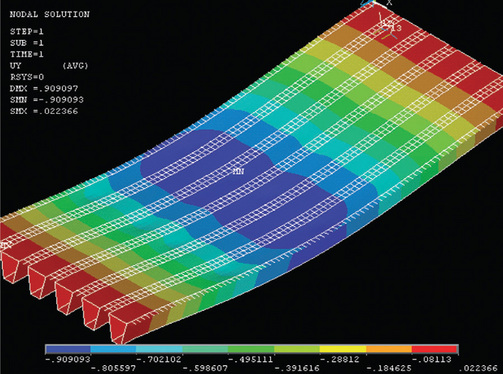
At the similar combination of wavelength and contact width, the deck system is also compared by adding an additional bottom layer, i.e., cases 5-7 as in Table 13.2(b), with the optimized case 5 as shown in Fig. 13.4. By comparing both shapes (cases 4 and 5), it is concluded that the most efficient and cost-effective section could be one which has lesser cross-sectional area while maintaining sufficient stiffness to control the deflection. Based on this criterion, the section shown by case 4 is still the optimized section (Fig. 13.5). It has 26.6% less cross-sectional area with a similar moment of inertia as case 5, but will consume lower manufacturing cost. It should be noted that the material for all cases is glass/PP except for cases 6 and 7, where the bottom layer material is carbon/PP, and that glass is cheaper than carbon fiber. For the optimized section (i.e., case 4), the maximum deflection of 0.09 in. (2.25 mm) is exactly at the point of contact wheel load (Plate VIII between pages 240 and 241). The maximum ultimate tensile stress of 6,392 psi (44 MPa) developed at the intermediate support is much less than the failure stress of 28,000 psi (193 MPa) for E-glass/PP composite laminate. The shear stresses oyz, axz due to ultimate load are 3,339 psi (23 MPa) and 1,669 psi (11.5 MPa), respectively (Plate IX between pages 240 and 241).
13.4.2 Double-lane bridge deck system
Further demonstration of the performance of the deck conceptual design is presented by studying a typical two-lane traffic, 60 ft (18.3 m) span bridge having a width of 24 ft (7.3 m) and depth of 36 in. (900 mm) (Fig. 13.6). The length-to-depth aspect ratio of the deck system is 20:1, which is reasonable for highway bridges. Similar to the single-lane bridge deck system, connection between deck and girder can be assumed to consist of shear studs cast into the cell of an FRP sandwich deck. Steel spirals are then positioned around each shear stud to aid in grout confinement.
Section with top flat face and hat-sine rib
Following the similar analysis process as in Section 13.4.1, the bridge deck dimensions were determined to be optimal at 36 in. depth, 48 in. wavelength and 16 in. contact width. The top flat face thickness was 3 in., and the sine rib component thickness was 2.5 in. (Fig. 13.7). The corresponding deflection and the maximum stresses were also within the allowable limits [11].
Top and bottom flat face with hat-sine rib
The analysis was carried out by varying sine rib parameters (Table 13.3); the sections having required stiffness to control the deflection within allowable limits are shown. In cases 1 and 2, carbon/PP was used in the bottom flat face of the deck system having a composite thickness between 3 and 3.5 in. Based on the combination of the least deflection and adequate stresses (not shown here for the sake of brevity) the hat-sine rib dimensions were determined to be optimal for case 3 compared to cases 1 and 2. Case 3, as shown in Fig. 13.8, provides a better section because it is cost effective and composed of glass/PP only with a component thickness between 2.0 and 2.4 in. Once again it should be noted that glass is cheaper than carbon fiber. Overall, the section shown by case 4 is the optimized section for this double-lane deck as it has 10.33% less cross-sectional area with comparable moments of inertia, and will consume less manufacturing cost compared to case 3 (Fig. 13.9). The deflection and ultimate shear stresses for the optimized section are 0.9 in. (22.5 mm), 6,366 psi (44 MPa), and 1,710 psi (11.8 MPa), respectively, and are shown in Plates X and XI (between pages 240 and 241).
13.4.3 Design verification
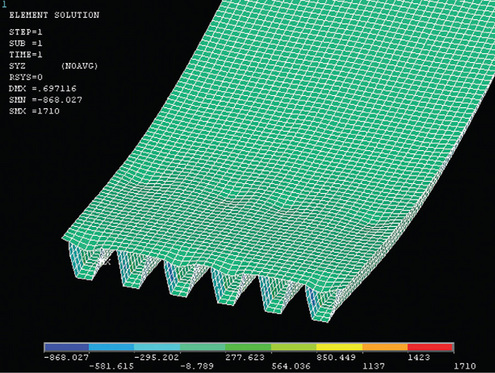
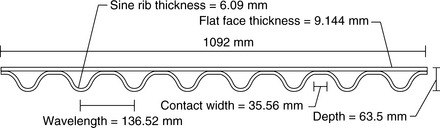
Design verification and analysis accuracy are compared by using the results of an experiment in which a panel made from E-glass/PP woven tape was tested under point loads (500 lbs (2.22 kN) to 2,000 lbs (8.90 kN)). The panel was simply supported and had a length of 43 in. (1075 mm) and a width of 29.5 in. (737.5 mm). Its shape, as shown by Fig. 13.10, consisted of 0.36 in. (9 mm) thick top flat face and 0.24 in. (6 mm) thick sine curve. The panel has the material properties as defined in Table 13.1. The experimental setup and details are mentioned in Ref. [4].
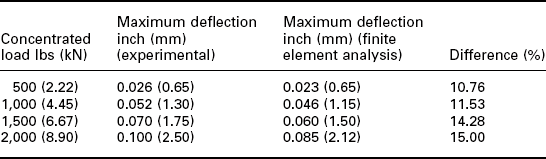
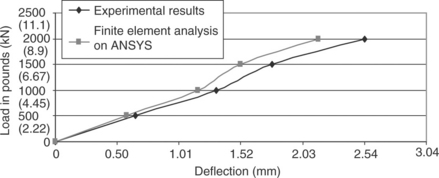
To check the accuracy of the finite element analysis, the panel is modeled on ANSYS using Shell 99 elements. The support boundary conditions are defined according to the experimental setup, and the process of finite element analysis is as defined. The experimental and FE analysis results are shown in Table 13.4. By comparing the experimental deflection with the Ansys analysis (Fig. 13.11), the analysis was found to underpredict the deflection by 10-15%. The difference between the analysis and the model has been attributed to the perfect contact between the hat-sine rib profile and the face panel assumed in the model, while in the experiment there is a relative deformation between the two. The relative deformation can be explained because, in the tested panel, the face panel was bonded to the hat-sine rib profile using hot-melt glue. In an industrial setting, this step may adopt an ultrasonic bonding method, which would provide higher bond strength and eliminate any relative displacement between the face and the hat-sine rib profile. However, the analysis captured the trend observed in the experiments adequately for verification purposes. The results from some preliminary analysis using interface elements between the top plate and the ribs are reported elsewhere [11] (not reported here for the brevity), which also confirmed the observation.
13.5 Comparing bridge deck designs
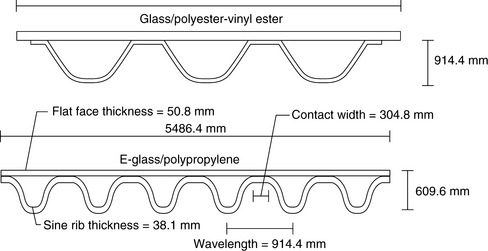
The performance of the proposed bridge deck system is compared to two other designs: the Lockheed-Martin bridge [12] and the bridge system proposed by Aref and Parsons [13].
13.5.1 The Lockheed-Martin bridge
A 30 ft (9.14 m) span composite bridge built by Lockheed is described by Dumlao et al. [12]. A schematic of the cross-section of the Lockheed bridge is shown in Fig. 13.12 together with the proposed bridge deck design. The Lockheed design was loaded with a pair of 32 kips axles with measured deflections less than Span/800. A similar loading condition is imposed for the proposed deck system by using two 32 kips (142 kN) axles with 14 ft (4.26 m) spacing; also the design is checked for tandem loading condition with 25 kips (111 kN) axles spaced at 4 ft (1.22 m) distance from each other. The maximum vertical displacement of the proposed design is 0.45 in. (11.25 mm) which is equal to the AASHTO limit, and it occurs under the tandem loading condition. The maximum Tsai-Hill failure index is 0.48, and it occurs due to factored loads (strength 1 load combination) using a pair of 32 kips (142 kN) axles with 14 ft (4.26 m) spacing. The interface shear stresses between the outer (top flat face) and inner (sine ribs) shell contact area are σyZ = 120 psi (0.82 MPa) and σxz = 366.5 psi (2.52 MPa). The weight of the proposed design is 28.1 kips and the dead-to-live load ratio is 0.439. The weight of the Lockheed bridge is 23 kips (102 kN), giving a dead-to-live load ratio of 0.36.
13.5.2 The bridge proposed by Aref and Parson [13]
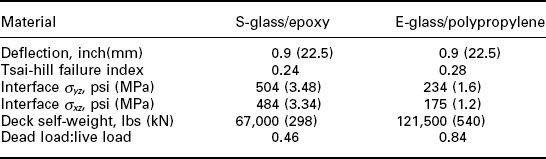
The performance of the proposed double-lane bridge deck system (as discussed in Section 13.4.2 ) is compared to the bridge system proposed by Aref and Parsons [13]. A schematic of the cross section of the bridge system proposed by Aref and Parsons [13] consists of seven inner cells encased in an outer shell and is shown in Fig. 13.13 together with our deck system. The performance comparison of both systems is summarized in Table 13.5, based on maximum deflection, failure indices, interface shear stresses, and the self weight of the deck system. The comparison of the proposed design with the modular fiber (S-glass/epoxy) deck system proposed by Aref and Parson [13] shows similar margin of safety with a Tsai-Hill index of 0.28 (proposed design) and 0.24 (Aref and Parsons [13]). Moreover, in the present design, a significant factor of safety is achieved in interface shear stresses between the outer (top flat face) and inner (sine ribs) shell contact area. The weight of our design is 121.5 kips (540 kN) which yields a dead-to-live load ratio of 0.84, and the weight of the S-glass/epoxy deck system is 67 kips (298 kN), giving a dead-to-live load ratio of 0.46.
Table 13.5
Performance comparison between S-glass/epoxy (Aref and Parsons [13]) and E-glass/PP (proposed design) deck
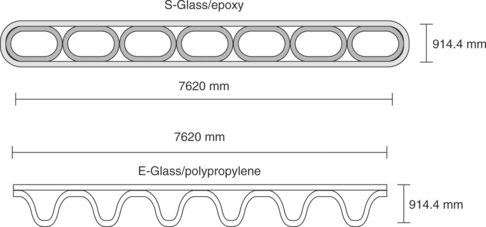
13.13 Cross sections of the Aref and Parsons [13] and the comparison thermoplastic (E-glass/PP) bridges.
13.6 Prefabricated wraps for bridge columns
As roadways and waterways become more congested, the risk of accidental collision with bridge piers remains a cause for concern. Bridge piers are designed for a variety of loading conditions, mainly compression, but often these structures fail when subjected to out-of-plane eccentric loading. Moreover, in engineering practice, there are many situations in which structures undergo impact or dynamic loading, such as during explosion, impact of ice load on pier structures, accidental falling loads, tornado-generated projectiles (i.e., objects picked up and converted to missiles by tornados), etc. For these reasons, along with the increased threat of terrorism, the need to find a way to protect these structures is critical. Over the last few years, the presence of composite materials in the construction industry has become more common. Most of these applications utilize prepreg thermosetting composites, the most common of which is carbon fiber-reinforced polymer, and so far most of the research conducted has concentrated on static and pseudo dynamic loading.
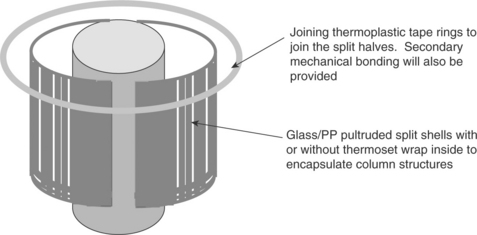
This study explored thermoplastic composite material produced in continuous pultruded form to produce a cost-effective split product form of directionally oriented glass fiber in polyurethane (or polypropylene) thermoplastic matrix for a representative bridge column. Two split halves will encapsulate the column with on-site mounting feasibility. The advantage of using pre-fabricated thermoplastic forms is they can be thicker than conventional thermoset wraps (such as presently used in bridge structures, only from a standpoint of enhancing stiffness/tensile strength). It is envisioned that under impact from unknown threats, such as collisions from trucks/ trailers or blasts, the structure will have progressive failure potential, in place of catastrophic fracture presently witnessed. The tape and pultruded thermoplastic form has flexibility to accommodate curvatures encountered as part of the structure, and can be used either alone (only to suppress catastrophic failure) or in conjunction with conventional thermoset wraps if ductility improvement is also needed. An example of the concept is shown in Fig. 13.14. The split halves can be connected by a combination of thermoplastic tape jackets around the halves and a secondary mechanical reinforcement. Furthermore, the rate of strain induced on the structure is severe. The polypropylene alone or polypropylene/glass is cost-effective [14] and is expected to enhance the failure strain of concrete structures by several orders of magnitude.
The work presented here will compare the effects of dynamic loading of this type of confinement with the most common composite strengthening technique to date, CFRP composite wrapping. Two series of tests will be performed in this research: uniaxial compression testing of cylinders and impact loading of columns. An explanation of the specimen designation system is given first. The first letters are used to denote the type of specimen, 'Cy' for cylinder and 'Co' for columns. The second letter establishes the confinement type, 'N' for plain samples, 'C' for FRP, and 'P' for polypropylene jacket-confined cylinders. The next letter denotes the type of concrete, 'B' for high strength. The first number in the scheme is for the confinement thickness (mm) or number of plies. Finally, the last number represents the sample number.
13.7 Compression loading of bridge columns
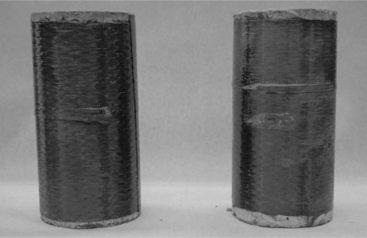
The purpose of the uniaxial compression tests of the concrete cylinders was to evaluate static loading phenomena such as the effect on axial strength and strain capabilities. For this study, two variables were investigated: confinement material (polypropylene and CFRP composites (for reference)) and thickness of the polypropylene confinement. Strains were recorded using unidirectional electrical resistance strain gages. Compression loading was conducted using a Tinius-Olsen Universal Testing Machine, with the load applied manually at a constant rate of 103 kPa/s. A MegaDAC data acquisition system was used to record both the load and strain data.
13.7.1 Specimen details
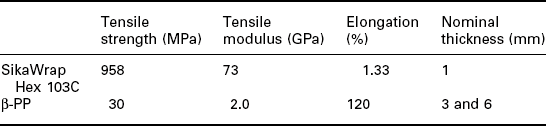
The average compressive strength of the concrete was 58.6 MPa. The cylinders were grouped as follows: three control specimens; three 3 mm and three 6 mm thick polypropylene; and, finally, three single-ply unidirectional CFRP composites. Unidirectional SikaWrap Hex 103C was used for the CFRP, with Sikadur 300 used for the bonding agent to the concrete surface. The fibers were oriented such that they provided reinforcement in the hoop direction (perpendicular to the applied compression load). After preparing the concrete surface and the CFRP composites, the material was rolled onto the cylinders. George Fischer beta (P)-PP [15] was used for the polypropylene and came in the following dimensions: 140 mm outer diameter, 13 mm wall thickness, and 5 m in length. This material was chosen since it had many desirable characteristics, including high impact strength, abrasion resistance, low weight, and a sizable operating temperature range, making it ideal for load-bearing applications. Since the polypropylene reinforcement is meant to act as passive reinforcement, the material was machined down from its original 13 mm wall thickness to the two thicknesses previously mentioned. Table 13.6 gives the material properties for the two types of confinement.
13.7.2 Stress-strain response
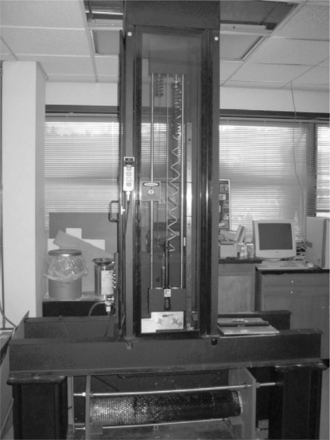
Comparison of the compression test data is presented in Fig. 13.15. Stress-strain data for the individual PP confinement materials can be found in Figs. 13.16 and 13.17. A review of the response curves in Fig. 13.15 demonstrates the polypropylene confinement produces a significant increase in the deformability of the concrete. However, it was unable to achieve similar compressive strength levels as that of the CFRP wrap concrete. For example, specimen CyCB1 reached a maximum axial stress of 98 MPa, whereas PP jacket specimens CyPB3 and CyPB6 could reach maximum 52 and 54 MPa, respectively. It was also obvious that isotropic CFRP wrapped around the circumference of the concrete did not affect the stiffness of the concrete up to peak concrete unconfined strength f. Therefore, in this range, stiffness of the unconfined concrete was very similar to the CFRP wrap concrete. However, that was not the case for the PP jacket concrete. The PP, being more-or-less orthotropic, increased the stiffness to a considerable degree. Moreover, both CyPB3 and CyPB6 specimens achieved a similar stiffness.
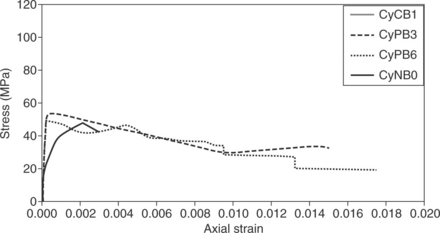
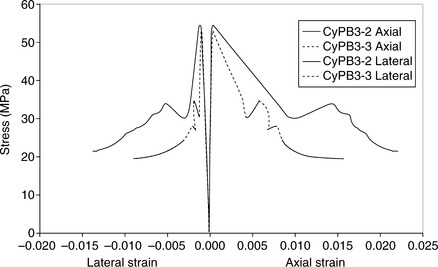
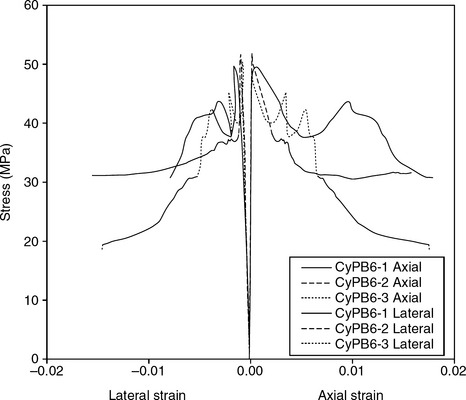
CFRP wrap specimen CyCB1 achieved an axial strain at peak stress of 0.0056 mm/mm which is 3.5 times the average axial strain of the unjacketed cylinders. PP jacket specimen CyPB3 achieved a maximum strain of 0.0166 mm/mm, which is 9.2 times the average axial strain of the unjacketed cylinders. Specimen CyPB6 achieved a maximum strain of 0.0181 mm/mm, which is 10.1 times the average axial strain of the unjacketed cylinders. Both PP jacket specimens therefore recorded a maximum strain more than three times the CFRP wrap specimen. On the other hand, a maximum transverse strain at failure of 0.012 mm/mm (Fig. 13.16) and 0.015 mm/mm (Fig. 13.17) was recorded across the middle gage length for CyPB3 and CyPB6, respectively.
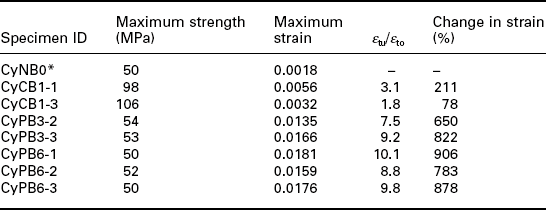
Initial matrix cracking formed in the wrap of specimen CyCB1 at an axial stress of 75 MPa. Rupture and debonding of strands of fibers from the matrix material of the CFRP wrap first occurred at a stress of 90 MPa. The specimen failed after a large number of strands of fibers ruptured and debonded from the wrap. Once ruptured, the fibers within these strands no longer contribute strength to the CFRP and thus confinement to the concrete. When CFRP wrap can no longer provide confinement, the specimen unloads. The rupture debonding of strands was concentrated along the middle gage length, though some also occurred within the top and bottom regions to a much lesser extent.
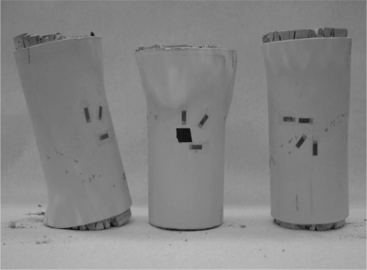
On the other hand, indication of initial concrete cracking was observed in the jacket of CyPB3 and CyPB6 at an axial stress of 54 MPa and 52 MPa, respectively. Once confinement was engaged, behavior of the concrete was a function of the circumferential stiffness of the confinement. Typically, three stages are seen in the stress-strain curves of fiber-reinforced polymer confined specimens. In the first region, it is the concrete that carries the axial load, due to minimal lateral expansion of the concrete core. Second, a nonlinear transition range begins when the concrete starts to expand, generating greater lateral strain. Finally, the confinement takes effect and the stiffness is shown to remain at a constant rate. No debonding occurred along the PP. However, the PP jacket column showed a very small gain in compressive strength, an almost insignificant increase in strength. This can be explained by the fact that the bulging of PP affected the post-f'C (post-peak) behavior. The polypropylene allowed the concrete to compact and dilate the confinement material. The effect of dilation can be seen in Fig. 13.18, since this phenomenon allowed the stress-strain curve to 'flat-line' (Fig. 13.15). This reflects a highly deformable mode of specimen failure relative to a specimen, for example, CFRP wrap which had failed by sudden rupture of all the fibers in a region of the wrap. The bulging of the jacket, however, was concentrated along the upper gage length, though some also occurred within the bottom regions to a much lesser extent.
Normalized strain data given by the ratio εtu/εto (strain at failure of the confined cylinder by strain of the unconfined cylinder) are shown in Table 13.7. The 3 mm PP jacket produced an average ratio of 8.4, and the 6 mm PP jacket yielded an average ratio of 9.6, which is impressive when compared with the 15.6 average ratio of the glass/PP confinement reported in earlier research [16].
13.7.3 Failure modes
The modes of failure observed during these tests varied depending on the confinement. The polypropylene confined samples exhibited a barreling effect as shown in Fig. 13.18. The ability to dilate considerably allowed the confined concrete to crush and compact inside the PP jacket. While this dilation was drastic, yielding of the polypropylene is evident in only a few places on the samples, and only one sample showed signs of material failure. Failure of the CFRP wrapped cylinders occurred due to fiber rupture near mid-height (Fig. 13.19).
13.8 Impact loading of bridge columns
The system used for impact testing was an Instron Model 8250 drop-weight impact machine with an instrumented striker (tup) assembly (Fig. 13.20). A flat striker was used for this test and had an impact area of 76 mm × 102 mm. For this study, the impact weight was 246 N. The hammer (tup) contained an internal load cell, which was used to record the contact load between the falling assembly and the column during the impact event. The load cell was rated for a maximum load of just over 44 kN. A drop height of 30 cm was used for all tests, since the combination of this height and the weight of the striker assembly produced loading close to that of the maximum allowed by the load cell. In previous studies using this machine, load-time plots reported peak loads several times the expected value. Conclusions from similar tests, drawn by Suaris and Shah [17], illustrated that this loading was not indicative of the material properties but instead was a result of inertial effects of the samples. Though these effects have been accepted and calculated before testing metals, concrete creates a more complex problem due to the relatively small fracture strain and increased size of test specimen [18]. As in previous testing, a rubber pad was added to the striker to eliminate the inertial effects or 'ringing' being generated from the impact of the steel hammer and concrete specimens.
As mentioned earlier, impact testing was conducted using a total of four concrete columns: one control specimen, one CFRP confined, and two confined by a PP jacket of 3 mm and 6 mm thicknesses. For the CFRP confined, the fibers were oriented along the length of the column such that they provided reinforcement perpendicular to the axis of impact. The concrete used was from the same batch that produced the high strength cylinders tested under uniaxial compression. All columns tested were 152 mm × 914 mm. In an effort to illustrate a similar loading situation as would be seen in reality, the columns were placed horizontally inside a testing jig and subjected to axial compression. Deflection, velocity, and energy absorption were recorded using the DynaTup software that accompanied the Instron drop-tower. Strain data were recorded separately from the rest of the impact data. Strain was measured using unidirectional strain gages and recorded using the DATAQ recorder. After testing and subsequently failing the control column (CoNB0), it was clear that it would be impossible to fail the confined columns. The PP columns (CoPB3 and CoPB6) were impacted an average of five times. This was done to see if the material would exhibit any signs of weakening. Since the CFRP confined sample was assumed to be stiffer than the PP confined columns, only two tests were conducted. All samples were impacted from a height of 30 cm in an effort to keep the load cell free from damage. Due to the limitations of the drop-tower machine, the impact loading can be classified as low velocity impact or velocity less than 10 m/s [19]. Average impact velocity for these tests was 2.4 m/s. A summary of test data is given in Table 13.8.
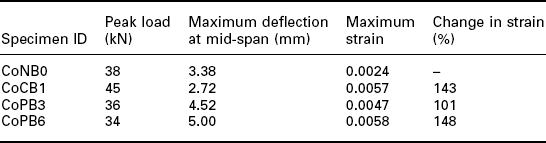
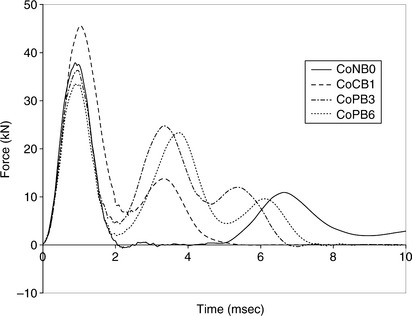
Figure 13.21 shows the load versus time plot. The inertial effects have been reduced and are not visible in this plot due to the addition of the rubber pad to the striker. This phenomenon was evident in tests conducted by Erki and Meier[20]. Several observations can be made from the figure. First, the initial peak was the actual peak load. The subsequent peaks of smaller amplitude are simply rebounds of the tup. Since it was the stiffest, CoCB1 had the largest peak load of all the specimens with a value of 45 kN. As expected, CoPB3 and CoPB6 have desirable lower peak loads of 36 kN and 34 kN, respectively, since these specimens were less stiff than CoCB1. Since CoNB0 cracked under the loading, it seems not to have the second peak, only a third after a little rest due to a delayed rebound of the tup for the cracking. The dynamic bending load increase, on the other hand, was highest for the less stiff columns (CoPB3 and CoPB6) and gradually declined in value with increased stiffness. This trend was also observed by Jerome and Ross [21].
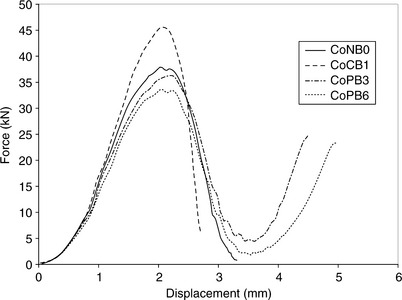
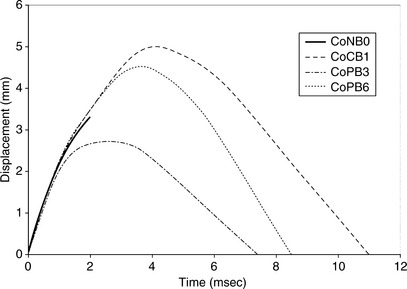
Based on the energy balance approach, the initial kinetic energy of the impactor deformed the structure during impact. Since the specimens used for this study were short columns and subjected to a compression sufficient corresponding to 1/8 Po, where Po = 0.85 Agfc') to provide fixity at the end against the impact, the stiffness was far too great to allow failure. It has been shown that the energy dissipated during vibration of composite structures is negligible [22]. From the load versus displacement curve (Fig. 13.22) however, CoPB6 deflected more than 5 mm and CoPB3 deflected about 4.5 mm. These deflections are much higher than CFRP wrap column CoCB1, which deflected about 2.6 mm, about half that of the PP jacket confined columns.
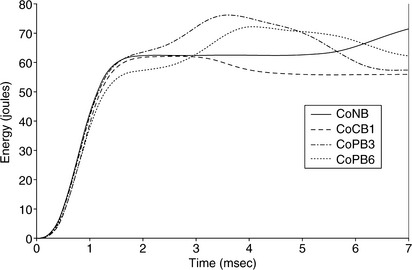
From the energy versus time curve (Fig. 13.23), it appears that energy absorption of the polypropylene was higher than that of the CFRP composites confinement. Energy absorption for the 3 mm PP jacket was higher than that of the 6 mm jacket. Specimen CoCB1 absorbed 62 J, whereas specimens CoPB3 and CoPB6 absorbed about 78 and 70 J, respectively. The displacement versus time curve (Fig. 13.24) indicates that the polypropylene jacket confined specimens produced higher deflection than the CFRP confined column and unconfined column. This effect was due to the ability of the material to compress and further absorb the energy from impact. Transverse flexural strain values recorded across the middle gage length showed that CoPB6 and CoCB1 have equivalent strain values at the point of impact, with an increase in capability of approximately 145% over the unconfined concrete. The increase in deformability of sample CoPB3 was slightly less, with an increase of about 100%.
13.9 Conclusion
13.9.1 Bridge decks
The design concept and manufacturing processes of thermoplastic bridge deck composite structural systems are presented by recognizing the structural demands required to support highway traffic. The deck system is carefully engineered by considering the structural efficiency and manufacturing ease of deck components. Glass/PP woven tape material is used based on its effective utilization to produce structural deck components with flat geometries and gradual radii/curvatures.
The structural system presented possesses several special features that contribute to its effectiveness, including the use of curved panels (sine ribs) which provide the nonplanar core configurations to increase the performance of the bridge deck system. In all deck design cases, the stiffness (i.e. serviceability) is the main governing factor which controls the design. Once the stiffness requirement has been satisfied, the strength of the structure proved to be sufficient. In both deck systems (single-lane and double-lane), the outer shell (top flat face) with sine ribs offers a more efficient and economical section. The proposed design is compared to two published composite bridge concepts proposed by Dumalao et al. [12] and Aref and Parsons [13]. Although the present design has higher self-weight, which results in higher dead-to-live load ratio than both the glass/polyester-vinyl-ester [12] and S-glass/epoxy deck systems [13], it could result in a better low-cost deck section based on the manufacturing and material cost comparison, as E-Glass/PP is much less expensive and the manufacturing process associated with it yields very good cost-effective results at a higher production rate [14].
13.9.2 Column wraps
Bridge columns are expected to sustain breaching and large inelastic rotation in plastic hinges during impact loading, a prime concern for the retrofit design to enhance the breaching and ductility capacity. Ductility will normally be provided by column plastic hinges. It is the plastic rotation of potential plastic hinges that is of greatest interest. The available plastic rotation capacity, and hence the ductility capacity, depends on the distribution of transverse reinforcement within the plastic hinge region. Transverse reinforcement provides the dual function of confining the core concrete, thus enhancing its breaching strength and enabling it to sustain higher compression strains, and restraining the longitudinal compression reinforcement against buckling. Most current bridge retrofitting applications utilize wet layup thermosetting composites, the most common of which is carbon fiber-reinforced polymer. However, FRPs possess a limited strain capacity relative to conventional materials such as steel. Finally FRP materials are relatively expensive.
This chapter discusses the results of the small-scale static cylinder tests and the impact tests on concrete columns. As summarized in the following, thermoplastic reinforcement jackets act to restrain the lateral expansion of the concrete that accompanies the onset of crushing, maintaining the integrity of the core concrete, and enabling much higher compression strains (compared to CFRP composite wraps) to be sustained by the compression zone before failure occurs. The mode of failure of PP wrapped specimens reflects a ductile mode of specimen failure relative to a specimen, for example, CFRP wrap, which had failed by sudden rupture of all the fibers in a region of the wrap. The bulging of the PP jacket, on the other hand, was concentrated along the upper gage length, though some also occurred within the bottom regions to a much lesser extent. No separation or debonding from the concrete surface occurred along the PP.
The impact tests were conducted to assess the energy absorption capacity of three concrete columns strengthened by PP confinement, a carbon/epoxy confined and one unconfined control specimen. All the results conclusively demonstrated the superior impact resistance properties of PP wrapped specimens over the CFRP. From the test results, the following conclusions were drawn.
1. Peak loading of the columns varied based on the stiffness of the confinement. Since the PP confined columns were the least stiff, they also exhibited the desirable least peak loading from the impact resistance design perspective.
2. Deflection of the PP confined columns was greater than the unconfined and CFRP confined columns. This is very favorable given that the time this displacement occurred was nearly six times greater than that of the plain specimen.
3. Transverse flexural strain values recorded across the middle gage length showed that the PP jacket strain demonstrates an increase in capability of approximately 145% over the unconfined concrete. The increase in ductility of the PP jacket confined specimens was about 100% over CFRP wrap columns.
4. Energy absorption of the 3 and 6 mm PP was significantly higher than that of the single-ply CFRP composites confinement. Energy absorption for the 3 mm PP jacket was higher than that of the 6 mm jacket, which can be attributed to the lower stiffness of the former.
5. The PP jacket confined columns produced higher deflection than the CFRP confined column and unconfined column. This effect was due to the ability of the material to compress and further absorb the energy from impact. Though failure was not possible for the PP wrapped specimens, the above results demonstrated that the usage of a thermoplastic prefabricated jacket can be a potential solution to the threat of impact.
13.10 Acknowledgment
The authors gratefully acknowledge funding and support provided by University Transportation Center of Alabama UTCA research project (UTCA 3229 and 4210).
13.11 References
[1] Committee 440 ACI 440R-96. State-of-the-Art Report on Fiber Reinforced Plastic (FRP)Reinforcement for Concrete Structures. Michigan: Farmington Hills, 1996.
[2] Hartness, T., Husman, G., Koeing, J., Dyksterhouse, J. The characterization of low cost fiber reinforced thermoplastic composites produced by the DRIFT process. Composites: Part A. 2001; 32:1155–1160.
[3] FTA Report Number FTA-AL026-7001-2003.1. Center for Composites Manufacturing. 2003
[4] Vaidya, U., Samalot, F., Pillay, S., Janowski, G., Husman, G., Gleich, K. Design and manufacture of woven reinforced glass/polypropylene composites for mass transit floor system. Journal of Composite Materials. 2004; 38(21):1949–1972.
[5] Budiansky, B. On the minimum weights of compression structures. International Journal of Solids and Structures. 1999; 39:3677–3708.
[6] Christos, K. Simultaneous cost and weight minimization of compositestiffened panels under compression and shear. Composites Part A. 1997; 28A:419–435.
[7] Swanson, G.D., Gurdal, Z., Starnes, J.H., Jr. Structural efficiency of graphite/epoxy aircraft rib structures. Journal of Aircraft. 1990; 27(12):1011–1020.
[8] Standard Specifications for Highway Bridges, 18th edition. DC: Washington; 2000.
[9] Report FHWA/NY/SR-00/134 Alampali, S., O’Connor, J., Yannoti, A. Design, Fabrication, Construction, and Testing of an FRP Superstructure, 2000.
[10] Kohnke, P. ANSYS Theory Reference, 11th edn. Canonsburg, PA: SAS IP Inc; 1994.
[11] MS thesis, CCEE Department Abro, A.M.Design and analysis of thermoplastic composite bridge superstructures. Birmingham, AL: The University of Alabama at Birmingham, 2006.
[12] Dumlao, C., Lauraitis, K., Abrahamson, E., Hurlbut, B., Jacoby, M., Miller, A., Thomas, A., Demonstration low-cost modular composite highway bridge. Proceedings of the First International Conference on Composites in Infrastructure, 1996:1141–1155.
[13] Aref, A.J., Parsons, I.D. Design and performance of a modular fiber reinforced plastic bridge. Journal of Composites Part B. 2000; 31:619–628.
[14] Wang, E., Gutowski, T.G. Cost comparison between thermoplastic and thermoset composites. SAMPE Journal. 1990; 26(6):287–300.
[15] (May 1999). Fische, George. Beta (β)-PP polypropylene piping system. http://www.us.piping.georgefischer.com, 2004.
[16] UTCA Project Report No. 032229, August. Uddin, N.Vulnerability reduction for bridges. University Transportation Center for Alabama, 2005.
[17] Suaris, W., Shah, S.P. 'Properties of concrete subjected to impact'. J. Struct. Eng. ASCE. 1983; 109(7):1727–1741.
[18] Server, W.L., Wullaert, R.A., Sheckhard, J.W. Evaluation of current procedures for dynamic fracture toughness testing. Flaw Growth and Fracture, American Standards for Testing and Materials, STP. 1977; 631:448–461.
[19] MS thesis Bartus, S.D.'Long-fiber-reinforced thermoplastic: process modeling and resistance to impact.'. Birmingham, AL: The University of Alabama at Birmingham, 2003.
[20] Erki, M.A., Meier, U. 'Impact loading of concrete beams externally strengthened with CFRP laminates'. J. Comp. Constr. ASCE. 1999; 3(3):117–124.
[21] Jerome, D.M., Ross, C.A. Dynamic response of concrete beams externally reinforced with carbon fiber reinforced plastic (CFRP) subjected to impulsive loads. Structures Under Extreme Loading Conditions, ASME, PVP. 1996; 325:83–94.
[22] Caprino, G., Lopresto, V., Scarponi, C., Briotti, G. Influence of material thickness on the response of carbon fabric/epoxy panel to low velocity impact. Comp. Sci. Technol. 1999; 59:2279–2286.