
Chapter 2
Gallery of JMP Graphs
Various Graphs and Their Platforms
Here are pictures of many of the graphs that you can create with JMP. Each picture is labeled with the platform used to create it. For more information about the platforms and these and other graphs, see the documentation on the Help > Books menu.

Histogram
Analyze > Distribution

Bivariate
Analyze > Fit Y by X
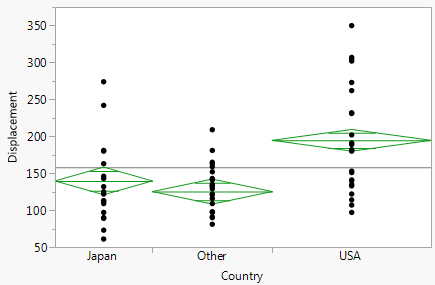
Oneway
Analyze > Fit Y by X

Oneway t Test
Analyze > Fit Y by X

Logistic
Analyze > Fit Y by X

Mosaic Plot
Analyze > Fit Y by X
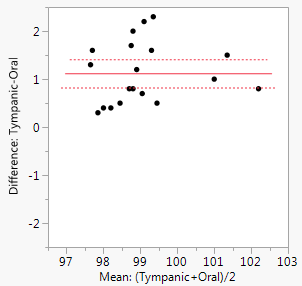
Matched Pairs
Analyze > Specialized Modeling > Matched Pairs

Leverage Plot
Analyze > Fit Model

LS Means Plot
Analyze > Fit Model

MANOVA
Analyze > Fit Model

Partition
Analyze > Predictive Modeling > Partition

Neural Diagram
Analyze > Predictive Modeling > Neural
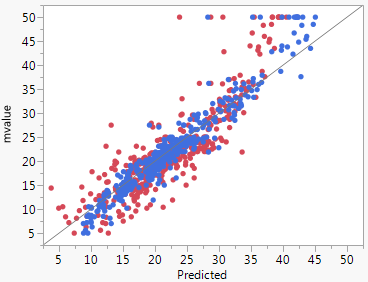
Actual by Predicted
Analyze > Predictive Modeling > Model Comparison

Nonlinear Fit
Analyze > Specialized Modeling > Nonlinear

Surface Profiler
Analyze > Specialized Modeling > Gaussian Process
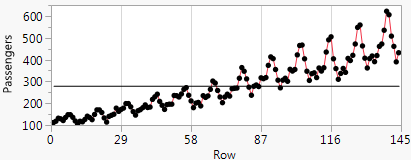
Time Series
Analyze > Specialized Modeling > Time Series

Screening
Analyze > Specialized Modeling > Specialized DOE Models > Fit Two Level Screening

FDR pValue Plot
Analyze > Screening > Response Screening

Scatterplot Matrix
Analyze > Multivariate Methods > Multivariate

Dendrogram
Analyze > Clustering > Hierarchical Cluster

Self Organizing Map
Analyze > Clustering > K Means Cluster

Principal Components
Analyze > Multivariate Methods > Principal Components

Canonical Plot
Analyze > Multivariate Methods > Discriminant

Loadings Plot
Analyze > Multivariate Methods > Partial Least Squares

XBar and R Charts
Analyze > Quality and Process > Control Chart Builder

Average Chart
Analyze > Quality and Process > Measurement Systems Analysis

Variability Chart
Analyze > Quality and Process > Variability/Attribute Chart

Goal Plot
Analyze > Quality and Process > Process Capability

Individual Measurement Chart
Moving Range Chart
Analyze > Quality and Process > Control Chart > IR

XBar Chart
Analyze > Quality and Process > Control Chart > XBar

Pareto Plot
Analyze > Quality and Process > Pareto Plot

Ishikawa Chart
Fishbone Chart
Analyze > Quality and Process> Diagram

Compare Distributions
Analyze > Reliability and Survival > Life Distribution

Nonparametric Overlay
Analyze > Reliability and Survival > Fit Life by X

Scatterplot
Analyze > Reliability and Survival > Fit Life by X
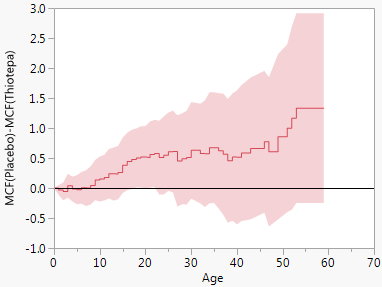
MCF Plot
Analyze > Reliability and Survival > Recurrence Analysis

Overlay
Analyze > Reliability and Survival > Degradation

Prediction Interval
Analyze > Reliability and Survival > Destructive Degradation
Forecast
Analyze > Reliability and Survival > Reliability Forecast

Piecewise Weibull NHPP
Analyze > Reliability and Survival > Reliability Growth

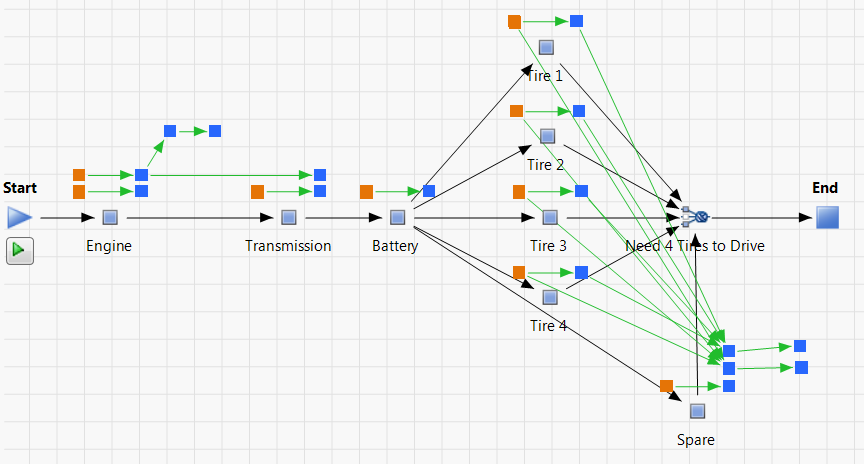
Reliability Block Diagram
Analyze > Reliability and Survival > Reliability Block Diagram

Failure Plot
Analyze > Reliability and Survival > Survival

Survival Quantiles
Analyze > Reliability and Survival > Fit Parametric Survival

Baseline Survival
Analyze > Reliability and Survival > Fit Proportional Hazards

Mixture Profiler
Analyze > Consumer Research > Categorical

Factor Loading Plot
Analyze > Consumer Research > Factor Analysis

Prediction Profile
Analyze > Consumer Research > Choice

Characteristic Curves
Analyze > Consumer Research > Item Analysis

Multiple Correspondence Analysis
Analyze > Consumer Research > Multiple Correspondence Analysis

Uplift Model
Analyze > Consumer Research > Uplift

Dual Plot
Analyze > Consumer Research > Item Analysis

Line Graphs
Graph > Graph Builder

Box Plots
Graph > Graph Builder

Stacked Bar Chart
Graph > Chart

Pie Chart
Graph > Chart

Needle and Line Chart
Graph > Overlay Plot

Dot and Line Chart
Graph > Overlay Plot

Three Dimensional Scatterplot
Graph > Scatterplot 3D

Three Dimensional Scatterplot
Graph > Scatterplot 3D

Contour Plot
Graph > Contour Plot

Bubble Plot
Graph > Bubble Plot

Parallel Plot
Graph > Parallel Plot

Cell Plot
Graph > Cell Plot
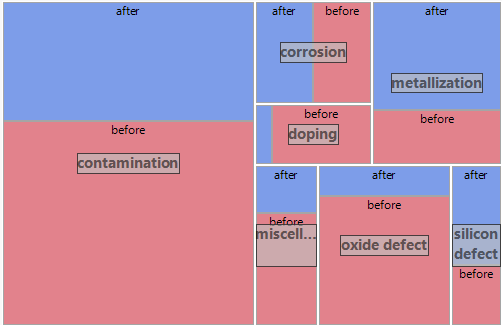
Treemap
Graph > Treemap

Scatterplot Matrix
Graph > Scatterplot Matrix

Ternary Plot
Graph > Ternary Plot

Prediction Profiler
Graph > Profiler

Contour Profiler
Graph > Contour Profiler

Surface Plot
Graph > Surface Plot
Mixture Profiler
Graph > Mixture Profiler

Multidimensional Scaling
Analyze > Consumer Research > Multidimensional Scaling

MaxDiff
Analyze > Consumer Research > MaxDiff

Stress Patterns Plot
Analyze > Reliability and Survival > Cumulative Damage
Repairable Systems Simulation
Analyze > Reliability and Survival > Repairable Systems Simulation

Latent Class Analysis
Analyze > Clustering > Latent Class Analysis

Predictor Screening
Analyze > Screening > Predictor Screening

Process Screening
Analyze > Screening > Process Screening

Text Explorer
Analyze > Text Explorer
..................Content has been hidden....................
You can't read the all page of ebook, please click here login for view all page.