
Chapter 4. Open Source Instrumentation: Interfaces, Libraries, and Frameworks
As we’ve alluded to in earlier chapters, tracing — even distributed tracing — isn’t a brand new solution to the challenges of tracing requests through a distributed application. After all, we’ve been building these sort of applications for decades, so it shouldn’t be terribly surprising. One thing in common with many of these solutions, however, is that they tend to be very focused. Sometimes this focus is for a particular technology stack or language, sometimes it relies on the usage of a particular middleware provider, sometimes it’s just a home-rolled solution that’s been maintained for years by engineers that aren’t with your company any more. More recently, we’ve seen this sort of behavior continue to proliferate, but wrapped up through cloud vendors and other platform providers.
Some people might say, “Well, what’s the problem here?” After all, for a great many people, these proprietary or otherwise closed solutions work fine, or at least are providing value to their users. While that certainly can be the case, we would posit that these solutions are often more brittle than they appear at first glance. The foremost argument against proprietary instrumentation is that it often leaves you at the mercy of the authors of the instrumentation solution when it comes to adapting your software to take account for new languages, methodologies, and other strategies to address challenges caused by increasing scale or business requirements. Remember — one of the few constants in life, and especially in computing, is change. At the time of this book’s writing, Microsoft is one of the largest contributors to Open Source software. Go back in time twenty years, tell someone that fact, and I’d imagine they’d be shocked! Relying on the current state of vendors and cloud providers and popular languages or runtimes is a path that will invariably lock you down to decisions that you might not want to be locked down to.
However, there is a solution to this dilemma, one that’s been widely adopted both by users, vendors, and software authors — the Open Source model of instrumentation. What we mean, in practice, is that rather than relying on languages and runtimes to provide the tools for instrumenting software, the community in general does so. In this chapter, we’ll discuss the current state of the art when it comes to these open source solutions, as well as some of the historical context and forerunner projects that you’re likely to encounter in the wild. We’ll also cover the API and methodology behind instrumenting software with these packages, such as OpenTelemetry.
The Importance Of Abstract Instrumentation
Why is it important to embrace abstract instrumentation in the first place? It’s a good question, especially if you’re already using a platform or tech stack that provides some sort of tracing functionality, and are thinking about adopting it to monitor your services. Historically, this information has been made available at several locations that tend to make sense — at the boundaries of your services, supplied via some ingress layer such as a load balancer, web proxy, or other routing service. These trace identifiers, such as the X-Amzn-Trace-Id of Amazon’s ELB or the fairly opaque tracing headers supplied by Microsoft’s IIS (Internet Information Services) are able to provide a fairly thorough view into a single request as it moves through your services. That said, there’s a few critical areas where we find these legacy tracing methods to fall short.
The first test that these tracing methods fail is that they suffer from a lack of portability. Take, for example, IIS Request Tracing. It would perhaps not surprise you to learn that using this requires you to also use IIS as your web server/proxy, which also implies that your software runs on Windows Server. While we won’t suggest that there’s no software that runs (and generates perhaps a massive amount of business value) on Windows Server, we would also suggest that it’s not quite as popular these days as it once was. The associated costs of this lock-in can be deliterious, however. You may delay or defer maintenence and upgrades to maintain your monitoring, opening you up to security vulnerabilities. Advancements in monitoring platforms may provide you with improved insights and lower costs, but you may be unable to take advantage of them as you’ll be locked in to your existing instrumentation. Finally, even if you’re generally happy with the level of control and insight that your proprietary instrumentation grants you, you may find it difficult to convince new team members of its greatness if they’ve learned to appreciate newer tools.
The second test that proprietary tracing methods fail at is that they tend to not be adaptable to distributed applications. One area where this is made plain is when attempting to instrument a client:server relationship over some external link, such as the internet. Without some abstract instrumentation on both sides — the mobile application or client web application, and the backend server — you’ll often have to resort to manual hacks to fit and transform data being generated by two potentially separate systems. Often, these proprietary systems will begin their traces at the ingress point rather than at the client, which can segregate your data rather than providing a single, end-to-end view into a request. These systems often lack internal extensibility, which is to say that you may find it challenging or impossible to create sub-traces of service functionality outside of the top-level HTTP request. Additionally, you’ll find that these systems may struggle at instrumenting transport methods that aren’t carried across HTTP, thus leaving you with a tangled mess of incompatible trace data being generated by your HTTP, gRPC, SOAP, or other carriers. This can stymie refactoring for performance, or integration with new services and technologies.
The third, and final, test that these methods fail at is that they promote vendor lock-in by necessity or by design. Don’t like the analysis tools available? Too bad! Don’t care for a particular instrumentation API? You’re stuck with it, quite generally, without wrapping the provided API in your own. Even this can only do so much, depending on the underlying design of the system. One surprisingly common situation that we’ve seen is that this lock-in can paralyze teams that are spinning up new services, as there may be business reasons that prevent the allocation of additional analytic capacity. A popular pricing model for monitoring, for example, relies on the amount of hosts or containers that are being monitored at any given time — if you’re locked-in to a vendor with this pricing strategy, it can actually act as a damper on the amount of new instrumentation being added to your application, due to cost concerns. While this may seem like a savvy way to save a few bucks while developing a new and unproven idea, you don’t have a way to know ahead of time if suddenly this new service takes off (or, worse, becomes a sneaky failure-prone piece of code causing difficulties, headaches, and many late-night pages for other teams!)
Abstract, open source, instrumentation solves these problems quite neatly. Your instrumentation is portable to any underlying OS that supports the language you’re writing it in — Linux, Windows, macOS, iOS, whatever! Since it’s open source, even if it doesn’t work right now, you have the ability to fork it and add support if required. Thankfully, the major open source instrumentation interfaces and frameworks have wide support for the majority of general purpose programming languages in use today… although if you wanted to port it to Perl, we’re sure someone would be grateful. As could be expected from a widely-supported framework, open source and abstract instrumentation is very adaptable to your changing requirements and needs. As your services decompose into smaller services, you’ll find that abstract instrumentation fits in very neatly with your new service boundaries, regardless of how they’re being written, deployed, or run. Abstract instrumentation makes it easier to integrate your instrumentation with other technologies as well, such as service meshes or container orchestration platforms. Not to mention, as you integrate new services into your distributed application, abstract instrumentation grants you the flexibility to share a common language of instrumentation across disparate teams. Finally, and most importantly, abstract instrumentation prevents vendor lock-in of analysis or instrumentation. Since the instrumentation APIs, trace data format, propagation headers, wire format, and more are defined openly and publicly, you’ll be able to use them (either directly or through a shim) with any sort of analysis system you can imagine. As of the time of this writing, almost every major monitoring vendor supports at least one — and usually more — open source tracing formats, thus allowing you the flexibility of write once, run anywhere with your instrumentation code.
Now that we’ve gone over the benefits of these instrumentation frameworks, let’s take a look at the most popular ones available, starting with the newest: OpenTelemetry.
OpenTelemetry
Writing an instrumentation library is, in a word, difficult. While the actual process of collecting and generating telemetry from a service is conceptually fairly straightforward, implementing that process in a highly performant way that also can get buy-in from a diverse group of users is extremely challenging. Why is this the case? The foremost reason is that for as much as any two pieces of software have in common, they’re also just as likely to be very different. While somewhat reductionist to say, its a useful thing to keep in mind when discussing the challenges of writing instrumentation libraries for a general-purpose audience. However, there are several good reasons that you might perfer a general-purpose instrumentation library over a bespoke one:
-
A general-purpose library will be more likely to be more performant in the general use-case.
-
The authors of the general-purpose library are more likely to have considered edge cases and other situations.
-
Using a general-purpose library can save you man-months of maintenence headaches in adapting, extending, and using a bespoke one.
As software becomes more complex, and development cycles become more strained, the rationale for the general-purpose library grows. You probably don’t have the time, nor desire, to implement your own telemetry collector or API. You might not have the expertise to create or maintain bespoke telemetry libraries in every language used by your application, or you may find the organizational dynamics of creating an internal standard insurmountable. Finally, you probably don’t want to have to reinvent the wheel from scratch in terms of generating telemetry data from your dependencies — RPC frameworks, HTTP libraries, etc.
OpenTelemetry solves these problems, and a host of others, for you. The primary goal of OpenTelemetry is to provide a single set of APIs, libraries, agents, and collectors which you can use to capture distributed tracing and metric telemetry from your application. In doing so, OpenTelemetry imagines a world where portable, high-quality, telemetry data is a built in feature of cloud native software.
OpenTelemetry was formally announced in May of 2019 as the next major release of both OpenTracing and OpenCensus. These two projects had similar goals, but different ways of achieving them. In truth, you can say that the seeds for OpenTelemetry were planted in the fall of 2018, in several wide-ranging Twitter threads that crystallized the major stumbling block facing both projects — the appearance of a standards war between the two. Open source project authors, seeing that there were two incompatible standards for instrumentation, would defer or demur adding tracing to their libraries and frameworks in the absence of consensus about which they should focus on.1 These, and other, disagreements lead to back-channel negotiations and discussions between the founders of each project along with a neutral mediator. A small technical team was formed to prototype a merged API, which became the initial prototype of OpenTelemetry. Spring of 2019 saw work continue on the prototype, along with efforts to codify the new governance structure — taking lessons from other successful Open Source projects, like Kubernetes. After the announcement in May, contributors from a wide variety of companies including Microsoft, Google, LightStep, Datadog, and more worked in concert to formalize the specification, API, SDK, and other components.
Which brings us to now — OpenTelemetry, at the time of this writing, is still in an alpha phase. The project anticipates a beta by the time you’re reading this, but as is the nature of Open Source, things may change in terms of timeline. With that in mind, we’ll focus this section mostly on the distributed tracing components in OpenTelemetry, along with critical parts of its design.
OpenTelemetry is comprised of three major components. These are the API, the SDK, and the Collector. These components implement the OpenTelemetry specification and data model, and are designed to be interoperable and composable with each other. What does this mean? In short, parts of these components can be swapped out with differing implementations, as long as those reimplementations conform to the specification and the data model.
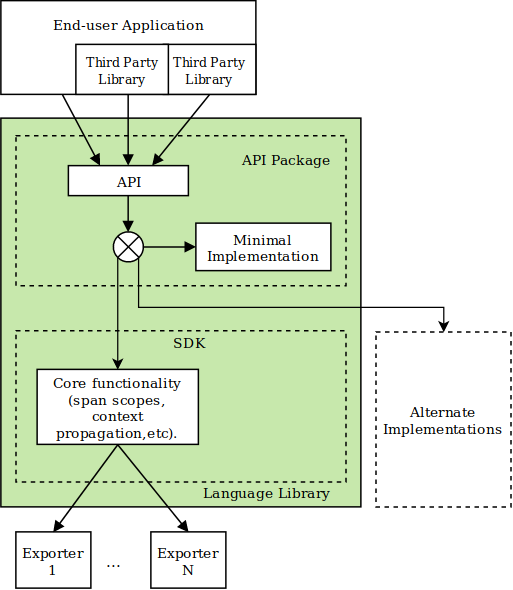
Figure 4-1. A generic OpenTelemetry library.
As seen in Figure 4-1, there are two main parts of any given OpenTelemetry library. The API contains the interfaces required for writing instrumentation code, along with a minimal (or No Op) implementation of the SDK. Generally, the API will be packaged with the SDK, which implements the core functionality of the API such as managing span state and context, serializing and deserializing span context from the wire, and other features. External to the SDK are Exporters, plugins that translate and transmit the OpenTelemetry trace data to a suitable backend service for analysis. Each of these components are decoupled from the other; You can use the API with no SDK (see Figure 4-2), for example, or selectively reimplement parts of the SDK.

Figure 4-2. Minimal implementation of OpenTelemetry.
Who are each of these designs for? You can generally think of it in the following terms:
-
If you’re writing code that will primarly be used as a library, then you would use the API by itself.
-
If you’re writing a service that will run — either standalone, or in concert with other services — then you’d use the API and SDK.
The rationale here is fairly simple. Let’s say you’re writing a library that performs some convenient function, like an optimized search on some set of data. Your users want to be able to trace your code — giving them insight into the number of iterations it requires to find the desired search term, for example. By adding tracing instrumentation, you can accomplish this very easily, either by creating a single span that represents the work being done by your library, or multiple spans representing each iteration (if you parallelized the algorithm in some way, this latter approach may be more useful). However, you want your library to be fairly performant and to have few external dependencies; After all, it’s an optimized piece of code. In this case, you’d only take a dependency on the OpenTelemetry API package. When someone imports and uses your library that is also using the OpenTelemetry SDK, your library would automatically swap over to using the full implementation rather than the minimal one, allowing your end users to trace the activity of your code.
With this in mind, what does the OpenTelemetry API provide, anyway? There’s three major areas — DistributedContext, Tracing, and Metrics. We’ll focus mostly on the first two in this text. First, Tracing. The primary building block of spans in OpenTelemetry is the Tracer. The Tracer provides methods for creating and activating new Span objects, along with the ability to track and manage the active Span in the process context. Each Tracer is configured with Propagator objects, which allow for transferring the span context across process boundaries. The API provides a TracerFactory which allows for the creation of new Tracer objects, which each have a required name and an optional version. OpenTelemetry refers to this concept as “named tracers”, and they act as a namespacing mechanism for multiple logical components inside a single process. For example, if we were to instrument a service that used an HTTP framework to communicate with other services, we would name the tracer for our service’s business logic something like myService, while instrumentation for the HTTP framework would be named opentelemetry.net.http. This helps in preventing collisions in span name, attribute key, or other factors. Optionally, we can assign a version string to our tracer that should correspond to the version of the instrumentation library itself (i.e., semver:1.0.0).
Each Tracer has to provide three methods — getting the current Span, creating a new Span, and activating a given Span as the current one. In addition, it should provide methods to configure other important tracing components, like Propagator objects. When creating a new Span, the Tracer will first check if there’s an active Span, and create the new one as its child. In addition, a Span or SpanContext can be provided when creating a new Span as its parent. Each Span is required to contain a SpanContext, which is an immutable data structure that contains identifiers for the trace, span, and other flags and state values:
-
TraceId- 16 byte array with at least one non-zero byte. -
SpanId- 8 byte array with at least one non-zero byte. -
TraceFlags- Details about the trace. Present in all traces, unlikeTracestate. -
Tracestate- System-specific configuration data, which allows for multiple tracing systems to participate in the same trace.2 -
IsValid- A boolean flag which returns true if theTraceIdandSpanIdare valid (non-zero). -
IsRemote- A boolean flag which returns true if theSpanContextwas propagated from a remote parent.
The Span is a data structure that represents a single operation in a trace. Each trace contains a root span that represents the end-to-end latency of a request and, optionally, sub-spans that correspond to sub-operations. The Span encapsulates information like the name of the operation, its SpanContext, a parent span, the start and end timestamp of the operation, a map of Attribute s, Link s to other Span s, a list of Event s with timestamps, and a Status. Some of these are more self-explanatory than others. The start time of a Span should be set to thee current time that it was created, but you can override this with an arbitrary timestamp as well. Once a Span has been created, you’re able to change its name, set Attribute keys and values, add Link and Event objects — but only before the Span has finished. Once an end time has been set, these values become immutable. Since the Span is not intended to propagate information inside a process, you should not provide access to Span fields other than SpanContext. There’s a few new concepts here, so we’ll break them down.
The name of the Span is a requirement when creating a new Span, but its one of the only absolutely required parameters. Depending on the implementation, a Span may be automatically created as the child of the current active Span, but you also have the option to indicate that it should be a new root span. The SpanKind field is used to describe the relationship between a given Span and its parents and children in the trace. The two properties that it describes are if the span is the parent or child of a remote operation, and the second is if the span represents a synchronous call. A single span should only have a single SpanKind in order for the field to be meaningful to analysis systems. See TODO: SPANKIND CHART this appendix for a complete description of SpanKind values. Attribute s are a collection of key-value pairs that can either be created at span creation time, or during the lifetime of the span. In general, you want to set known attributes at span creation. Link s are between arbitrary amounts of spans that have some causal relationship. They can exist between spans in a single trace, or across multiple traces. When would you use Link objects? First, you may want to use them to represent batch operations, where a single span was initiated from multiple incoming spans, each representing a single item in the batch. Additionally, a link can declare the relationship between an originating trace and a following trace. Consider a trace entering a trusted boundary of a service (such as remote client code, like a web browser) and being forced to generate a new trace rather than relying on the incoming context. The root span in the new trace would be linked to the old trace. Finally, as mentioned earlier, the start and stop timestamps are required but are generally automatically generated for you. You are able to tell the API to create a span with an arbitrary start and stop timestamp, which is useful if you’re creating some sort of proxy that transforms existing telemetry data (such as a log file) into a trace.
Once you’ve created a Tracer and a Span, what can you do with it? The API provides several required methods:
-
Get the
SpanContext. -
Check if the span
IsRecordinginformation. -
SetAttributeson the span. -
AddEventsto the span. -
SetStatusof the span. -
UpdateNameof the span. -
Endthe span.
While some of these are fairly self-explanatory, such as ending the span, others are more nuanced. IsRecording is one of these — this method returns a boolean value indicating whether the span is recording events, attributes, etc. The intended design of this flag is to avoid potentially expensive computation of attributes or events when a span is not being recorded. An interesting wrinkle to this is that the flag is independent of the sampling decision of the trace. An individual span may record events, even if the trace that it is a member of has been sampled out (based on flags in the SpanContext). The rationale here is that you may want to record and process the latency of all requests with instrumentation, while only sending a subset of the instrumented requests to the backend. SetStatus lets you modify the status of a span operation. By default, a span will have a status of Ok, indicating that the operation that the span represents completed successfully. You can see a full list and description of valid statuses (which will look familiar if you’ve used GRPC) in [Link to Come]. Keep in mind, you can also create your own status codes through the API, which would be useful for creating statuses that map to your own RPC system.
| Code | Description |
|---|---|
|
The operation completed successfully. |
|
The operation was cancelled (typically, by the caller). |
|
An unknown error occurred. |
|
The client specified an invalid argument. Differs from |
|
Deadline (timeout) expired before operation could complete. |
|
The entity requested could not be found. |
|
The entity already exists (if we were trying to create it). |
|
The caller was authenticated, but did not have permission to execute the desired operation. |
|
Some resource was exhausted, such as a API rate limit, per-user quota, or physical resource like disk space. |
|
The operation was rejected because the system is not in the appropriate state for the execution of the requested operation. |
|
The operation was aborted. |
|
The operation was attempted outside a valid range. Unlike |
|
The requested operation is not implemented or supported in this service. |
|
An internal error occurred. |
|
The requested service is unavailable. |
|
Unrecoverable data loss or corruption occurred. |
|
The request is not valid due to invalid or missing authentication credentials. |
SetAttributes allows you to add key-value pairs to a span. These attributes, which are also commonly referred to as tags, are the primary method of aggregating and indexing spans in a backend analysis system. Attribute keys must be strings, and attribute values may be strings, boolean, or numeric values. If you try to set an attribute that already exists, the new value will overwrite the existing one. AddEvents allows you to add timestamped events to a span. An event is roughly analagous to a log statement. These events can also have attributes, allowing you to make structured event data.
That was a lot of ground to cover, so let’s illustrate it with a simple example of how it all works.
importio.grpc.ManagedChannel;importio.grpc.ManagedChannelBuilder;importio.opentelemetry.OpenTelemetry;importio.opentelemetry.exporters.jaeger.JaegerGrpcSpanExporter;importio.opentelemetry.sdk.OpenTelemetrySdk;importio.opentelemetry.sdk.trace.export.SimpleSpansProcessor;importio.opentelemetry.trace.Span;importio.opentelemetry.trace.Tracer;publicclassOpenTelemetryExample{// Get a tracer from the tracer factoryprivateTracertracer=OpenTelemetry.getTracerFactory().get("OpenTelemetryExample");// Export traces to JaegerprivateJaegerGrpcSpanExporterjaegerExporter;publicJaegerExample(Stringip,intport){this.ip=ip;this.port=port;}privatevoidsetupJaegerExporter(){// Set up a GRPC channel to export span data to Jaeger.ManagedChanneljaegerChannel=ManagedChannelBuilder.forAddress(ip,port).build();// Build the Jaeger exporter.this.jaegerExporter=JaegerGrpcSpanExporter.newBuilder().setServiceName("OpenTelemetryExample").setChannel(jaegerChannel).setDeadline(30).build();// Register the Jaeger exporter with the span processor on our tracer.OpenTelemetrySdk.getTracerFactory().addSpanProcessor(SimpleSpansProcessor.newBuilder(this.jaegerExporter).build());}privatevoidmakeSpan(){// Generate a spanSpanspan=this.tracer.spanBuilder("test span").startSpan();span.addEvent("about to do work");// Simulate some work happening.doWork();span.addEvent("finished doing work");span.end();}privatevoiddoWork(){try{Thread.sleep(1000);}catch(InterruptedExceptione){}}publicstaticvoidmain(String[]args){JaegerExampleexample=newJaegerExample("localhost",14250);example.setupJaegerExporter();example.makeSpan();// Wait for things to complete.try{Thread.sleep(1000);}catch(InterruptedExceptione){}}}

All spans created by this tracer will be prefixed with the name we enter here.

There are other span processors available in OpenTelemetry — this one sends each span as it finishes. Alternately, you can use a batching processor that sends groups of spans on some time interval.

We could also add attributes or other metadata here.
As you can see, the basics are pretty straightforward. Create a tracer, register an exporter, then create spans. You’ll need to do a bit more to instrument your actual services, however — you can learn more about instrumenting a real service in the next chapter. For now, let’s quickly discuss what we didn’t talk about OpenTelemetry. First, we didn’t touch on the metrics component, as this text is focused on distributed tracing. Second, we didn’t discuss the distributed context components of OpenTelemetry in detail. You don’t need to completely grok the distributed context API and its implementation right now, but we’ll cover it in an appendix TODO: ADD DCTX APPENDIX.
OpenTelemetry is the new standard for instrumenting your code for distributed tracing. Its broad base of support from major cloud and observability vendors ensures that it will have the necessary resources for maintenence and improvements over time, and its anticipated to gain adoption rapidly in existing and new open source frameworks and libraries. However, it’s entirely possible that you’ll see its predecessors in the wild for some time to come. We’ll take you through them now, and help you understand not only the differences between them and OpenTelemetry, but also the similarities.
OpenTracing and OpenCensus
OpenTelemetry is the product of the work that has come before it in a very real sense — it’s the merger of two prior observability frameworks, OpenTracing and OpenCensus. It’s extremely likely that you’ll continue to see these frameworks “in the wild” for years to come due to their popularity. What are they, and how do they differ from OpenTelemetry? In this section, we’ll discuss the specification and API of these frameworks and indicate some of the drawbacks that lead to the creation of OpenTelemetry.
OpenTracing
OpenTracing was launched in 2016, with the goal of fixing the broken state of tracing instrumentation3. While distributed tracing was in use at large tech companies, such as Google, for over a decade overall adoption had been slow. The OpenTracing authors saw this as a failure at the point of instrumentation — namely, that the wide variety of processes that a request would pass through all required instrumentation to inter-operate, and the existing instrumentation options would neccessarily bind you to a specific tracing vendor. As mentioned in earlier chapters, the trace context must remain unbroken through the entire request in order to provide end-to-end visibility. This was the primary rationale behind OpenTracing, to provide a standard mechanism for instrumentation that wouldn’t bind any particular package, library, or service author to a particular tracing vendor. Prior efforts in this space focused on standardization of data formats and context encoding rather than APIs to manage spans and propagation of the trace context between services. While this could be useful, the authors determined that it wasn’t required for the widespread adoption of distributed tracing. Indeed, the problem was (and, in large part, still is) that the point of instrumentation matters a great deal. If you instrument your application code and business logic, that can be useful, yes — but, if the middleware and frameworks that your application relies on are instrumented, then that is much more valuable as it means you benefit from the instrumentation without additional effort during development and can extend the instrumentation into your business logic easily. How did the authors seek to accomplish this? To achieve their goals of vendor-neutrality, OpenTracing could not be overly opinionated about data formats, context propagation encoding, or other factors. Instead, they built a semantic specification that was portable across programming languages and provided an interface package that others could implement. The overall design can be seen in Figure 4-3.
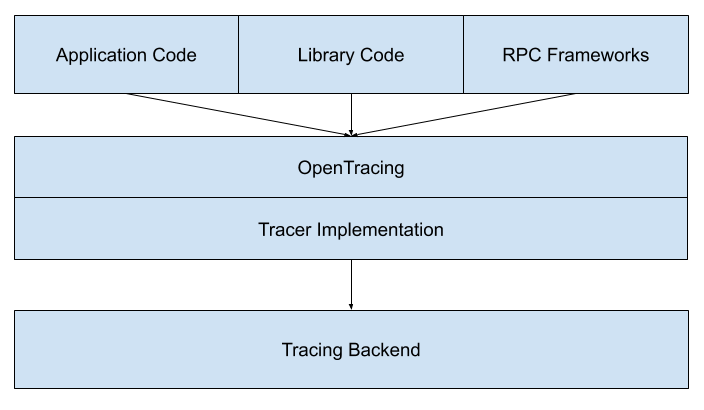
Figure 4-3. The OpenTracing Ecosystem Design (https://opentracing.io/docs/best-practices/)
What does the OpenTracing API look like? As it’s primarily focused on span and context management, it has a fairly constrained API surface. There are three main object types in OpenTracing: Tracer, Span, and SpanContext. We’ll discuss each of them in turn.
A Tracer is capable of creating Span objects, and is responsible for serialization and deserialization of them across process boundaries. Tracers must satisfy the following requirements:
* Start a new Span.
* Inject a SpanContext into a carrier.
* Extract a SpanContext from a carrier.
A Span started by a tracer must have a name, which is a human-readable string that represents the work being done by the span. The specification proscribes that the “operation name should be the most general string that identified a (statistically) interesting class of Span instances.” As mentioned in earlier chapters, this is because the name is the primary aggregation key for your traces. A Span may also be created with references to other SpanContext objects, an explicit starting time, and key-value pairs of tag data. SpanContext objects are also operated on by the Tracer for context propagation purposes through the inject and extract methods. First, we should define what a carrier is. This is simply a data structure that “carries” the encoded SpanContext, such as a text map or blob of binary data. OpenTracing requires three formats for injection and extraction; Text Map, HTTP Headers, and Binary. Text Map and HTTP Headers are very similar in that they’re both string-to-string maps, but HTTP Headers require that both the keys and values satisfy RFC 72304. Binary is a single arbitrary blob of bytes that represent the SpanContext.
In practice, it is this last part — injecting and extracting a SpanContext — that has been the cause of much consternation in the distributed tracing community. As OpenTracing did not specify a data format for the context headers (in part due to significant existing work in the space from projects such as Zipkin, which we’ll discuss in the next section), several different keys are commonly seen in the wild. These include x-ot-span-context, a binary blob used by Envoy, the B3 headers (x-b3-traceid, x-b3-spanid, etc.) and Jaeger’s uber-trace-id which are both HTTP Headers, and more. In addition, many organizations that had an existing tracing implementation would use or re-use their tracing headers and adapt them to the OpenTracing API. As described above, many of these issues are made moot by the adoption of W3C TraceContext, which provides a universal standard for propagating trace state over the wire, but it’s likely that we’ll see these legacy headers in use for years to come.
Moving along, OpenTracing’s second primary object type is the Span. A Span implementation must satisfy the following requirements:
-
Retrieve the
SpanContextof theSpan. -
Overwrite the
name. -
Finish (or complete) the
Span. -
Set a tag on the
Span. -
Create a
logmessage on theSpan. -
Set an item in the
Spanbaggage. -
Get an item in the
Spanbaggage.
Some of these methods are fairly self-explanatory, such as overwriting the name of the span. One important note is that after a span is finished, no other methods other than to retrieve the SpanContext may be called on it. As with starting a span, finishing a span accepts an optional explicit timestamp — if unsupplied, the current time will be used. Logs are an interesting field on spans, as they can accept an arbitrary value as opposed to tags, which can only accept string, numeric, or boolean value types. This means, for example, that complex objects can be logged and, subject to the capabilities of the trace analyzer or OpenTracing implementation, interpreted. Finally, we come to baggage. Baggage items are key-value pairs where both the key and value must be a string. Unlike tags or logs, baggage items are applied to the given Span, its SpanContext, and all Span objects that directly or transitively reference that span. When adding baggage items, they’re attached to the SpanContext rather than to the Span itself, so when you inject that context and extract it on the other side of an RPC, the baggage has gone along for the ride and can be retrieved. Baggage is a powerful tool, as it allows for developers to easily pass values throughout their system, and should be used with care.
Finally, the SpanContext — we’ve discussed it both in this chapter and others, and its history in OpenTracing is complex. Originally, it only exposed a single method — an iterator for all baggage items. The authors left the actual implementation largely up to authors of tracers that implemented OpenTracing, in a bid for compatibility. Over time, the specification was extended to offer accessors for the Trace ID and Span ID (ToTraceID and ToSpanID respectively), which would return a string representation of the trace and span ID values. This was not extended to every language prior to the development of OpenTelemetry, however, so it’s unlikely to be seen in the wild. For the most part, as far as the specification is concerned, a SpanContext is an opaque identifier.
What does it look like in practice? Let’s go through a small example in Java.
importio.jaegertracing.Configuration;importio.jaegertracing.Configuration.ReporterConfiguration;importio.jaegertracing.Configuration.SamplerConfiguration;importio.jaegertracing.internal.JaegerTracer;importio.jaegertracing.internal.samplers.ConstSampler;importio.opentracing.Span;importio.opentracing.util.GlobalTracer;...SamplerConfigurationsamplerConfig=SamplerConfiguration.fromEnv().withType(ConstSampler.TYPE).withParam(1);ReporterConfigurationreporterConfig=ReporterConfiguration.fromEnv().withLogSpans(true);Configurationconfig=newConfiguration("helloWorld").withSampler(samplerConfig).withReporter(reporterConfig);GlobalTracer.register(config.getTracer());...try(Spanparent=GlobalTracer.get().buildSpan("hello").start()){parent.setTag("parentSpan",true);parent.log("event","hello world!");try(Spanchild=GlobalTracer.get().buildSpan("child").asChildOf(parent).start()){child.setTag("childSpan",true);}}
Since OpenTracing doesn’t provide an implementation of the Tracer, we need to import the Jaeger packages — Jaeger is an OpenTracing tracer and trace analyzer.
The OpenTracing packages here are for the Span and Global Tracer API.
Since OpenTracing doesn’t have a first-class sampling API, Jaeger provides it.

OpenTracing’s
GlobalTracerprovides a singleton reference to a Tracer for a given process.
buildSpantakes a single argument, thenameof the span.
OpenTracing in Java supports try-with-resources pattern that automatically can finish a span when it goes out of scope. Automatic context management in the Java tracer is implicitly forming a parent-child relationship between these two spans.
As you can see, the API for OpenTracing is fairly small — too small, ironically enough. The thing that drove adoption of OpenTracing was also the thing that made it hard to use, in many ways. A common scenario for a new developer who had heard about distributed tracing was to discover the OpenTracing website and try to install an OpenTracing package for their language, only to find that it didn’t actually do anything. OpenTracing provided mock and no-op tracers in each language for the benefit of testing and validation, but there was no simple or easy way to “get started” without first understanding the design of the library. In addition, some of the tradeoffs made in the sake of simplicity turned out to be difficult for end-users to cope with. Implementors of the OpenTracing API would often add non-standard features that patched holes or added convenience for users, breaking some of the fundamental promises of vendor-neutrality. Finally, OpenTracing presented users with a tracing-only framework. There was no associated metrics API, for example, to allow for the recording of counters, gauges, or other common metric primitives. Users wanted more.
OpenCensus
In early 2018, Google released an open-source version of their internal Census project, naming it OpenCensus5. Census was designed under different circumstances, and with different constraints, than OpenTracing. The goal of the Census project was to provide a uniform method for instrumenting and capturing trace and metric data from Google services, automatically. The Census team built deep integrations into technologies such as gRPC, affording any developer that used these technologies to also recieve basic tracing and metrics for no additional work. The design of Census, thus, was extremely different than the thin API offered by OpenTracing. Census was an entire SDK for tracing and metrics, providing a full implementation in addition to the API, tightly coupled, and deeply entwined with gRPC for activities such as context propagation. Open-sourcing Census was in many ways an effort to extend the existing Google tracing infrastructure to external users of their services — since Google services such as Spanner were traced using Census, external requests that were also traced using Census could be connected seamlessly. In addition, the cost of maintaining a tracing and metrics framework and integrating it with a variety of tools and vendors can be extremely costly, making the economics of open sourcing the project a win for Google.
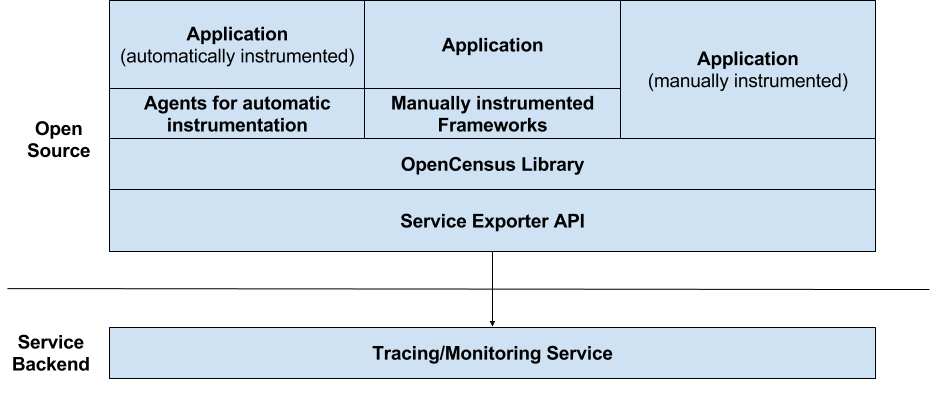
Figure 4-4. OpenCensus Ecosystem Design (https://github.com/census-instrumentation/opencensus-specs)
The fundamental design of OpenCensus differed significantly from OpenTracing, as seen in Figure 4-4. In addition to a tracing API, as mentioned, a metrics API was included. Context propagation could be handled automatically, thanks to all implementations using the same format for propagating trace context. It supported the automatic collection of traces and metrics from integrated frameworks, along with a local viewer for this data (called “zPages”), making it more immediately useful out of the box. Finally, rather than relying on runtime-swappable implementations of its API to capture and export data to a trace analyzer, it provided a pluggable exporter model that allowed it to upload data to almost any backend. As the design is different, so is the specification different — rather than focusing on a few primitive types, it defines several different components that build upon each other, as seen in Figure 4-5.
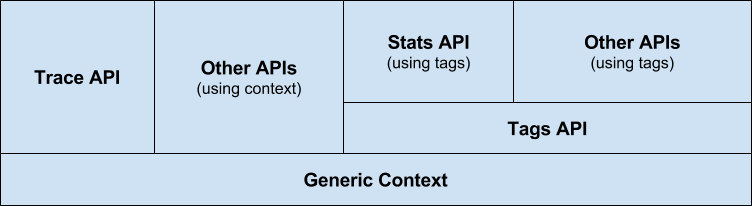
Figure 4-5. OpenCensus Library Design (https://github.com/census-instrumentation/opencensus-specs)
The OpenCensus libraries are built on a base of in-process context propagation. Where OpenTracing left this mechanism as an exercise to the implementor, OpenCensus required explicit or implicit propagation of sub-contexts inside a process. Where a language supported generic context existed (such as Golang’s context.Context), that implementation must be used. All other APIs are built on this generic context. The Tracing API is extremely similar, however, to the OpenTracing API insofar as the creation and construction of Span objects. The SDK provides a Tracer that spans can be started from (with a required name, as in OpenTracing), but the way you do this is different than in OpenTracing. OpenCensus allows for the creation of root spans and child spans — spans that do not, or do, have a parent. When creating a span, the span may be attached or detached from the underlying context. Unlike OpenTracing, there is no mechanism to modify the start or stop time of a span at creation or completion. There is also no explicit SpanContext object, instead, SpanID and TraceID are fields set on the span itself. OpenCensus additionally defines several unique fields such as Status and SpanKind, semantic fields that describe the operation status (OK, CANCELLED, PERMISSION_DENIED, and so forth) and its type (SERVER, CLIENT, or UNSPECIFIED). A full list of fields follows:
* SpanID
* TraceID
* ParentSpanID
* StartTime
* EndTime
* Status
* Link
* SpanKind
* TraceOptions
* Tracestate
* Time events (Annotations and Message Events)
Of note is the Time Events field, which represents a collection of events that ocurred during the lifetime of the span. Annotations contain both Attributes (key-value pairs) as well as a log message.
In addition to the Span API, OpenCensus provides an API to control sampling. Sampling is a process by which decisions are made about what spans to process (or export) from the process. Samplers can be configured on the global tracer, or set per-span. There are four provided samplers:
* Always (Always return true for a sampling decision.)
* Never (Always return false for a sampling decision.)
* Probabilistic (Random chance of returning true or false based on a rate, by default 1 in 10,000)
* RateLimiting (Attempts to sample at a given rate over a time window, default of 0.1 traces/second)
In addition to the Tracing and Context APIs, OpenCensus defines a Tags API. These are used by the Data Aggregation API (part of the stats package) in order to configure how data is aggregated and broken down in views. As the focus of this text is primarily on distributed tracing, we won’t dwell on this topic overly much other than to distinguish them from OpenTracing span tags. Other important differences are that OpenCensus deliberately elides many of the details about inter-process propagation from the spec, instead delegating it to specific propagator plugins (such as the "go.opencensus.io/plugin/ochttp/propagation/b3" package).
So, we’ve talked about how the tracing API is shaped, but what does it look like in practice? Here’s a Java sample:
importio.opencensus.trace.AttributeValue;importio.opencensus.common.Scope;importio.opencensus.trace.Span;importio.opencensus.trace.Status;importio.opencensus.exporter.trace.zipkin.ZipkinTraceExporter;importio.opencensus.trace.Tracer;importio.opencensus.trace.Tracing;importio.opencensus.trace.config.TraceConfig;importio.opencensus.trace.config.TraceParams;importio.opencensus.trace.samplers.Samplers;...ZipkinTraceExporter.createAndRegister("http://localhost:9411/api/v2/spans","tracing-to-zipkin-service");TraceConfigtraceConfig=Tracing.getTraceConfig();TraceParamsactiveTraceParams=traceConfig.getActiveTraceParams();traceConfig.updateActiveTraceParams(activeTraceParams.toBuilder().setSampler(Samplers.alwaysSample()).build());Tracertracer=Tracing.getTracer();try(Scopescope=tracer.spanBuilder("main").startScopedSpan()){System.out.println("About to do some busy work...");for(inti=0;i<10;i++){doWork(i);}}...privatestaticvoiddoWork(inti){Tracertracer=Tracing.getTracer();try(Scopescope=tracer.spanBuilder("doWork").startScopedSpan()){Spanspan=tracer.getCurrentSpan();try{System.out.println("doing busy work");Thread.sleep(100L);}catch(InterruptedExceptione){span.setStatus(Status.INTERNAL.withDescription(e.toString()));}Map<String,AttributeValue>attributes=newHashMap<String,AttributeValue>();attributes.put("use",AttributeValue.stringAttributeValue("demo"));span.addAnnotation("Invoking doWork",attributes);}}
OpenCensus handles the work of creating traces, so we only need to import an exporter to an analysis system.
In order to export traces to an analysis system, you ned to create and register the exporter. These options differ by analysis system.
Notice that the sampling process is handled by OpenCensus — we’ll still always sample in these test cases.
There’s no global tracer equivalent in OpenCensus (although some helper methods exist), so we need to grab a reference to a tracer.
Similar to OpenTracing, OpenCensus supports try-with-resources patterns to automatically manage span lifecycle.
This span is implicitly a child of the span in main, since it’s executed inside a scoped span.

Notice that annotations are roughly equivalent to OpenTracing logs, but with slightly different usage semantics.
As you can see, OpenCensus provides a batteries included experience that OpenTracing lacked. However, it’s this part of its design that made it unacceptable for some use cases. The inability to replace parts of the SDK with differing implementations, for example, meant that it couldn’t find purchase in certain vendor ecosystems. Bundling of metrics and tracing APIs together also proved a difficult pill to swallow for some implementors that desired to only use one part of the OpenCensus package, but not the other. Tight coupling between the API and SDK made integration challenging for third-party library authors, who didn’t necessarily want to have to ship the full SDK with their libraries. Ultimately, the biggest flaw was simply the fact that the open source telemetry community was split between two separate projects, rather that one single and unified effort.
While OpenTelemetry is the new, and current, standard for tracing instrumentation, it isn’t the only one. OpenTracing and OpenCensus may be found in production at many organizations, and will probably remain that way for the next couple of years. In addition, there are other technologies that you may encounter in the wild, other instrumentation libraries and propagation standards. We’ll briefly discuss three of the most popular ones in the next section.
Other Notable Formats and Projects
Distributed tracing isn’t a completely new concept, as indicated in earlier chapters. Very large scale distributed systems have created the need for some way to correlate and track a request across multiple processes or servers. With that in mind, we’d like to briefly discuss a few of the other popular systems you may see in the wild, and give you some resources on how to use them.
X-Ray
X-Ray is an Amazon Web Services product that provides distributed tracing for applications running in the AWS ecosystem. One advantage of X-Ray is its deep integration into the AWS client SDK, allowing for seamless tracing of calls to a variety of AWS managed services. In addition, X-Ray provides a suite of analytical tools for the trace data, such as a trace visualizer and a service map.
At a high level, X-Ray shares a lot in common with span-based tracing systems with a few differences in naming conventions. Rather than spans, X-Ray uses the term segment to refer to a unit of work being traced. Segments contain information about the resource running an application such as the hostname, request/response details, and any errors that occurred during operation. In addition, segments can have arbitrary annotations and metadata added by developers to assist in categorizing and analyzing them. In lieu of using individual spans to capture work done inside a single request, X-Ray introduces a concept known as the subsegment which act as detailed timing information about downstream calls, be they remote or internal. All segments for a single logical request are rolled up into a single trace, which you should be familiar with from earlier chapters. X-Ray uses a proprietary tracing header, X-Amzn-Trace-Id, which is propagated by the X-Ray SDK and all other AWS services. This single key contains all information about the trace, such as it’s root trace identifier, sampling decision, and parent segment (if applicable).
Functionally, X-Ray relies on a daemon process in conjunction with the X-Ray SDK to collect telemetry data. This daemon must be present or available to receive segment data from your services, which it can then forward to the X-Ray backend for trace assembly and display.
For more information on X-Ray, [see their developer documentation](https://docs.aws.amazon.com/xray/latest/devguide/aws-xray.html).
Zipkin
Zipkin was developed by Twitter and released to the wider open source community in 2012. It’s notable for being one of the first popular implementations of Dapper-style tracing that was released under an OSS license, and many of the conventions that are supported by the wider distributed tracing world owe a debt to Zipkin for popularizing them. Overall, Zipkin includes a trace analysis backend, a collector/daemon process, and client libraries and integrations with popular RPC and web frameworks.
Much of the terminology used in Zipkin is portable to other tracing systems, owing to their shared heritage from the Dapper paper. A span is a single unit of work, a trace is a collection of spans, and so forth. One of the most enduring parts of Zipkin is the popularisation of B3 HTTP Headers as a de-facto standard for passing trace context across the wire.
Note
Why are they called B3 Headers? The original internal name of Zipkin at Twitter was BigBrotherBird.
These headers are effectively superceded by the W3C TraceContext specification, but it’s likely that you’ll see them in the wild — especially since they’re supported by OpenTelemetry, as well. The collection of critical B3 headers are as follows:
-
X-B3-TraceId: 64 or 128 bit hex string. -
X-B3-SpanId: 64 bit hex string. -
X-B3-ParentSpanID: 64 bit hex string (header absent if there is no parent). -
X-B3-Sampled: Boolean of “1” or “0”, optional.
You can learn more about Zipkin at their [website](https://zipkin.io).
Interoperability and Migration Strategies
In a sufficiently large organization, one of the most challenging parts of distributed tracing can be getting everyone to agree on a single standard. The relative ease of integrating tracing into a team’s services has made it very attractive for SRE and DevOps practicioners to implement. This ease of integration, however, hasn’t necessarily translated into ease of maintainability. Over the past decade, distributed tracing has gone from a niche technology employed by a select group of large, modern software enterprises to a necessary component of modern microservice architectures. Part of this growth has involved changes in technology and tooling, with both proprietary and open source projects being announced, adopted, growing, and eventually being eclipsed by newer projects which start the whole cycle over again. To combat this, and be resilient in the face of future improvements and updates to the distributed tracing landscape, we need to develop ideas on how to maintain and upgrade distributed tracing systems.
The first thing you need to consider is if you’re looking for true interoperability between different tracing systems, or if you’re trying to migrate and standardize around a single new system. We’ll discuss the interop case first. In general, traces are most useful when they can combine the entirety of a single logical request as it moves through your entire system. However, sufficiently complex systems (or sufficiently bifurcated organizations) may not have a desire or ability to create the necessary conditions to trace requests through the entire call stack. However, just because that’s the case today, doesn’t mean it will be the case tomorrow, or the day after that. The primary obstacle to interoperability is usually a lack of information about the different systems used already, and more specifically, the method those systems use to propagate trace context. Your first step in achieving interoperability, then, should be to catalog the services that you’re aware of and note a few things about them:
-
If traced, the header format used for propagating trace context.
-
RPC Framework(s) they use to communicate with other services, and if those frameworks are transparently passing headers.
-
Existing tracing instrumentation libraries (Zipkin, X-Ray, OpenTracing, OpenCensus, etc.) that are direct or second-order dependencies.
-
Clients for other services, such as databases.
Documenting these tracing dependencies will allow you to easily understand what parts of your system can communicate with each other, and where you might see gaps in instrumentation (for instance, if you have a RPC framework that does not forward incoming headers, then you’d see a trace break at that point). With this information, you can begin to make other decisions, such as what trace context header format makes the most sense, for your environment. Even if you don’t have standard headers, there are approaches you can take in your instrumentation to support seamless context propagation. One popular method is to implement a propagator stack in your instrumentation library or RPC framework. This allows you to add new propagators while preserving support for existing ones. The following code sample illustrates creating this stack in OpenTracing.
publicfinalclassPropagatorStackimplementsPropagator{Formatformat;List<Propagator>propagators;publicPropagatorStack(Formatformat){if(format==null){thrownewIllegalArgumentException("Format cannot be null.");}this.format=format;propagators=newLinkedList<Propagator>();}publicFormatformat(){returnformat;}publicPropagatorStackpushPropagator(Propagatorpropagator){if(propagator==null){thrownewIllegalArgumentException("Propagator cannot be null.");}propagators.add(propagator);returnthis;}public<C>SpanContextextract(Ccarrier){for(inti=propagators.size()-1;i>=0;i--){SpanContextcontext=propagators.get(i).extract(carrier);if(context!=null){returncontext;}}returnnull;}public<C>voidinject(SpanContextcontext,Ccarrier){for(inti=0;i<propagators.size();i++){propagators.get(i).inject(context,carrier);}}}
One important thing to note is that the propagator stack will stop extracting the span context once it finds its first match, but will inject headers for all registered propagators. You could theoretically modify this behavior to return multiple extracted contexts if you had multiple independent tracers in a given service. Standardizing tracing headers from the top-down is usually the most successful strategy, however, rather than attempting to manage individual services and teams preferences.
When standardizing or migrating, the calculus changes somewhat. You may still find it useful to do much of the documentation work mentioned earlier, but in service of estimating the effort required to perform a migration. If your existing tracing system is largely homebrewed — perhaps it uses custom headers or trace/span identifier formats — then you’ll want to identify the amount of services that are traced by that system vs. the new one, and if you can create some sort of shim between your old code and the new code. Depending on the design of your existing tracing system, you may want to consider using OpenTelemetry as a standard API but rewrite parts of your library to meet its specification, plugging those components in in lieu of the reference SDK. If you’re already using OpenTracing or OpenCensus, and simply want to migrate to OpenTelemetry, then you have several options as well. Do you want to use the OpenTelemetry SDK in lieu of your existing OpenTracing tracer? Then, you’d need to use the OpenTelemetry bridge component to make it appear as an OpenTracing tracer to your existing instrumentation, and switch out the tracer in each of your services. A more gradual migration can be achieved by ensuring that you’re using compatible header formats (W3C, B3, or through a custom propagator) in your old and new instrumentation, then deploying new services with OpenTelemetry and leaving your old services as-is for now. As long as your trace analyzer supports ingesting traces from both frameworks, then you should see a single trace containing spans from both your old and new services. Another migration strategy, especially if you’re migrating to a new platform — for example, containerizing existing services in order to run them on Kubernetes — is to replace your existing tracing with a more black-box approach as a prelude to reinstrumenting the logic. By using the tracing features built into service meshes, for example, you can trace requests between your containerized services without replacing any existing instrumentation, or filling in any instrumentation gaps. Over time, you can extend the spans into the service code and rip out any existing instrumentation when its convenient, while getting the immediate benefit of seamless traces that extend across all of your newly containerized services.
Why Use Open Source Instrumentation?
Regardless of your strategy, the best way to ensure that your tracing system is maintainable and extensible is through the usage of open source standards and frameworks. Proprietary, or homebrewed, tracing systems are going to almost always be more difficult and costly to maintain than something with broad community support. To conclude this chapter, we’ll discuss some of the rationale behind preferring open source instrumentation, and why you should build your distributed tracing system on top of it.
Interoperability
When implementing any sort of distributed telemetry, interoperability is a prime concern. You may have two services, or two thousand, but unless there’s a way to guarantee that the telemetry data from any arbitrary service is compatible with the telemetry data from any other service, you’re gonna have a bad time when trying to understand performance across all of your services. Open Source Instrumentation addresses this by not only providing a single set of concepts and libraries for all of your services, but it also allows for telemetry capture that extends past the boundaries of your business logic.
The first case is the simpler one to understand — while it’s certainly possible to create your own request tracing system through correlation identifiers, this approach can be brittle and difficult to maintain as you scale. One of the benefits of open source solutions is that they make many of these decisions for you! You don’t have to sit down and decide if you want a UUID-based or a CUID-based correlation ID, for example. You can guarantee that each new service that’s being instrumented is speaking the “same language” when it comes to context ID generation and propagation. This also avoids frustrating migration strategies when you extend your traces out to new endpoints or frontends; You’re able to guarantee that identifiers for traces are consistently generated, allowing for seamless extension. Contrast this to more log-based approaches to tracing such as [Distributed Diagnostic Context](https://accu.org/index.php/journals/1870), which can work great… as long as your entire system is relatively homogenous. Extending these through a polyglot system can involve a lot of time massaging logs into the same format, and that’s before you get into the challenges of retention and indexing that log data.
The second case for the superior interoperability of OSS instrumentation is how it integrates into other OSS software and libraries. Projects such as OpenTelemetry, by virtue of being vendor-neutral, are attractive instrumentation options for other OSS projects that wish to provide telemetry data to their end users. You can look at OpenTracing as an example of this: the OpenTracing [registry](https://opentracing.io/registry) indexes hundreds of integrations and plugins that instrument other OSS projects, from database clients to distributed messaging queues to network libraries, and more. These integrations allow you to quickly get started instrumenting a new, or existing, service and ensure that instrumentation can be extended into your business logic.
Portability
As the observability space continues to mature, its inevitable that there will be a growing amount of projects and vendors who will provide you the ability to analyze distributed tracing data. With this in mind, it’s critical that your instrumentation be portable between different analysis systems. In short, you don’t want to have to rewrite your tracing code when you change the analysis tool you’re using to ingest that data.
OpenTelemetry is an excellent example of this in practice. Your service emits telemetry data to a collector running as an agent, and those agents are able to export to a variety of backends. This gives you the ability to write instrumentation once and have it work with no configuration changes in a variety of environments, and even send that telemetry to multiple endpoints simultaneously simply by changing the configuration of the collector. For example, you could run a local analysis tool and have a local agent collecting telemetry data during development — then, with no changes to the code, have that same telemetry data go to a commercial analysis backend.
Ecosystem and Implicit Visibility
To echo some points made earlier, the ecosystem of an open source community is going to be extremely valuable to your instrumentation journey. We won’t belabor the basic value proposition of open source software in this text, but suffice to say that many hands make light work.
Realistically, for as much as we (or anyone else) harp on it, writing instrumentation and other maintainability code isn’t seen as a priority outside of its immediate utility. When you’re writing a service, you’ll absolutely use as much logging as you can get away with in order to figure out why things aren’t working the way you expect them to, but how often do you go back in and delete “uneccessary” logging statements? I’d expect the answer would surprise you — more frequently than you think! It’s a natural tendency to think that the amount of telemetry we’re adding is “too much” because we tend to be very granular in the initial cycle of development. This also applies to modifying code as well; one of the quickest ways to understand the control flow of a program is to add some simple print statements in an if statement and see which gets output for a certain input. When debugging issues, we tend to create windows that look into the code at a specific, narrow, angle. Many of those windows remain, but they’re all too focused on specific problems that we already had to be much help in understanding overall performance.
So, how do we resolve these two ideas? On one hand, we want to build observable software. On the other, we’re not sure what we should care about observing and don’t do a great job of looking at the right thing, especially ahead of time. Open source instrumentation, again, helps address this tension. First, it provides a rich ecosystem of existing instrumentation that we can rely upon to trace the important things in our lower-level dependencies (such as RPC frameworks). This existing instrumentation is generally lightweight and easy to add to our service, and satisfies much of the boilerplate associated with distributed tracing. Second, it allows for implicit visibility into our requests through this ecosystem. If you’re using some sort of service mesh as part of your application, that service mesh is capaable of creating and extending traces between all of your services, giving you implicit visibility into your entire back-end system with no code overhead. If you start to combine this with other components, such as client-level tracing, RPC framework tracing, DB client tracing, and so forth, then you’ll gain implicit visibility into your entire application.
Exploiting the OSS ecosystem is an excellent strategy to quickly bootstrap useful information about your system. However, there’s more to distributed tracing than simply throwing a bunch of libraries at the problem and seeing what sticks — you’ll want to move from implicit, to explicit, visibility into your requests and call stack. You’ll want to create and use custom tags and attributes from your business logic in order to profile and understand what’s going on in your code and application. In the next chapter, we’ll talk about some of the best practices for instrumenting your services and how you can supercharge your telemetry.
1 For more information, see the next section of this chapter on OpenTracing and OpenCensus.
2 For more details on tracestate, see https://www.w3.org/TR/trace-context/#tracestate-field
3 See https://medium.com/opentracing/towards-turnkey-distributed-tracing-5f4297d1736
4 See https://tools.ietf.org/html/rfc7230#section-3.2.4 for details.
5 See https://opensource.googleblog.com/2018/01/opencensus.html