
Algorithm development is a critical component of problem solving using computers. A sequential algorithm is essentially a recipe or a sequence of basic steps for solving a given problem using a serial computer. Similarly, a parallel algorithm is a recipe that tells us how to solve a given problem using multiple processors. However, specifying a parallel algorithm involves more than just specifying the steps. At the very least, a parallel algorithm has the added dimension of concurrency and the algorithm designer must specify sets of steps that can be executed simultaneously. This is essential for obtaining any performance benefit from the use of a parallel computer. In practice, specifying a nontrivial parallel algorithm may include some or all of the following:
Identifying portions of the work that can be performed concurrently.
Mapping the concurrent pieces of work onto multiple processes running in parallel.
Distributing the input, output, and intermediate data associated with the program.
Managing accesses to data shared by multiple processors.
Synchronizing the processors at various stages of the parallel program execution.
Typically, there are several choices for each of the above steps, but usually, relatively few combinations of choices lead to a parallel algorithm that yields performance commensurate with the computational and storage resources employed to solve the problem. Often, different choices yield the best performance on different parallel architectures or under different parallel programming paradigms.
In this chapter, we methodically discuss the process of designing and implementing parallel algorithms. We shall assume that the onus of providing a complete description of a parallel algorithm or program lies on the programmer or the algorithm designer. Tools and compilers for automatic parallelization at the current state of the art seem to work well only for highly structured programs or portions of programs. Therefore, we do not consider these in this chapter or elsewhere in this book.
Dividing a computation into smaller computations and assigning them to different processors for parallel execution are the two key steps in the design of parallel algorithms. In this section, we present some basic terminology and introduce these two key steps in parallel algorithm design using matrix-vector multiplication and database query processing as examples.
The process of dividing a computation into smaller parts, some or all of which may potentially be executed in parallel, is called decomposition. Tasks are programmer-defined units of computation into which the main computation is subdivided by means of decomposition. Simultaneous execution of multiple tasks is the key to reducing the time required to solve the entire problem. Tasks can be of arbitrary size, but once defined, they are regarded as indivisible units of computation. The tasks into which a problem is decomposed may not all be of the same size.
Example 3.1 Dense matrix-vector multiplication
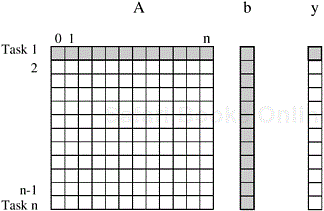
Consider the multiplication of a dense n × n matrix A with a vector b to yield another vector y. The ith element y[i] of the product vector is the dot-product of the ith row of A with the input vector b; i.e., ![]() . As shown later in Figure 3.1, the computation of each y[i] can be regarded as a task. Alternatively, as shown later in Figure 3.4, the computation could be decomposed into fewer, say four, tasks where each task computes roughly n/4 of the entries of the vector y. ▪
. As shown later in Figure 3.1, the computation of each y[i] can be regarded as a task. Alternatively, as shown later in Figure 3.4, the computation could be decomposed into fewer, say four, tasks where each task computes roughly n/4 of the entries of the vector y. ▪
Note that all tasks in Figure 3.1 are independent and can be performed all together or in any sequence. However, in general, some tasks may use data produced by other tasks and thus may need to wait for these tasks to finish execution. An abstraction used to express such dependencies among tasks and their relative order of execution is known as a task-dependency graph. A task-dependency graph is a directed acyclic graph in which the nodes represent tasks and the directed edges indicate the dependencies amongst them. The task corresponding to a node can be executed when all tasks connected to this node by incoming edges have completed. Note that task-dependency graphs can be disconnected and the edge-set of a task-dependency graph can be empty. This is the case for matrix-vector multiplication, where each task computes a subset of the entries of the product vector. To see a more interesting task-dependency graph, consider the following database query processing example.
Example 3.2 Database query processing
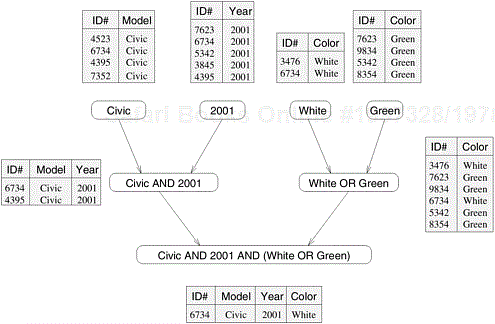
Table 3.1 shows a relational database of vehicles. Each row of the table is a record that contains data corresponding to a particular vehicle, such as its ID, model, year, color, etc. in various fields. Consider the computations performed in processing the following query:
MODEL=”Civic” AND YEAR=”2001” AND (COLOR=”Green” OR COLOR=”White”)
This query looks for all 2001 Civics whose color is either Green or White. On a relational database, this query is processed by creating a number of intermediate tables. One possible way is to first create the following four tables: a table containing all Civics, a table containing all 2001-model cars, a table containing all green-colored cars, and a table containing all white-colored cars. Next, the computation proceeds by combining these tables by computing their pairwise intersections or unions. In particular, it computes the intersection of the Civic-table with the 2001-model year table, to construct a table of all 2001-model Civics. Similarly, it computes the union of the green- and white-colored tables to compute a table storing all cars whose color is either green or white. Finally, it computes the intersection of the table containing all the 2001 Civics with the table containing all the green or white vehicles, and returns the desired list. ▪
Table 3.1. A database storing information about used vehicles.
|
ID# |
Model |
Year |
Color |
Dealer |
Price |
|---|---|---|---|---|---|
|
4523 |
Civic |
2002 |
Blue |
MN |
$18,000 |
|
3476 |
Corolla |
1999 |
White |
IL |
$15,000 |
|
7623 |
Camry |
2001 |
Green |
NY |
$21,000 |
|
9834 |
Prius |
2001 |
Green |
CA |
$18,000 |
|
6734 |
Civic |
2001 |
White |
OR |
$17,000 |
|
5342 |
Altima |
2001 |
Green |
FL |
$19,000 |
|
3845 |
Maxima |
2001 |
Blue |
NY |
$22,000 |
|
8354 |
Accord |
2000 |
Green |
VT |
$18,000 |
|
4395 |
Civic |
2001 |
Red |
CA |
$17,000 |
|
7352 |
Civic |
2002 |
Red |
WA |
$18,000 |
The various computations involved in processing the query in Example 3.2 can be visualized by the task-dependency graph shown in Figure 3.2. Each node in this figure is a task that corresponds to an intermediate table that needs to be computed and the arrows between nodes indicate dependencies between the tasks. For example, before we can compute the table that corresponds to the 2001 Civics, we must first compute the table of all the Civics and a table of all the 2001-model cars.
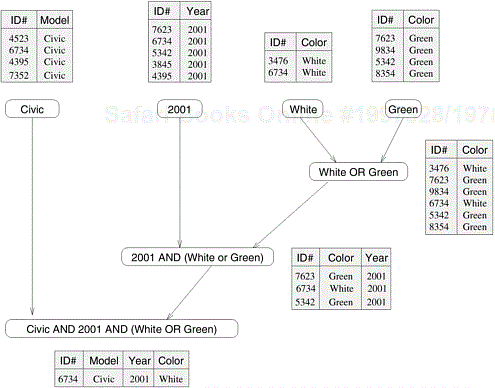
Note that often there are multiple ways of expressing certain computations, especially those involving associative operators such as addition, multiplication, and logical AND or OR. Different ways of arranging computations can lead to different task-dependency graphs with different characteristics. For instance, the database query in Example 3.2 can be solved by first computing a table of all green or white cars, then performing an intersection with a table of all 2001 model cars, and finally combining the results with the table of all Civics. This sequence of computation results in the task-dependency graph shown in Figure 3.3.
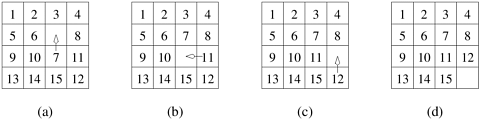
The number and size of tasks into which a problem is decomposed determines the granularity of the decomposition. A decomposition into a large number of small tasks is called fine-grained and a decomposition into a small number of large tasks is called coarse-grained. For example, the decomposition for matrix-vector multiplication shown in Figure 3.1 would usually be considered fine-grained because each of a large number of tasks performs a single dot-product. Figure 3.4 shows a coarse-grained decomposition of the same problem into four tasks, where each tasks computes n/4 of the entries of the output vector of length n.
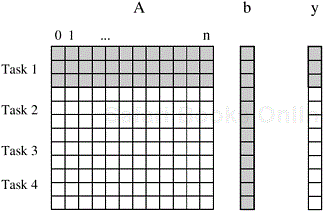
Figure 3.4. Decomposition of dense matrix-vector multiplication into four tasks. The portions of the matrix and the input and output vectors accessed by Task 1 are highlighted.
A concept related to granularity is that of degree of concurrency. The maximum number of tasks that can be executed simultaneously in a parallel program at any given time is known as its maximum degree of concurrency. In most cases, the maximum degree of concurrency is less than the total number of tasks due to dependencies among the tasks. For example, the maximum degree of concurrency in the task-graphs of Figures 3.2 and 3.3 is four. In these task-graphs, maximum concurrency is available right at the beginning when tables for Model, Year, Color Green, and Color White can be computed simultaneously. In general, for task-dependency graphs that are trees, the maximum degree of concurrency is always equal to the number of leaves in the tree.
A more useful indicator of a parallel program’s performance is the average degree of concurrency, which is the average number of tasks that can run concurrently over the entire duration of execution of the program.
Both the maximum and the average degrees of concurrency usually increase as the granularity of tasks becomes smaller (finer). For example, the decomposition of matrix-vector multiplication shown in Figure 3.1 has a fairly small granularity and a large degree of concurrency. The decomposition for the same problem shown in Figure 3.4 has a larger granularity and a smaller degree of concurrency.
The degree of concurrency also depends on the shape of the task-dependency graph and the same granularity, in general, does not guarantee the same degree of concurrency. For example, consider the two task graphs in Figure 3.5, which are abstractions of the task graphs of Figures 3.2 and 3.3, respectively (Problem 3.1). The number inside each node represents the amount of work required to complete the task corresponding to that node. The average degree of concurrency of the task graph in Figure 3.5(a) is 2.33 and that of the task graph in Figure 3.5(b) is 1.88 (Problem 3.1), although both task-dependency graphs are based on the same decomposition.
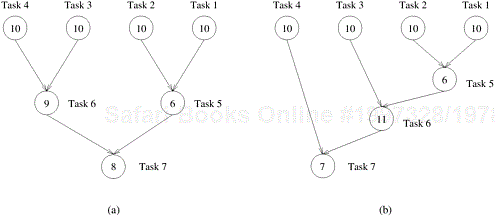
A feature of a task-dependency graph that determines the average degree of concurrency for a given granularity is its critical path. In a task-dependency graph, let us refer to the nodes with no incoming edges by start nodes and the nodes with no outgoing edges by finish nodes. The longest directed path between any pair of start and finish nodes is known as the critical path. The sum of the weights of nodes along this path is known as the critical path length, where the weight of a node is the size or the amount of work associated with the corresponding task. The ratio of the total amount of work to the critical-path length is the average degree of concurrency. Therefore, a shorter critical path favors a higher degree of concurrency. For example, the critical path length is 27 in the task-dependency graph shown in Figure 3.5(a) and is 34 in the task-dependency graph shown in Figure 3.5(b). Since the total amount of work required to solve the problems using the two decompositions is 63 and 64, respectively, the average degree of concurrency of the two task-dependency graphs is 2.33 and 1.88, respectively.
Although it may appear that the time required to solve a problem can be reduced simply by increasing the granularity of decomposition and utilizing the resulting concurrency to perform more and more tasks in parallel, this is not the case in most practical scenarios. Usually, there is an inherent bound on how fine-grained a decomposition a problem permits. For instance, there are n2 multiplications and additions in matrix-vector multiplication considered in Example 3.1 and the problem cannot be decomposed into more than O(n2) tasks even by using the most fine-grained decomposition.
Other than limited granularity and degree of concurrency, there is another important practical factor that limits our ability to obtain unbounded speedup (ratio of serial to parallel execution time) from parallelization. This factor is the interaction among tasks running on different physical processors. The tasks that a problem is decomposed into often share input, output, or intermediate data. The dependencies in a task-dependency graph usually result from the fact that the output of one task is the input for another. For example, in the database query example, tasks share intermediate data; the table generated by one task is often used by another task as input. Depending on the definition of the tasks and the parallel programming paradigm, there may be interactions among tasks that appear to be independent in a task-dependency graph. For example, in the decomposition for matrix-vector multiplication, although all tasks are independent, they all need access to the entire input vector b. Since originally there is only one copy of the vector b, tasks may have to send and receive messages for all of them to access the entire vector in the distributed-memory paradigm.
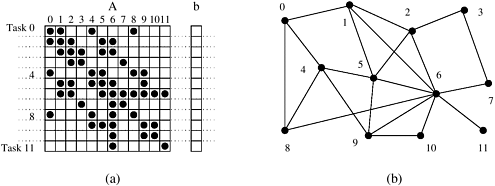
The pattern of interaction among tasks is captured by what is known as a task-interaction graph. The nodes in a task-interaction graph represent tasks and the edges connect tasks that interact with each other. The nodes and edges of a task-interaction graph can be assigned weights proportional to the amount of computation a task performs and the amount of interaction that occurs along an edge, if this information is known. The edges in a task-interaction graph are usually undirected, but directed edges can be used to indicate the direction of flow of data, if it is unidirectional. The edge-set of a task-interaction graph is usually a superset of the edge-set of the task-dependency graph. In the database query example discussed earlier, the task-interaction graph is the same as the task-dependency graph. We now give an example of a more interesting task-interaction graph that results from the problem of sparse matrix-vector multiplication.
Example 3.3 Sparse matrix-vector multiplication
Consider the problem of computing the product y = Ab of a sparse n × n matrix A with a dense n × 1 vector b. A matrix is considered sparse when a significant number of entries in it are zero and the locations of the non-zero entries do not conform to a predefined structure or pattern. Arithmetic operations involving sparse matrices can often be optimized significantly by avoiding computations involving the zeros. For instance, while computing the ith entry ![]() of the product vector, we need to compute the products A[i, j] × b[j] for only those values of j for which A[i, j] ≠ 0. For example, y[0] = A[0, 0].b[0] + A[0, 1].b[1] + A[0, 4].b[4] + A[0, 8].b[8].
of the product vector, we need to compute the products A[i, j] × b[j] for only those values of j for which A[i, j] ≠ 0. For example, y[0] = A[0, 0].b[0] + A[0, 1].b[1] + A[0, 4].b[4] + A[0, 8].b[8].
One possible way of decomposing this computation is to partition the output vector y and have each task compute an entry in it. Figure 3.6(a) illustrates this decomposition. In addition to assigning the computation of the element y[i] of the output vector to Task i, we also make it the “owner” of row A[i, ∗] of the matrix and the element b[i] of the input vector. Note that the computation of y[i] requires access to many elements of b that are owned by other tasks. So Task i must get these elements from the appropriate locations. In the message-passing paradigm, with the ownership of b[i],Task i also inherits the responsibility of sending b[i] to all the other tasks that need it for their computation. For example, Task 4 must send b[4] to Tasks 0, 5, 8, and 9 and must get b[0], b[5], b[8], and b[9] to perform its own computation. The resulting task-interaction graph is shown in Figure 3.6(b). ▪
Chapter 5 contains detailed quantitative analysis of overheads due to interaction and limited concurrency and their effect on the performance and scalability of parallel algorithm-architecture combinations. In this section, we have provided a basic introduction to these factors because they require important consideration in designing parallel algorithms.
The tasks, into which a problem is decomposed, run on physical processors. However, for reasons that we shall soon discuss, we will use the term process in this chapter to refer to a processing or computing agent that performs tasks. In this context, the term process does not adhere to the rigorous operating system definition of a process. Instead, it is an abstract entity that uses the code and data corresponding to a task to produce the output of that task within a finite amount of time after the task is activated by the parallel program. During this time, in addition to performing computations, a process may synchronize or communicate with other processes, if needed. In order to obtain any speedup over a sequential implementation, a parallel program must have several processes active simultaneously, working on different tasks. The mechanism by which tasks are assigned to processes for execution is called mapping. For example, four processes could be assigned the task of computing one submatrix of C each in the matrix-multiplication computation of Example 3.5.
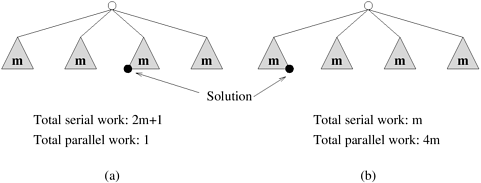
The task-dependency and task-interaction graphs that result from a choice of decomposition play an important role in the selection of a good mapping for a parallel algorithm. A good mapping should seek to maximize the use of concurrency by mapping independent tasks onto different processes, it should seek to minimize the total completion time by ensuring that processes are available to execute the tasks on the critical path as soon as such tasks become executable, and it should seek to minimize interaction among processes by mapping tasks with a high degree of mutual interaction onto the same process. In most nontrivial parallel algorithms, these tend to be conflicting goals. For instance, the most efficient decomposition-mapping combination is a single task mapped onto a single process. It wastes no time in idling or interacting, but achieves no speedup either. Finding a balance that optimizes the overall parallel performance is the key to a successful parallel algorithm. Therefore, mapping of tasks onto processes plays an important role in determining how efficient the resulting parallel algorithm is. Even though the degree of concurrency is determined by the decomposition, it is the mapping that determines how much of that concurrency is actually utilized, and how efficiently.
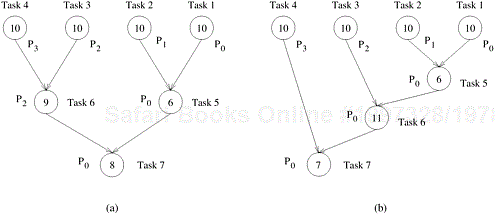
For example, Figure 3.7 shows efficient mappings for the decompositions and the task-interaction graphs of Figure 3.5 onto four processes. Note that, in this case, a maximum of four processes can be employed usefully, although the total number of tasks is seven. This is because the maximum degree of concurrency is only four. The last three tasks can be mapped arbitrarily among the processes to satisfy the constraints of the task-dependency graph. However, it makes more sense to map the tasks connected by an edge onto the same process because this prevents an inter-task interaction from becoming an inter-processes interaction. For example, in Figure 3.7(b), if Task 5 is mapped onto process P2, then both processes P0 and P1 will need to interact with P2. In the current mapping, only a single interaction between P0 and P1 suffices.
In the context of parallel algorithm design, processes are logical computing agents that perform tasks. Processors are the hardware units that physically perform computations. In this text, we choose to express parallel algorithms and programs in terms of processes. In most cases, when we refer to processes in the context of a parallel algorithm, there is a one-to-one correspondence between processes and processors and it is appropriate to assume that there are as many processes as the number of physical CPUs on the parallel computer. However, sometimes a higher level of abstraction may be required to express a parallel algorithm, especially if it is a complex algorithm with multiple stages or with different forms of parallelism.
Treating processes and processors separately is also useful when designing parallel programs for hardware that supports multiple programming paradigms. For instance, consider a parallel computer that consists of multiple computing nodes that communicate with each other via message passing. Now each of these nodes could be a shared-address-space module with multiple CPUs. Consider implementing matrix multiplication on such a parallel computer. The best way to design a parallel algorithm is to do so in two stages. First, develop a decomposition and mapping strategy suitable for the message-passing paradigm and use this to exploit parallelism among the nodes. Each task that the original matrix multiplication problem decomposes into is a matrix multiplication computation itself. The next step is to develop a decomposition and mapping strategy suitable for the shared-memory paradigm and use this to implement each task on the multiple CPUs of a node.
As mentioned earlier, one of the fundamental steps that we need to undertake to solve a problem in parallel is to split the computations to be performed into a set of tasks for concurrent execution defined by the task-dependency graph. In this section, we describe some commonly used decomposition techniques for achieving concurrency. This is not an exhaustive set of possible decomposition techniques. Also, a given decomposition is not always guaranteed to lead to the best parallel algorithm for a given problem. Despite these shortcomings, the decomposition techniques described in this section often provide a good starting point for many problems and one or a combination of these techniques can be used to obtain effective decompositions for a large variety of problems.
These techniques are broadly classified as recursive decomposition, data-decomposition, exploratory decomposition, and speculative decomposition. The recursive- and data-decomposition techniques are relatively general purpose as they can be used to decompose a wide variety of problems. On the other hand, speculative- and exploratory-decomposition techniques are more of a special purpose nature because they apply to specific classes of problems.
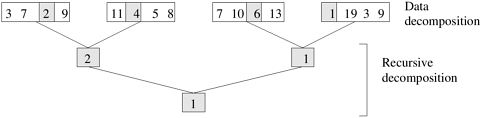
Recursive decomposition is a method for inducing concurrency in problems that can be solved using the divide-and-conquer strategy. In this technique, a problem is solved by first dividing it into a set of independent subproblems. Each one of these subproblems is solved by recursively applying a similar division into smaller subproblems followed by a combination of their results. The divide-and-conquer strategy results in natural concurrency, as different subproblems can be solved concurrently.
Example 3.4 Quicksort
Consider the problem of sorting a sequence A of n elements using the commonly used quicksort algorithm. Quicksort is a divide and conquer algorithm that starts by selecting a pivot element x and then partitions the sequence A into two subsequences A0 and A1 such that all the elements in A0 are smaller than x and all the elements in A1 are greater than or equal to x. This partitioning step forms the divide step of the algorithm. Each one of the subsequences A0 and A1 is sorted by recursively calling quicksort. Each one of these recursive calls further partitions the sequences. This is illustrated in Figure 3.8 for a sequence of 12 numbers. The recursion terminates when each subsequence contains only a single element. ▪
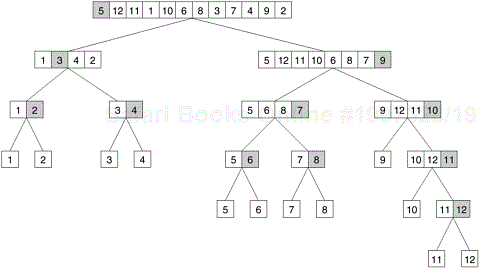
In Figure 3.8, we define a task as the work of partitioning a given subsequence. Therefore, Figure 3.8 also represents the task graph for the problem. Initially, there is only one sequence (i.e., the root of the tree), and we can use only a single process to partition it. The completion of the root task results in two subsequences (A0 and A1, corresponding to the two nodes at the first level of the tree) and each one can be partitioned in parallel. Similarly, the concurrency continues to increase as we move down the tree.
Sometimes, it is possible to restructure a computation to make it amenable to recursive decomposition even if the commonly used algorithm for the problem is not based on the divide-and-conquer strategy. For example, consider the problem of finding the minimum element in an unordered sequence A of n elements. The serial algorithm for solving this problem scans the entire sequence A, recording at each step the minimum element found so far as illustrated in Algorithm 3.1. It is easy to see that this serial algorithm exhibits no concurrency.
Example 3.1. A serial program for finding the minimum in an array of numbers A of length n.
1.   procedure SERIAL_MIN (A, n)
2.   begin
3.   min = A[0];
4.   for i := 1 to n − 1 do
5.       if (A[i] < min) min := A[i];
6.   endfor;
7.   return min;
8.   end SERIAL_MIN
Once we restructure this computation as a divide-and-conquer algorithm, we can use recursive decomposition to extract concurrency. Algorithm 3.2 is a divide-and-conquer algorithm for finding the minimum element in an array. In this algorithm, we split the sequence A into two subsequences, each of size n/2, and we find the minimum for each of these subsequences by performing a recursive call. Now the overall minimum element is found by selecting the minimum of these two subsequences. The recursion terminates when there is only one element left in each subsequence. Having restructured the serial computation in this manner, it is easy to construct a task-dependency graph for this problem. Figure 3.9 illustrates such a task-dependency graph for finding the minimum of eight numbers where each task is assigned the work of finding the minimum of two numbers.
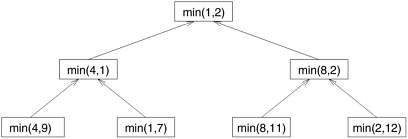
Figure 3.9. The task-dependency graph for finding the minimum number in the sequence {4, 9, 1, 7, 8, 11, 2, 12}. Each node in the tree represents the task of finding the minimum of a pair of numbers.
Example 3.2. A recursive program for finding the minimum in an array of numbers A of length n.
1.   procedure RECURSIVE_MIN (A, n)
2.   begin
3.   if (n = 1) then
4.       min := A[0];
5.   else
6.       lmin := RECURSIVE_MIN (A, n/2);
7.       rmin := RECURSIVE_MIN (&(A[n/2]), n − n/2);
8.       if (lmin < rmin) then
9.           min := lmin;
10.      else
11.          min := rmin;
12.      endelse;
13.  endelse;
14.  return min;
15.  end RECURSIVE_MIN
Data decomposition is a powerful and commonly used method for deriving concurrency in algorithms that operate on large data structures. In this method, the decomposition of computations is done in two steps. In the first step, the data on which the computations are performed is partitioned, and in the second step, this data partitioning is used to induce a partitioning of the computations into tasks. The operations that these tasks perform on different data partitions are usually similar (e.g., matrix multiplication introduced in Example 3.5) or are chosen from a small set of operations (e.g., LU factorization introduced in Example 3.10).
The partitioning of data can be performed in many possible ways as discussed next. In general, one must explore and evaluate all possible ways of partitioning the data and determine which one yields a natural and efficient computational decomposition.
Partitioning Output Data. In many computations, each element of the output can be computed independently of others as a function of the input. In such computations, a partitioning of the output data automatically induces a decomposition of the problems into tasks, where each task is assigned the work of computing a portion of the output. We introduce the problem of matrix-multiplication in Example 3.5 to illustrate a decomposition based on partitioning output data.
Example 3.5 Matrix multiplication
Consider the problem of multiplying two n × n matrices A and B to yield a matrix C. Figure 3.10 shows a decomposition of this problem into four tasks. Each matrix is considered to be composed of four blocks or submatrices defined by splitting each dimension of the matrix into half. The four submatrices of C, roughly of size n/2 × n/2 each, are then independently computed by four tasks as the sums of the appropriate products of submatrices of A and B. ▪
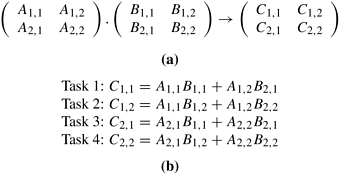
Most matrix algorithms, including matrix-vector and matrix-matrix multiplication, can be formulated in terms of block matrix operations. In such a formulation, the matrix is viewed as composed of blocks or submatrices and the scalar arithmetic operations on its elements are replaced by the equivalent matrix operations on the blocks. The results of the element and the block versions of the algorithm are mathematically equivalent (Problem 3.10). Block versions of matrix algorithms are often used to aid decomposition.
The decomposition shown in Figure 3.10 is based on partitioning the output matrix C into four submatrices and each of the four tasks computes one of these submatrices. The reader must note that data-decomposition is distinct from the decomposition of the computation into tasks. Although the two are often related and the former often aids the latter, a given data-decomposition does not result in a unique decomposition into tasks. For example, Figure 3.11 shows two other decompositions of matrix multiplication, each into eight tasks, corresponding to the same data-decomposition as used in Figure 3.10(a).
We now introduce another example to illustrate decompositions based on data partitioning. Example 3.6 describes the problem of computing the frequency of a set of itemsets in a transaction database, which can be decomposed based on the partitioning of output data.
Example 3.6 Computing frequencies of itemsets in a transaction database
Consider the problem of computing the frequency of a set of itemsets in a transaction database. In this problem we are given a set T containing n transactions and a set I containing m itemsets. Each transaction and itemset contains a small number of items, out of a possible set of items. For example, T could be a grocery stores database of customer sales with each transaction being an individual grocery list of a shopper and each itemset could be a group of items in the store. If the store desires to find out how many customers bought each of the designated groups of items, then it would need to find the number of times that each itemset in I appears in all the transactions; i.e., the number of transactions of which each itemset is a subset of. Figure 3.12(a) shows an example of this type of computation. The database shown in Figure 3.12 consists of 10 transactions, and we are interested in computing the frequency of the eight itemsets shown in the second column. The actual frequencies of these itemsets in the database, which are the output of the frequency-computing program, are shown in the third column. For instance, itemset {D, K} appears twice, once in the second and once in the ninth transaction. ▪
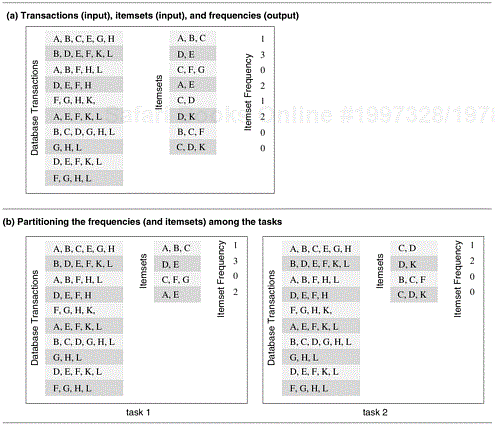
Figure 3.12(b) shows how the computation of frequencies of the itemsets can be decomposed into two tasks by partitioning the output into two parts and having each task compute its half of the frequencies. Note that, in the process, the itemsets input has also been partitioned, but the primary motivation for the decomposition of Figure 3.12(b) is to have each task independently compute the subset of frequencies assigned to it.
Partitioning Input Data. Partitioning of output data can be performed only if each output can be naturally computed as a function of the input. In many algorithms, it is not possible or desirable to partition the output data. For example, while finding the minimum, maximum, or the sum of a set of numbers, the output is a single unknown value. In a sorting algorithm, the individual elements of the output cannot be efficiently determined in isolation. In such cases, it is sometimes possible to partition the input data, and then use this partitioning to induce concurrency. A task is created for each partition of the input data and this task performs as much computation as possible using these local data. Note that the solutions to tasks induced by input partitions may not directly solve the original problem. In such cases, a follow-up computation is needed to combine the results. For example, while finding the sum of a sequence of N numbers using p processes (N > p), we can partition the input into p subsets of nearly equal sizes. Each task then computes the sum of the numbers in one of the subsets. Finally, the p partial results can be added up to yield the final result.
The problem of computing the frequency of a set of itemsets in a transaction database described in Example 3.6 can also be decomposed based on a partitioning of input data. Figure 3.13(a) shows a decomposition based on a partitioning of the input set of transactions. Each of the two tasks computes the frequencies of all the itemsets in its respective subset of transactions. The two sets of frequencies, which are the independent outputs of the two tasks, represent intermediate results. Combining the intermediate results by pairwise addition yields the final result.
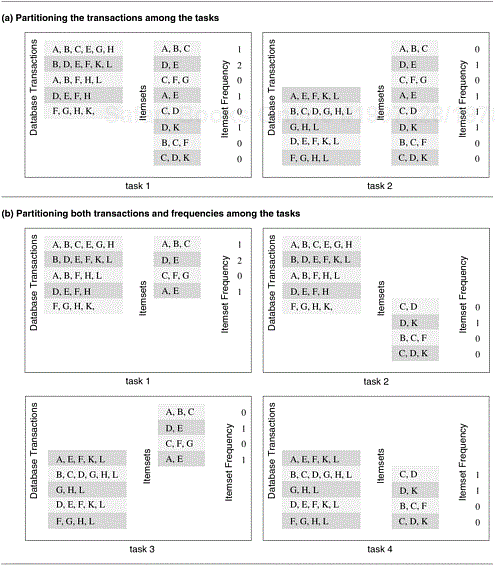
Partitioning both Input and Output Data. In some cases, in which it is possible to partition the output data, partitioning of input data can offer additional concurrency. For example, consider the 4-way decomposition shown in Figure 3.13(b) for computing itemset frequencies. Here, both the transaction set and the frequencies are divided into two parts and a different one of the four possible combinations is assigned to each of the four tasks. Each task then computes a local set of frequencies. Finally, the outputs of Tasks 1 and 3 are added together, as are the outputs of Tasks 2 and 4.
Partitioning Intermediate Data. Algorithms are often structured as multi-stage computations such that the output of one stage is the input to the subsequent stage. A decomposition of such an algorithm can be derived by partitioning the input or the output data of an intermediate stage of the algorithm. Partitioning intermediate data can sometimes lead to higher concurrency than partitioning input or output data. Often, the intermediate data are not generated explicitly in the serial algorithm for solving the problem and some restructuring of the original algorithm may be required to use intermediate data partitioning to induce a decomposition.
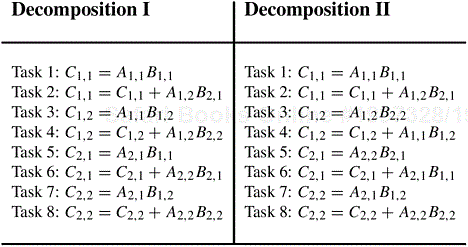
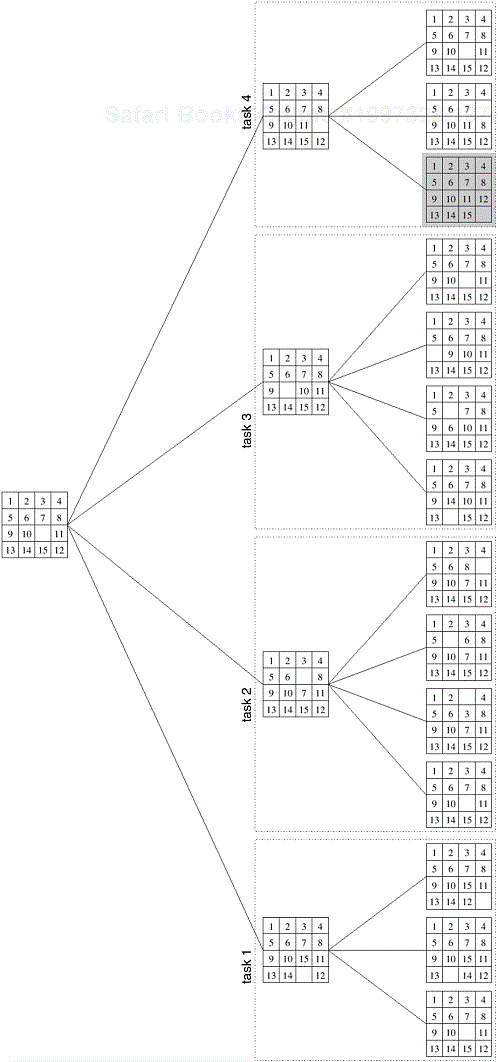
Let us revisit matrix multiplication to illustrate a decomposition based on partitioning intermediate data. Recall that the decompositions induced by a 2 × 2 partitioning of the output matrix C, as shown in Figures 3.10 and 3.11, have a maximum degree of concurrency of four. We can increase the degree of concurrency by introducing an intermediate stage in which eight tasks compute their respective product submatrices and store the results in a temporary three-dimensional matrix D, as shown in Figure 3.14. The submatrix Dk,i,j is the product of Ai,k and Bk,j.
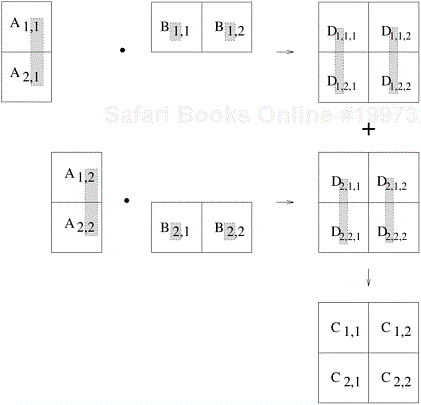
Figure 3.14. Multiplication of matrices A and B with partitioning of the three-dimensional intermediate matrix D.
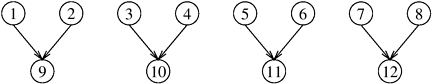
A partitioning of the intermediate matrix D induces a decomposition into eight tasks. Figure 3.15 shows this decomposition. After the multiplication phase, a relatively inexpensive matrix addition step can compute the result matrix C. All submatrices D∗,i,j with the same second and third dimensions i and j are added to yield Ci,j. The eight tasks numbered 1 through 8 in Figure 3.15 perform O(n3/8) work each in multiplying n/2 × n/2 submatrices of A and B. Then, four tasks numbered 9 through 12 spend O(n2/4) time each in adding the appropriate n/2 × n/2 submatrices of the intermediate matrix D to yield the final result matrix C. Figure 3.16 shows the task-dependency graph corresponding to the decomposition shown in Figure 3.15.
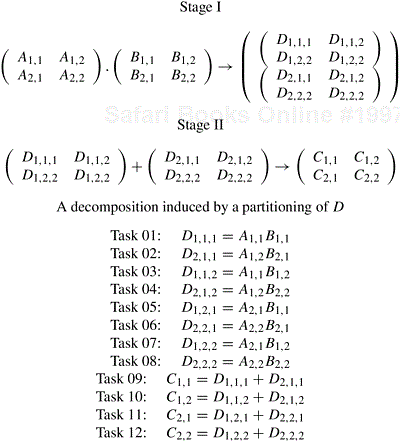
Figure 3.15. A decomposition of matrix multiplication based on partitioning the intermediate three-dimensional matrix.
Note that all elements of D are computed implicitly in the original decomposition shown in Figure 3.11, but are not explicitly stored. By restructuring the original algorithm and by explicitly storing D, we have been able to devise a decomposition with higher concurrency. This, however, has been achieved at the cost of extra aggregate memory usage.
The Owner-Computes Rule. A decomposition based on partitioning output or input data is also widely referred to as the owner-computes rule. The idea behind this rule is that each partition performs all the computations involving data that it owns. Depending on the nature of the data or the type of data-partitioning, the owner-computes rule may mean different things. For instance, when we assign partitions of the input data to tasks, then the owner-computes rule means that a task performs all the computations that can be done using these data. On the other hand, if we partition the output data, then the owner-computes rule means that a task computes all the data in the partition assigned to it.
Exploratory decomposition is used to decompose problems whose underlying computations correspond to a search of a space for solutions. In exploratory decomposition, we partition the search space into smaller parts, and search each one of these parts concurrently, until the desired solutions are found. For an example of exploratory decomposition, consider the 15-puzzle problem.
Example 3.7 The 15-puzzle problem
The 15-puzzle consists of 15 tiles numbered 1 through 15 and one blank tile placed in a 4 × 4 grid. A tile can be moved into the blank position from a position adjacent to it, thus creating a blank in the tile’s original position. Depending on the configuration of the grid, up to four moves are possible: up, down, left, and right. The initial and final configurations of the tiles are specified. The objective is to determine any sequence or a shortest sequence of moves that transforms the initial configuration to the final configuration. Figure 3.17 illustrates sample initial and final configurations and a sequence of moves leading from the initial configuration to the final configuration. ▪
The 15-puzzle is typically solved using tree-search techniques. Starting from the initial configuration, all possible successor configurations are generated. A configuration may have 2, 3, or 4 possible successor configurations, each corresponding to the occupation of the empty slot by one of its neighbors. The task of finding a path from initial to final configuration now translates to finding a path from one of these newly generated configurations to the final configuration. Since one of these newly generated configurations must be closer to the solution by one move (if a solution exists), we have made some progress towards finding the solution. The configuration space generated by the tree search is often referred to as a state space graph. Each node of the graph is a configuration and each edge of the graph connects configurations that can be reached from one another by a single move of a tile.
One method for solving this problem in parallel is as follows. First, a few levels of configurations starting from the initial configuration are generated serially until the search tree has a sufficient number of leaf nodes (i.e., configurations of the 15-puzzle). Now each node is assigned to a task to explore further until at least one of them finds a solution. As soon as one of the concurrent tasks finds a solution it can inform the others to terminate their searches. Figure 3.18 illustrates one such decomposition into four tasks in which task 4 finds the solution.
Note that even though exploratory decomposition may appear similar to data-decomposition (the search space can be thought of as being the data that get partitioned) it is fundamentally different in the following way. The tasks induced by data-decomposition are performed in their entirety and each task performs useful computations towards the solution of the problem. On the other hand, in exploratory decomposition, unfinished tasks can be terminated as soon as an overall solution is found. Hence, the portion of the search space searched (and the aggregate amount of work performed) by a parallel formulation can be very different from that searched by a serial algorithm. The work performed by the parallel formulation can be either smaller or greater than that performed by the serial algorithm. For example, consider a search space that has been partitioned into four concurrent tasks as shown in Figure 3.19. If the solution lies right at the beginning of the search space corresponding to task 3 (Figure 3.19(a)), then it will be found almost immediately by the parallel formulation. The serial algorithm would have found the solution only after performing work equivalent to searching the entire space corresponding to tasks 1 and 2. On the other hand, if the solution lies towards the end of the search space corresponding to task 1 (Figure 3.19(b)), then the parallel formulation will perform almost four times the work of the serial algorithm and will yield no speedup.
Speculative decomposition is used when a program may take one of many possible computationally significant branches depending on the output of other computations that precede it. In this situation, while one task is performing the computation whose output is used in deciding the next computation, other tasks can concurrently start the computations of the next stage. This scenario is similar to evaluating one or more of the branches of a switch statement in C in parallel before the input for the switch is available. While one task is performing the computation that will eventually resolve the switch, other tasks could pick up the multiple branches of the switch in parallel. When the input for the switch has finally been computed, the computation corresponding to the correct branch would be used while that corresponding to the other branches would be discarded. The parallel run time is smaller than the serial run time by the amount of time required to evaluate the condition on which the next task depends because this time is utilized to perform a useful computation for the next stage in parallel. However, this parallel formulation of a switch guarantees at least some wasteful computation. In order to minimize the wasted computation, a slightly different formulation of speculative decomposition could be used, especially in situations where one of the outcomes of the switch is more likely than the others. In this case, only the most promising branch is taken up a task in parallel with the preceding computation. In case the outcome of the switch is different from what was anticipated, the computation is rolled back and the correct branch of the switch is taken.
The speedup due to speculative decomposition can add up if there are multiple speculative stages. An example of an application in which speculative decomposition is useful is discrete event simulation. A detailed description of discrete event simulation is beyond the scope of this chapter; however, we give a simplified description of the problem.
Example 3.8 Parallel discrete event simulation
Consider the simulation of a system that is represented as a network or a directed graph. The nodes of this network represent components. Each component has an input buffer of jobs. The initial state of each component or node is idle. An idle component picks up a job from its input queue, if there is one, processes that job in some finite amount of time, and puts it in the input buffer of the components which are connected to it by outgoing edges. A component has to wait if the input buffer of one of its outgoing neighbors if full, until that neighbor picks up a job to create space in the buffer. There is a finite number of input job types. The output of a component (and hence the input to the components connected to it) and the time it takes to process a job is a function of the input job. The problem is to simulate the functioning of the network for a given sequence or a set of sequences of input jobs and compute the total completion time and possibly other aspects of system behavior. Figure 3.20 shows a simple network for a discrete event solution problem. ▪
The problem of simulating a sequence of input jobs on the network described in Example 3.8 appears inherently sequential because the input of a typical component is the output of another. However, we can define speculative tasks that start simulating a subpart of the network, each assuming one of several possible inputs to that stage. When an actual input to a certain stage becomes available (as a result of the completion of another selector task from a previous stage), then all or part of the work required to simulate this input would have already been finished if the speculation was correct, or the simulation of this stage is restarted with the most recent correct input if the speculation was incorrect.
Speculative decomposition is different from exploratory decomposition in the following way. In speculative decomposition, the input at a branch leading to multiple parallel tasks is unknown, whereas in exploratory decomposition, the output of the multiple tasks originating at a branch is unknown. In speculative decomposition, the serial algorithm would strictly perform only one of the tasks at a speculative stage because when it reaches the beginning of that stage, it knows exactly which branch to take. Therefore, by preemptively computing for multiple possibilities out of which only one materializes, a parallel program employing speculative decomposition performs more aggregate work than its serial counterpart. Even if only one of the possibilities is explored speculatively, the parallel algorithm may perform more or the same amount of work as the serial algorithm. On the other hand, in exploratory decomposition, the serial algorithm too may explore different alternatives one after the other, because the branch that may lead to the solution is not known beforehand. Therefore, the parallel program may perform more, less, or the same amount of aggregate work compared to the serial algorithm depending on the location of the solution in the search space.
So far we have discussed a number of decomposition methods that can be used to derive concurrent formulations of many algorithms. These decomposition techniques are not exclusive, and can often be combined together. Often, a computation is structured into multiple stages and it is sometimes necessary to apply different types of decomposition in different stages. For example, while finding the minimum of a large set of n numbers, a purely recursive decomposition may result in far more tasks than the number of processes, P, available. An efficient decomposition would partition the input into P roughly equal parts and have each task compute the minimum of the sequence assigned to it. The final result can be obtained by finding the minimum of the P intermediate results by using the recursive decomposition shown in Figure 3.21.
As another example of an application of hybrid decomposition, consider performing quicksort in parallel. In Example 3.4, we used a recursive decomposition to derive a concurrent formulation of quicksort. This formulation results in O(n) tasks for the problem of sorting a sequence of size n. But due to the dependencies among these tasks and due to uneven sizes of the tasks, the effective concurrency is quite limited. For example, the first task for splitting the input list into two parts takes O(n) time, which puts an upper limit on the performance gain possible via parallelization. But the step of splitting lists performed by tasks in parallel quicksort can also be decomposed using the input decomposition technique discussed in Section 9.4.1. The resulting hybrid decomposition that combines recursive decomposition and the input data-decomposition leads to a highly concurrent formulation of quicksort.
The various decomposition techniques described in the previous section allow us to identify the concurrency that is available in a problem and decompose it into tasks that can be executed in parallel. The next step in the process of designing a parallel algorithm is to take these tasks and assign (i.e., map) them onto the available processes. While devising a mapping scheme to construct a good parallel algorithm, we often take a cue from the decomposition. The nature of the tasks and the interactions among them has a bearing on the mapping. In this section, we shall discuss the various properties of tasks and inter-task interactions that affect the choice of a good mapping.
The following four characteristics of the tasks have a large influence on the suitability of a mapping scheme.
Task Generation. The tasks that constitute a parallel algorithm may be generated either statically or dynamically. Static task generation refers to the scenario where all the tasks are known before the algorithm starts execution. Data decomposition usually leads to static task generation. Examples of data-decomposition leading to a static task generation include matrix-multiplication and LU factorization (Problem 3.5). Recursive decomposition can also lead to a static task-dependency graph. Finding the minimum of a list of numbers (Figure 3.9) is an example of a static recursive task-dependency graph.
Certain decompositions lead to a dynamic task generation during the execution of the algorithm. In such decompositions, the actual tasks and the task-dependency graph are not explicitly available a priori, although the high level rules or guidelines governing task generation are known as a part of the algorithm. Recursive decomposition can lead to dynamic task generation. For example, consider the recursive decomposition in quicksort (Figure 3.8). The tasks are generated dynamically, and the size and shape of the task tree is determined by the values in the input array to be sorted. An array of the same size can lead to task-dependency graphs of different shapes and with a different total number of tasks.
Exploratory decomposition can be formulated to generate tasks either statically or dynamically. For example, consider the 15-puzzle problem discussed in Section 3.2.3. One way to generate a static task-dependency graph using exploratory decomposition is as follows. First, a preprocessing task starts with the initial configuration and expands the search tree in a breadth-first manner until a predefined number of configurations are generated. These configuration now represent independent tasks, which can be mapped onto different processes and run independently. A different decomposition that generates tasks dynamically would be one in which a task takes a state as input, expands it through a predefined number of steps of breadth-first search and spawns new tasks to perform the same computation on each of the resulting states (unless it has found the solution, in which case the algorithm terminates).
Task Sizes. The size of a task is the relative amount of time required to complete it. The complexity of mapping schemes often depends on whether or not the tasks are uniform; i.e., whether or not they require roughly the same amount of time. If the amount of time required by the tasks varies significantly, then they are said to be non-uniform. For example, the tasks in the decompositions for matrix multiplication shown in Figures 3.10 and 3.11 would be considered uniform. On the other hand, the tasks in quicksort in Figure 3.8 are non-uniform.
Knowledge of Task Sizes. The third characteristic that influences the choice of mapping scheme is knowledge of the task size. If the size of all the tasks is known, then this information can often be used in mapping of tasks to processes. For example, in the various decompositions for matrix multiplication discussed so far, the computation time for each task is known before the parallel program starts. On the other hand, the size of a typical task in the 15-puzzle problem is unknown. We do not know a priori how many moves will lead to the solution from a given state.
Size of Data Associated with Tasks. Another important characteristic of a task is the size of data associated with it. The reason this is an important consideration for mapping is that the data associated with a task must be available to the process performing that task, and the size and the location of these data may determine the process that can perform the task without incurring excessive data-movement overheads.
Different types of data associated with a task may have different sizes. For instance, the input data may be small but the output may be large, or vice versa. For example, the input to a task in the 15-puzzle problem may be just one state of the puzzle. This is a small input relative to the amount of computation that may be required to find a sequence of moves from this state to a solution state. In the problem of computing the minimum of a sequence, the size of the input is proportional to the amount of computation, but the output is just one number. In the parallel formulation of the quick sort, the size of both the input and the output data is of the same order as the sequential time needed to solve the task.
In any nontrivial parallel algorithm, tasks need to interact with each other to share data, work, or synchronization information. Different parallel algorithms require different types of interactions among concurrent tasks. The nature of these interactions makes them more suitable for certain programming paradigms and mapping schemes, and less suitable for others. The types of inter-task interactions can be described along different dimensions, each corresponding to a distinct characteristic of the underlying computations.
Static versus Dynamic. One way of classifying the type of interactions that take place among concurrent tasks is to consider whether or not these interactions have a static or dynamic pattern. An interaction pattern is static if for each task, the interactions happen at predetermined times, and if the set of tasks to interact with at these times is known prior to the execution of the algorithm. In other words, in a static interaction pattern, not only is the task-interaction graph known a priori, but the stage of the computation at which each interaction occurs is also known. An interaction pattern is dynamic if the timing of interactions or the set of tasks to interact with cannot be determined prior to the execution of the algorithm.
Static interactions can be programmed easily in the message-passing paradigm, but dynamic interactions are harder to program. The reason is that interactions in message-passing require active involvement of both interacting tasks – the sender and the receiver of information. The unpredictable nature of dynamic iterations makes it hard for both the sender and the receiver to participate in the interaction at the same time. Therefore, when implementing a parallel algorithm with dynamic interactions in the message-passing paradigm, the tasks must be assigned additional synchronization or polling responsibility. Shared-address space programming can code both types of interactions equally easily.
The decompositions for parallel matrix multiplication presented earlier in this chapter exhibit static inter-task interactions. For an example of dynamic interactions, consider solving the 15-puzzle problem in which tasks are assigned different states to explore after an initial step that generates the desirable number of states by applying breadth-first search on the initial state. It is possible that a certain state leads to all dead ends and a task exhausts its search space without reaching the goal state, while other tasks are still busy trying to find a solution. The task that has exhausted its work can pick up an unexplored state from the queue of another busy task and start exploring it. The interactions involved in such a transfer of work from one task to another are dynamic.
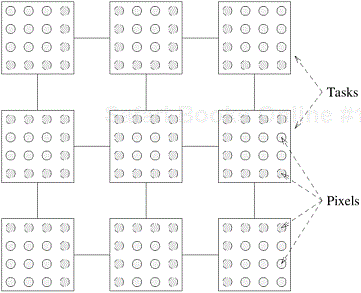
Regular versus Irregular. Another way of classifying the interactions is based upon their spatial structure. An interaction pattern is considered to be regular if it has some structure that can be exploited for efficient implementation. On the other hand, an interaction pattern is called irregular if no such regular pattern exists. Irregular and dynamic communications are harder to handle, particularly in the message-passing programming paradigm. An example of a decomposition with a regular interaction pattern is the problem of image dithering.
Example 3.9 Image dithering
In image dithering, the color of each pixel in the image is determined as the weighted average of its original value and the values of its neighboring pixels. We can easily decompose this computation, by breaking the image into square regions and using a different task to dither each one of these regions. Note that each task needs to access the pixel values of the region assigned to it as well as the values of the image surrounding its region. Thus, if we regard the tasks as nodes of a graph with an edge linking a pair of interacting tasks, the resulting pattern is a two-dimensional mesh, as shown in Figure 3.22. ▪
Sparse matrix-vector multiplication discussed in Section 3.1.2 provides a good example of irregular interaction, which is shown in Figure 3.6. In this decomposition, even though each task, by virtue of the decomposition, knows a priori which rows of matrix A it needs to access, without scanning the row(s) of A assigned to it, a task cannot know which entries of vector b it requires. The reason is that the access pattern for b depends on the structure of the sparse matrix A.
Read-only versus Read-Write. We have already learned that sharing of data among tasks leads to inter-task interaction. However, the type of sharing may impact the choice of the mapping. Data sharing interactions can be categorized as either read-only or read-write interactions. As the name suggests, in read-only interactions, tasks require only a read-access to the data shared among many concurrent tasks. For example, in the decomposition for parallel matrix multiplication shown in Figure 3.10, the tasks only need to read the shared input matrices A and B. In read-write interactions, multiple tasks need to read and write on some shared data. For example, consider the problem of solving the 15-puzzle. The parallel formulation method proposed in Section 3.2.3 uses an exhaustive search to find a solution. In this formulation, each state is considered an equally suitable candidate for further expansion. The search can be made more efficient if the states that appear to be closer to the solution are given a priority for further exploration. An alternative search technique known as heuristic search implements such a strategy. In heuristic search, we use a heuristic to provide a relative approximate indication of the distance of each state from the solution (i.e. the potential number of moves required to reach the solution). In the case of the 15-puzzle, the number of tiles that are out of place in a given state could serve as such a heuristic. The states that need to be expanded further are stored in a priority queue based on the value of this heuristic. While choosing the states to expand, we give preference to more promising states, i.e. the ones that have fewer out-of-place tiles and hence, are more likely to lead to a quick solution. In this situation, the priority queue constitutes shared data and tasks need both read and write access to it; they need to put the states resulting from an expansion into the queue and they need to pick up the next most promising state for the next expansion.
One-way versus Two-way. In some interactions, the data or work needed by a task or a subset of tasks is explicitly supplied by another task or subset of tasks. Such interactions are called two-way interactions and usually involve predefined producer and consumer tasks. In other interactions, only one of a pair of communicating tasks initiates the interaction and completes it without interrupting the other one. Such an interaction is called a one-way interaction. All read-only interactions can be formulated as one-way interactions. Read-write interactions can be either one-way or two-way.
The shared-address-space programming paradigms can handle both one-way and two-way interactions equally easily. However, one-way interactions cannot be directly programmed in the message-passing paradigm because the source of the data to be transferred must explicitly send the data to the recipient. In the message-passing paradigm, all one-way interactions must be converted to two-way interactions via program restructuring. Static one-way interactions can be easily converted to two-way communications. Since the time and the location in the program of a static one-way interaction is known a priori, introducing a matching interaction operation in the partner task is enough to convert a one-way static interaction to a two-way static interaction. On the other hand, dynamic one-way interactions can require some nontrivial program restructuring to be converted to two-way interactions. The most common such restructuring involves polling. Each task checks for pending requests from other tasks after regular intervals, and services such requests, if any.
Once a computation has been decomposed into tasks, these tasks are mapped onto processes with the objective that all tasks complete in the shortest amount of elapsed time. In order to achieve a small execution time, the overheads of executing the tasks in parallel must be minimized. For a given decomposition, there are two key sources of overhead. The time spent in inter-process interaction is one source of overhead. Another important source of overhead is the time that some processes may spend being idle. Some processes can be idle even before the overall computation is finished for a variety of reasons. Uneven load distribution may cause some processes to finish earlier than others. At times, all the unfinished tasks mapped onto a process may be waiting for tasks mapped onto other processes to finish in order to satisfy the constraints imposed by the task-dependency graph. Both interaction and idling are often a function of mapping. Therefore, a good mapping of tasks onto processes must strive to achieve the twin objectives of (1) reducing the amount of time processes spend in interacting with each other, and (2) reducing the total amount of time some processes are idle while the others are engaged in performing some tasks.
These two objectives often conflict with each other. For example, the objective of minimizing the interactions can be easily achieved by assigning sets of tasks that need to interact with each other onto the same process. In most cases, such a mapping will result in a highly unbalanced workload among the processes. In fact, following this strategy to the limit will often map all tasks onto a single process. As a result, the processes with a lighter load will be idle when those with a heavier load are trying to finish their tasks. Similarly, to balance the load among processes, it may be necessary to assign tasks that interact heavily to different processes. Due to the conflicts between these objectives, finding a good mapping is a nontrivial problem.
In this section, we will discuss various schemes for mapping tasks onto processes with the primary view of balancing the task workload of processes and minimizing their idle time. Reducing inter-process interaction is the topic of Section 3.5. The reader should be aware that assigning a balanced aggregate load of tasks to each process is a necessary but not sufficient condition for reducing process idling. Recall that the tasks resulting from a decomposition are not all ready for execution at the same time. A task-dependency graph determines which tasks can execute in parallel and which must wait for some others to
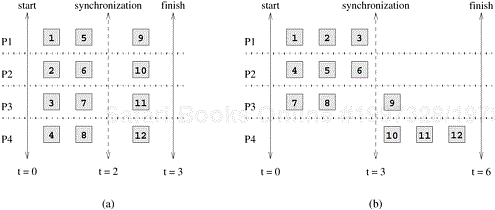
finish at a given stage in the execution of a parallel algorithm. Therefore, it is possible in a certain parallel formulation that although all processes perform the same aggregate amount of work, at different times, only a fraction of the processes are active while the remainder contain tasks that must wait for other tasks to finish. Similarly, poor synchronization among interacting tasks can lead to idling if one of the tasks has to wait to send or receive data from another task. A good mapping must ensure that the computations and interactions among processes at each stage of the execution of the parallel algorithm are well balanced. Figure 3.23 shows two mappings of 12-task decomposition in which the last four tasks can be started only after the first eight are finished due to dependencies among tasks. As the figure shows, two mappings, each with an overall balanced workload, can result in different completion times.
Mapping techniques used in parallel algorithms can be broadly classified into two categories: static and dynamic. The parallel programming paradigm and the characteristics of tasks and the interactions among them determine whether a static or a dynamic mapping is more suitable.
Static Mapping: Static mapping techniques distribute the tasks among processes prior to the execution of the algorithm. For statically generated tasks, either static or dynamic mapping can be used. The choice of a good mapping in this case depends on several factors, including the knowledge of task sizes, the size of data associated with tasks, the characteristics of inter-task interactions, and even the parallel programming paradigm. Even when task sizes are known, in general, the problem of obtaining an optimal mapping is an NP-complete problem for non-uniform tasks. However, for many practical cases, relatively inexpensive heuristics provide fairly acceptable approximate solutions to the optimal static mapping problem.
Algorithms that make use of static mapping are in general easier to design and program.
Dynamic Mapping: Dynamic mapping techniques distribute the work among processes during the execution of the algorithm. If tasks are generated dynamically, then they must be mapped dynamically too. If task sizes are unknown, then a static mapping can potentially lead to serious load-imbalances and dynamic mappings are usually more effective. If the amount of data associated with tasks is large relative to the computation, then a dynamic mapping may entail moving this data among processes. The cost of this data movement may outweigh some other advantages of dynamic mapping and may render a static mapping more suitable. However, in a shared-address-space paradigm, dynamic mapping may work well even with large data associated with tasks if the interaction is read-only. The reader should be aware that the shared-address-space programming paradigm does not automatically provide immunity against data-movement costs. If the underlying hardware is NUMA (Section 2.3.2), then the data may physically move from a distant memory. Even in a cc-UMA architecture, the data may have to move from one cache to another.
Algorithms that require dynamic mapping are usually more complicated, particularly in the message-passing programming paradigm.
Having discussed the guidelines for choosing between static and dynamic mappings, we now describe various schemes of these two types of mappings in detail.
Static mapping is often, though not exclusively, used in conjunction with a decomposition based on data partitioning. Static mapping is also used for mapping certain problems that are expressed naturally by a static task-dependency graph. In the following subsections, we will discuss mapping schemes based on data partitioning and task partitioning.
In this section, we will discuss mappings based on partitioning two of the most common ways of representing data in algorithms, namely, arrays and graphs. The data-partitioning actually induces a decomposition, but the partitioning or the decomposition is selected with the final mapping in mind.
Array Distribution Schemes. In a decomposition based on partitioning data, the tasks are closely associated with portions of data by the owner-computes rule. Therefore, mapping the relevant data onto the processes is equivalent to mapping tasks onto processes. We now study some commonly used techniques of distributing arrays or matrices among processes.
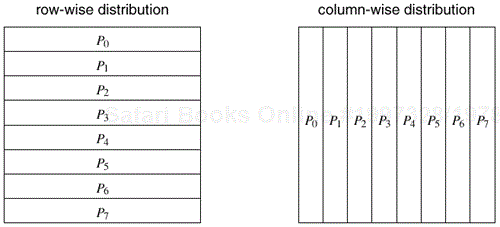
Block distributions are some of the simplest ways to distribute an array and assign uniform contiguous portions of the array to different processes. In these distributions, a d-dimensional array is distributed among the processes such that each process receives a contiguous block of array entries along a specified subset of array dimensions. Block distributions of arrays are particularly suitable when there is a locality of interaction, i.e., computation of an element of an array requires other nearby elements in the array.
For example, consider an n × n two-dimensional array A with n rows and n columns. We can now select one of these dimensions, e.g., the first dimension, and partition the array into p parts such that the kth part contains rows kn/p...(k + 1)n/p − 1, where 0 ≤ k < p. That is, each partition contains a block of n/p consecutive rows of A. Similarly, if we partition A along the second dimension, then each partition contains a block of n/p consecutive columns. These row- and column-wise array distributions are illustrated in Figure 3.24.
Similarly, instead of selecting a single dimension, we can select multiple dimensions to partition. For instance, in the case of array A we can select both dimensions and partition the matrix into blocks such that each block corresponds to a n/p1 × n/p2 section of the matrix, with p = p1 × p2 being the number of processes. Figure 3.25 illustrates two different two-dimensional distributions, on a 4 × 4 and 2× 8 process grid, respectively. In general, given a d-dimensional array, we can distribute it using up to a d-dimensional block distribution.
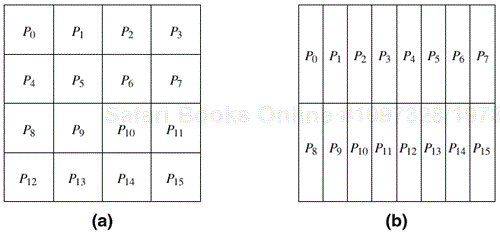
Figure 3.25. Examples of two-dimensional distributions of an array, (a) on a 4 × 4 process grid, and (b) on a 2 × 8 process grid.
Using these block distributions we can load-balance a variety of parallel computations that operate on multi-dimensional arrays. For example, consider the n × n matrix multiplication C = A × B , as discussed in Section 3.2.2. One way of decomposing this computation is to partition the output matrix C . Since each entry of C requires the same amount of computation, we can balance the computations by using either a one- or two-dimensional block distribution to partition C uniformly among the p available processes. In the first case, each process will get a block of n/p rows (or columns) of C, whereas in the second case, each process will get a block of size ![]() . In either case, the process will be responsible for computing the entries of the partition of C assigned to it.
. In either case, the process will be responsible for computing the entries of the partition of C assigned to it.
As the matrix-multiplication example illustrates, quite often we have the choice of mapping the computations using either a one- or a two-dimensional distribution (and even more choices in the case of higher dimensional arrays). In general, higher dimensional distributions allow us to use more processes. For example, in the case of matrix-matrix multiplication, a one-dimensional distribution will allow us to use up to n processes by assigning a single row of C to each process. On the other hand, a two-dimensional distribution will allow us to use up to n2 processes by assigning a single element of C to each process.
In addition to allowing a higher degree of concurrency, higher dimensional distributions also sometimes help in reducing the amount of interactions among the different processes for many problems. Figure 3.26 illustrates this in the case of dense matrix-multiplication. With a one-dimensional partitioning along the rows, each process needs to access the corresponding n/p rows of matrix A and the entire matrix B, as shown in Figure 3.26(a) for process P5. Thus the total amount of data that needs to be accessed is n2/p + n2. However, with a two-dimensional distribution, each process needs to access ![]() rows of matrix A and
rows of matrix A and ![]() columns of matrix B, as shown in Figure 3.26(b) for process P5. In the two-dimensional case, the total amount of shared data that each process needs to access is
columns of matrix B, as shown in Figure 3.26(b) for process P5. In the two-dimensional case, the total amount of shared data that each process needs to access is ![]() , which is significantly smaller compared to O(n2) shared data in the one-dimensional case.
, which is significantly smaller compared to O(n2) shared data in the one-dimensional case.
If the amount of work differs for different elements of a matrix, a block distribution can potentially lead to load imbalances. A classic example of this phenomenon is LU factorization of a matrix, in which the amount of computation increases from the top left to the bottom right of the matrix.
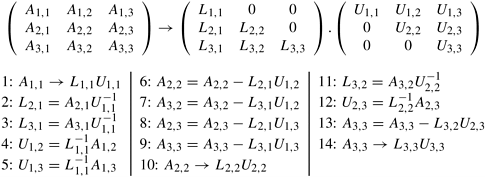
Example 3.10 Dense LU factorization
In its simplest form,the LU factorization algorithm factors a nonsingular square matrix A into the product of a lower triangular matrix L with a unit diagonal and an upper triangular matrix U. Algorithm 3.3 shows the serial algorithm. Let A be an n × n matrix with rows and columns numbered from 1 to n. The factorization process consists of n major steps – each consisting of an iteration of the outer loop starting at Line 3 in Algorithm 3.3. In step k, first, the partial column A[k + 1 : n, k] is divided by A[k, k]. Then, the outer product A[k + 1 : n, k] × A[k, k + 1 : n] is subtracted from the (n − k) × (n − k) submatrix A[k + 1 : n, k + 1 : n]. In a practical implementation of LU factorization, separate arrays are not used for L and U and A is modified to store L and U in its lower and upper triangular parts, respectively. The 1’s on the principal diagonal of L are implicit and the diagonal entries actually belong to U after factorization.
Example 3.3. A serial column-based algorithm to factor a nonsingular matrix A into a lower-triangular matrix L and an upper-triangular matrix U. Matrices L and U share space with A. On Line 9, A[i, j] on the left side of the assignment is equivalent to L [i, j] if i > j; otherwise, it is equivalent to U [i, j].
1.   procedure COL_LU (A)
2.   begin
3.      for k := 1 to n do
4.          for j := k to n do
5.              A[j, k]:= A[j, k]/A[k, k];
6.          endfor;
7.          for j := k + 1 to n do
8.              for i := k + 1 to n do
9.                  A[i, j] := A[i, j] − A[i, k] × A[k, j];
10.             endfor;
11.         endfor;
   /*
After this iteration, column A[k + 1 : n, k] is logically the kth
column of L and row A[k, k : n] is logically the kth row of U.
   */
12.     endfor;
13.  end COL_LU
Figure 3.27 shows a possible decomposition of LU factorization into 14 tasks using a 3 × 3 block partitioning of the matrix and using a block version of Algorithm 3.3. ▪
For each iteration of the outer loop k := 1 to n, the next nested loop in Algorithm 3.3 goes from k + 1 to n. In other words, the active part of the matrix, as shown in Figure 3.28, shrinks towards the bottom right corner of the matrix as the computation proceeds. Therefore, in a block distribution, the processes assigned to the beginning rows and columns (i.e., left rows and top columns) would perform far less work than those assigned to the later rows and columns. For example, consider the decomposition for LU factorization shown in Figure 3.27 with a 3 × 3 two-dimensional block partitioning of the matrix. If we map all tasks associated with a certain block onto a process in a 9-process ensemble, then a significant amount of idle time will result. First, computing different blocks of the matrix requires different amounts of work. This is illustrated in Figure 3.29. For example, computing the final value of A1,1 (which is actually L1,1 U1,1) requires only one task – Task 1. On the other hand, computing the final value of A3,3 requires three tasks – Task 9, Task 13, and Task 14. Secondly, the process working on a block may idle even when there are unfinished tasks associated with that block. This idling can occur if the constraints imposed by the task-dependency graph do not allow the remaining tasks on this process to proceed until one or more tasks mapped onto other processes are completed.
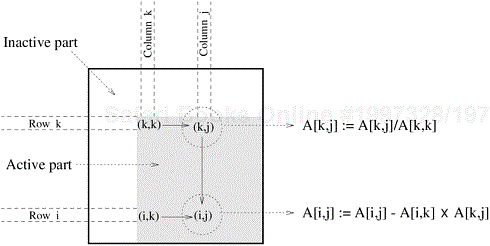
Figure 3.28. A typical computation in Gaussian elimination and the active part of the coefficient matrix during the kth iteration of the outer loop.
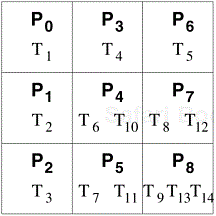
Figure 3.29. A naive mapping of LU factorization tasks onto processes based on a two-dimensional block distribution.
The block-cyclic distribution is a variation of the block distribution scheme that can be used to alleviate the load-imbalance and idling problems. A detailed description of LU factorization with block-cyclic mapping is covered in Chapter 8, where it is shown how a block-cyclic mapping leads to a substantially more balanced work distribution than in Figure 3.29. The central idea behind a block-cyclic distribution is to partition an array into many more blocks than the number of available processes. Then we assign the partitions (and the associated tasks) to processes in a round-robin manner so that each process gets several non-adjacent blocks. More precisely, in a one-dimensional block-cyclic distribution of a matrix among p processes, the rows (columns) of an n × n matrix are divided into αp groups of n/(αp) consecutive rows (columns), where 1 ≤ α ≤ n/p. Now, these blocks are distributed among the p processes in a wraparound fashion such that block bi is assigned to process Pi %p (‘%’ is the modulo operator). This distribution assigns α blocks of the matrix to each process, but each subsequent block that gets assigned to the same process is p blocks away. We can obtain a two-dimensional block-cyclic distribution of an n × n array by partitioning it into square blocks of size ![]() and distributing them on a hypothetical
and distributing them on a hypothetical ![]() array of processes in a wraparound fashion. Similarly, the block-cyclic distribution can be extended to arrays of higher dimensions. Figure 3.30 illustrates one- and two-dimensional block cyclic distributions of a two-dimensional array.
array of processes in a wraparound fashion. Similarly, the block-cyclic distribution can be extended to arrays of higher dimensions. Figure 3.30 illustrates one- and two-dimensional block cyclic distributions of a two-dimensional array.
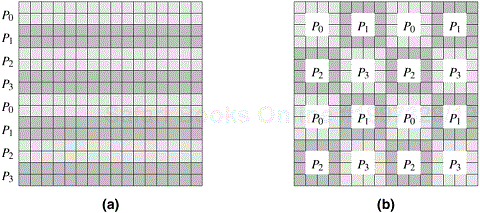
Figure 3.30. Examples of one- and two-dimensional block-cyclic distributions among four processes. (a) The rows of the array are grouped into blocks each consisting of two rows, resulting in eight blocks of rows. These blocks are distributed to four processes in a wraparound fashion. (b) The matrix is blocked into 16 blocks each of size 4 × 4, and it is mapped onto a 2 × 2 grid of processes in a wraparound fashion.
The reason why a block-cyclic distribution is able to significantly reduce the amount of idling is that all processes have a sampling of tasks from all parts of the matrix. As a result, even if different parts of the matrix require different amounts of work, the overall work on each process balances out. Also, since the tasks assigned to a process belong to different parts of the matrix, there is a good chance that at least some of them are ready for execution at any given time.
Note that if we increase α to its upper limit of n/p, then each block is a single row (column) of the matrix in a one-dimensional block-cyclic distribution and a single element of the matrix in a two-dimensional block-cyclic distribution. Such a distribution is known as a cyclic distribution. A cyclic distribution is an extreme case of a block-cyclic distribution and can result in an almost perfect load balance due to the extreme fine-grained underlying decomposition. However, since a process does not have any contiguous data to work on, the resulting lack of locality may result in serious performance penalties. Additionally, such a decomposition usually leads to a high degree of interaction relative to the amount computation in each task. The lower limit of 1 for the value of α results in maximum locality and interaction optimality, but the distribution degenerates to a block distribution. Therefore, an appropriate value of α must be used to strike a balance between interaction conservation and load balance.
As in the case of block-distributions, higher dimensional block-cyclic distributions are usually preferable as they tend to incur a lower volume of inter-task interaction.
A block-cyclic distribution may not always be able to balance computations when the distribution of work has some special patterns. For example, consider the sparse matrix shown in Figure 3.31(a) in which the shaded areas correspond to regions containing nonzero elements. If this matrix is distributed using a two-dimensional block-cyclic distribution, as illustrated in Figure 3.31(b), then we will end up assigning more non-zero blocks to the diagonal processes P0, P5, P10, and P15 than on any other processes. In fact some processes, like P12, will not get any work.
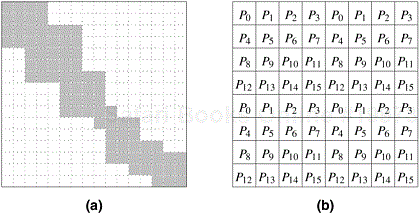
Figure 3.31. Using the block-cyclic distribution shown in (b) to distribute the computations performed in array (a) will lead to load imbalances.
Randomized block distribution, a more general form of the block distribution, can be used in situations illustrated in Figure 3.31. Just like a block-cyclic distribution, load balance is sought by partitioning the array into many more blocks than the number of available processes. However, the blocks are uniformly and randomly distributed among the processes. A one-dimensional randomized block distribution can be achieved as follows. A vector V of length αp (which is equal to the number of blocks) is used and V[j] is set to j for 0 ≤ j < αp. Now, V is randomly permuted, and process Pi is assigned the blocks stored in V[iα...(i + 1)α − 1]. Figure 3.32 illustrates this for p = 4 and α = 3. A two-dimensional randomized block distribution of an n × n array can be computed similarly by randomly permuting two vectors of length ![]() each and using them to choose the row and column indices of the blocks to be assigned to each process. As illustrated in Figure 3.33, the random block distribution is more effective in load balancing the computations performed in Figure 3.31.
each and using them to choose the row and column indices of the blocks to be assigned to each process. As illustrated in Figure 3.33, the random block distribution is more effective in load balancing the computations performed in Figure 3.31.
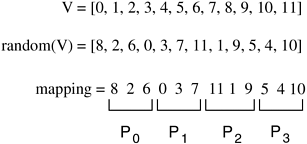
Figure 3.32. A one-dimensional randomized block mapping of 12 blocks onto four process (i.e., α = 3).
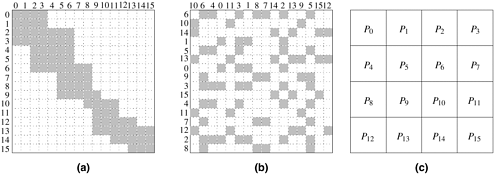
Figure 3.33. Using a two-dimensional random block distribution shown in (b) to distribute the computations performed in array (a), as shown in (c).
Graph Partitioning. The array-based distribution schemes that we described so far are quite effective in balancing the computations and minimizing the interactions for a wide range of algorithms that use dense matrices and have structured and regular interaction patterns. However, there are many algorithms that operate on sparse data structures and for which the pattern of interaction among data elements is data dependent and highly irregular. Numerical simulations of physical phenomena provide a large source of such type of computations. In these computations, the physical domain is discretized and represented by a mesh of elements. The simulation of the physical phenomenon being modeled then involves computing the values of certain physical quantities at each mesh point. The computation at a mesh point usually requires data corresponding to that mesh point and to the points that are adjacent to it in the mesh. For example, Figure 3.34 shows a mesh imposed on Lake Superior. The simulation of a physical phenomenon such the dispersion of a water contaminant in the lake would now involve computing the level of contamination at each vertex of this mesh at various intervals of time.
Since, in general, the amount of computation at each point is the same, the load can be easily balanced by simply assigning the same number of mesh points to each process. However, if a distribution of the mesh points to processes does not strive to keep nearby mesh points together, then it may lead to high interaction overheads due to excessive data sharing. For example, if each process receives a random set of points as illustrated in Figure 3.35, then each process will need to access a large set of points belonging to other processes to complete computations for its assigned portion of the mesh.
Ideally, we would like to distribute the mesh points in a way that balances the load and at the same time minimizes the amount of data that each process needs to access in order to complete its computations. Therefore, we need to partition the mesh into p parts such that each part contains roughly the same number of mesh-points or vertices, and the number of edges that cross partition boundaries (i.e., those edges that connect points belonging to two different partitions) is minimized. Finding an exact optimal partition is an NP-complete problem. However, algorithms that employ powerful heuristics are available to compute reasonable partitions. After partitioning the mesh in this manner, each one of these p partitions is assigned to one of the p processes. As a result, each process is assigned a contiguous region of the mesh such that the total number of mesh points that needs to be accessed across partition boundaries is minimized. Figure 3.36 shows a good partitioning of the Lake Superior mesh – the kind that a typical graph partitioning software would generate.
A mapping based on partitioning a task-dependency graph and mapping its nodes onto processes can be used when the computation is naturally expressible in the form of a static task-dependency graph with tasks of known sizes. As usual, this mapping must seek to achieve the often conflicting objectives of minimizing idle time and minimizing the interaction time of the parallel algorithm. Determining an optimal mapping for a general task-dependency graph is an NP-complete problem. However, specific situations often lend themselves to a simpler optimal or acceptable approximate solution.
As a simple example of a mapping based on task partitioning, consider a task-dependency graph that is a perfect binary tree. Such a task-dependency graph can occur in practical problems with recursive decomposition, such as the decomposition for finding the minimum of a list of numbers (Figure 3.9). Figure 3.37 shows a mapping of this task-dependency graph onto eight processes. It is easy to see that this mapping minimizes the interaction overhead by mapping many interdependent tasks onto the same process (i.e., the tasks along a straight branch of the tree) and others on processes only one communication link away from each other. Although there is some inevitable idling (e.g., when process 0 works on the root task, all other processes are idle), this idling is inherent in the task-dependency graph. The mapping shown in Figure 3.37 does not introduce any further idling and all tasks that are permitted to be concurrently active by the task-dependency graph are mapped onto different processes for parallel execution.
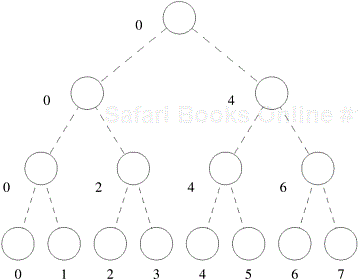
For some problems, an approximate solution to the problem of finding a good mapping can be obtained by partitioning the task-interaction graph. In the problem of modeling contaminant dispersion in Lake Superior discussed earlier in the context of data partitioning, we can define tasks such that each one of them is responsible for the computations associated with a certain mesh point. Now the mesh used to discretize the lake also acts as a task-interaction graph. Therefore, for this problem, using graph-partitioning to find a good mapping can also be viewed as task partitioning.
Another similar problem where task partitioning is applicable is that of sparse matrix-vector multiplication discussed in Section 3.1.2. A simple mapping of the task-interaction graph of Figure 3.6 is shown in Figure 3.38. This mapping assigns tasks corresponding to four consecutive entries of b to each process. Figure 3.39 shows another partitioning for the task-interaction graph of the sparse matrix vector multiplication problem shown in Figure 3.6 for three processes. The list Ci contains the indices of b that the tasks on Process i need to access from tasks mapped onto other processes. A quick comparison of the lists C0, C1, and C2 in the two cases readily reveals that the mapping based on partitioning the task interaction graph entails fewer exchanges of elements of b between processes than the naive mapping.
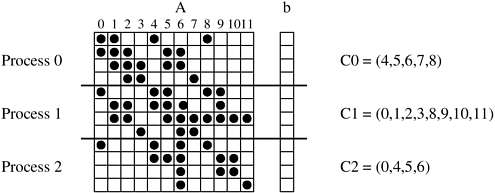
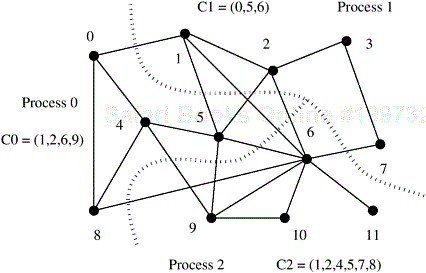
Certain algorithms are naturally expressed as task-dependency graphs; however, a mapping based solely on the task-dependency graph may suffer from load-imbalance or inadequate concurrency. For example, in the binary-tree task-dependency graph of Figure 3.37, only a few tasks are available for concurrent execution in the top part of the tree. If the tasks are large enough, then a better mapping can be obtained by a further decomposition of the tasks into smaller subtasks. In the case where the task-dependency graph is a binary tree with four levels, the root task can be partitioned among eight processes, the tasks at the next level can be partitioned among four processes each, followed by tasks partitioned among two processes each at the next level. The eight leaf tasks can have a one-to-one mapping onto the processes. Figure 3.40 illustrates such a hierarchical mapping. Parallel quicksort introduced in Example 3.4 has a task-dependency graph similar to the one shown in Figure 3.37, and hence is an ideal candidate for a hierarchical mapping of the type shown in Figure 3.40.
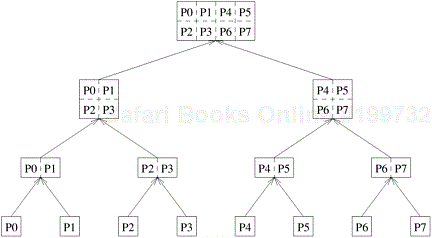
Figure 3.40. An example of hierarchical mapping of a task-dependency graph. Each node represented by an array is a supertask. The partitioning of the arrays represents subtasks, which are mapped onto eight processes.
An important practical problem to which the hierarchical mapping example discussed above applies directly is that of sparse matrix factorization. The high-level computations in sparse matrix factorization are guided by a task-dependency graph which is known as an elimination graph (elimination tree if the matrix is symmetric). However, the tasks in the elimination graph (especially the ones closer to the root) usually involve substantial computations and are further decomposed into subtasks using data-decomposition. A hierarchical mapping, using task partitioning at the top layer and array partitioning at the bottom layer, is then applied to this hybrid decomposition. In general, a hierarchical mapping can have many layers and different decomposition and mapping techniques may be suitable for different layers.
Dynamic mapping is necessary in situations where a static mapping may result in a highly imbalanced distribution of work among processes or where the task-dependency graph itself if dynamic, thus precluding a static mapping. Since the primary reason for using a dynamic mapping is balancing the workload among processes, dynamic mapping is often referred to as dynamic load-balancing. Dynamic mapping techniques are usually classified as either centralized or distributed.
In a centralized dynamic load balancing scheme, all executable tasks are maintained in a common central data structure or they are maintained by a special process or a subset of processes. If a special process is designated to manage the pool of available tasks, then it is often referred to as the master and the other processes that depend on the master to obtain work are referred to as slaves. Whenever a process has no work, it takes a portion of available work from the central data structure or the master process. Whenever a new task is generated, it is added to this centralized data structure or reported to the master process. Centralized load-balancing schemes are usually easier to implement than distributed schemes, but may have limited scalability. As more and more processes are used, the large number of accesses to the common data structure or the master process tends to become a bottleneck.
As an example of a scenario where centralized mapping may be applicable, consider the problem of sorting the entries in each row of an n × n matrix A. Serially, this can be accomplished by the following simple program segment:
1   for (i=1; i<n; i++)
2     sort(A[i],n);
Recall that the time to sort an array using some of the commonly used sorting algorithms, such as quicksort, can vary significantly depending on the initial order of the elements to be sorted. Therefore, each iteration of the loop in the program shown above can take different amounts of time. A naive mapping of the task of sorting an equal number of rows to each process may lead to load-imbalance. A possible solution to the potential load-imbalance problem in this case would be to maintain a central pool of indices of the rows that have yet to be sorted. Whenever a process is idle, it picks up an available index, deletes it, and sorts the row with that index, as long as the pool of indices is not empty. This method of scheduling the independent iterations of a loop among parallel processes is known as self scheduling.
The assignment of a single task to a process at a time is quite effective in balancing the computation; however, it may lead to bottlenecks in accessing the shared work queue, especially if each task (i.e., each loop iteration in this case) does not require a large enough amount of computation. If the average size of each task is M, and it takes Δ time to assign work to a process, then at most M/Δ processes can be kept busy effectively. The bottleneck can be eased by getting more than one task at a time. In chunk scheduling, every time a process runs out of work it gets a group of tasks. The potential problem with such a scheme is that it may lead to load-imbalances if the number of tasks (i.e., chunk) assigned in a single step is large. The danger of load-imbalance due to large chunk sizes can be reduced by decreasing the chunk-size as the program progresses. That is, initially the chunk size is large, but as the number of iterations left to be executed decreases, the chunk size also decreases. A variety of schemes have been developed for gradually adjusting the chunk size, that decrease the chunk size either linearly or non-linearly.
In a distributed dynamic load balancing scheme, the set of executable tasks are distributed among processes which exchange tasks at run time to balance work. Each process can send work to or receive work from any other process. These methods do not suffer from the bottleneck associated with the centralized schemes. Some of the critical parameters of a distributed load balancing scheme are as follows:
How are the sending and receiving processes paired together?
Is the work transfer initiated by the sender or the receiver?
How much work is transferred in each exchange? If too little work is transferred, then the receiver may not receive enough work and frequent transfers resulting in excessive interaction may be required. If too much work is transferred, then the sender may be out of work soon, again resulting in frequent transfers.
When is the work transfer performed? For example, in receiver initiated load balancing, work may be requested when the process has actually run out of work or when the receiver has too little work left and anticipates being out of work soon.
A detailed study of each of these parameters is beyond the scope of this chapter. These load balancing schemes will be revisited in the context of parallel algorithms to which they apply when we discuss these algorithms in the later chapters – in particular, Chapter 11 in the context of parallel search algorithms.
Note that, in principle, both centralized and distributed mapping schemes can be implemented in both message-passing and shared-address-space paradigms. However, by its very nature any dynamic load balancing scheme requires movement of tasks from one process to another. Hence, for such schemes to be effective on message-passing computers, the size of the tasks in terms of computation should be much higher than the size of the data associated with the tasks. In a shared-address-space paradigm, the tasks don’t need to be moved explicitly, although there is some implied movement of data to local caches or memory banks of processes. In general, the computational granularity of tasks to be moved can be much smaller on shared-address architecture than on message-passing architectures.
As noted earlier, reducing the interaction overhead among concurrent tasks is important for an efficient parallel program. The overhead that a parallel program incurs due to interaction among its processes depends on many factors, such as the volume of data exchanged during interactions, the frequency of interaction, the spatial and temporal pattern of interactions, etc.
In this section, we will discuss some general techniques that can be used to reduce the interaction overheads incurred by parallel programs. These techniques manipulate one or more of the three factors above in order to reduce the interaction overhead. Some of these are applicable while devising the decomposition and mapping schemes for the algorithms and some are applicable while programming the algorithm in a given paradigm. All techniques may not be applicable in all parallel programming paradigms and some of them may require support from the underlying hardware.
In most nontrivial parallel programs, the tasks executed by different processes require access to some common data. For example, in sparse matrix-vector multiplication y = Ab, in which tasks correspond to computing individual elements of vector y (Figure 3.6), all elements of the input vector b need to be accessed by multiple tasks. In addition to sharing the original input data, interaction may result if processes require data generated by other processes. The interaction overheads can be reduced by using techniques that promote the use of local data or data that have been recently fetched. Data locality enhancing techniques encompass a wide range of schemes that try to minimize the volume of nonlocal data that are accessed, maximize the reuse of recently accessed data, and minimize the frequency of accesses. In many cases, these schemes are similar in nature to the data reuse optimizations often performed in modern cache based microprocessors.
Minimize Volume of Data-Exchange. A fundamental technique for reducing the interaction overhead is to minimize the overall volume of shared data that needs to be accessed by concurrent processes. This is akin to maximizing the temporal data locality, i.e., making as many of the consecutive references to the same data as possible. Clearly, performing as much of the computation as possible using locally available data obviates the need for bringing in more data into local memory or cache for a process to perform its tasks. As discussed previously, one way of achieving this is by using appropriate decomposition and mapping schemes. For example, in the case of matrix multiplication, we saw that by using a two-dimensional mapping of the computations to the processes we were able to reduce the amount of shared data (i.e., matrices A and B) that needs to be accessed by each task to ![]() as opposed to n2/p + n2 required by a one-dimensional mapping (Figure 3.26). In general, using higher dimensional distribution often helps in reducing the volume of nonlocal data that needs to be accessed.
as opposed to n2/p + n2 required by a one-dimensional mapping (Figure 3.26). In general, using higher dimensional distribution often helps in reducing the volume of nonlocal data that needs to be accessed.
Another way of decreasing the amount of shared data that are accessed by multiple processes is to use local data to store intermediate results, and perform the shared data access to only place the final results of the computation. For example, consider computing the dot product of two vectors of length n in parallel such that each of the p tasks multiplies n/p pairs of elements. Rather than adding each individual product of a pair of numbers to the final result, each task can first create a partial dot product of its assigned portion of the vectors of length n/p in its own local location, and only access the final shared location once to add this partial result. This will reduce the number of accesses to the shared location where the result is stored to p from n.
Minimize Frequency of Interactions. Minimizing interaction frequency is important in reducing the interaction overheads in parallel programs because there is a relatively high startup cost associated with each interaction on many architectures. Interaction frequency can be reduced by restructuring the algorithm such that shared data are accessed and used in large pieces. Thus, by amortizing the startup cost over large accesses, we can reduce the overall interaction overhead, even if such restructuring does not necessarily reduce the overall volume of shared data that need to be accessed. This is akin to increasing the spatial locality of data access, i.e., ensuring the proximity of consecutively accessed data locations. On a shared-address-space architecture, each time a word is accessed, an entire cache line containing many words is fetched. If the program is structured to have spatial locality, then fewer cache lines are accessed. On a message-passing system, spatial locality leads to fewer message-transfers over the network because each message can transfer larger amounts of useful data. The number of messages can sometimes be reduced further on a message-passing system by combining messages between the same source-destination pair into larger messages if the interaction pattern permits and if the data for multiple messages are available at the same time, albeit in separate data structures.
Sparse matrix-vector multiplication is a problem whose parallel formulation can use this technique to reduce interaction overhead. In typical applications, repeated sparse matrix-vector multiplication is performed with matrices of the same nonzero pattern but different numerical nonzero values. While solving this problem in parallel, a process interacts with others to access elements of the input vector that it may need for its local computation. Through a one-time scanning of the nonzero pattern of the rows of the sparse matrix that a process is responsible for, it can determine exactly which elements of the input vector it needs and from which processes. Then, before starting each multiplication, a process can first collect all the nonlocal entries of the input vector that it requires, and then perform an interaction-free multiplication. This strategy is far superior than trying to access a nonlocal element of the input vector as and when required in the computation.
Our discussion so far has been largely focused on reducing interaction overheads by directly or indirectly reducing the frequency and volume of data transfers. However, the data-access and inter-task interaction patterns can often lead to contention that can increase the overall interaction overhead. In general, contention occurs when multiple tasks try to access the same resources concurrently. Multiple simultaneous transmissions of data over the same interconnection link, multiple simultaneous accesses to the same memory block, or multiple processes sending messages to the same process at the same time, can all lead to contention. This is because only one of the multiple operations can proceed at a time and the others are queued and proceed sequentially.
Consider the problem of multiplying two matrices C = AB, using the two-dimensional partitioning shown in Figure 3.26(b). Let p be the number of tasks with a one-to-one mapping of tasks onto processes. Let each task be responsible for computing a unique Ci,j, for ![]() . The straightforward way of performing this computation is for Ci,j to be computed according to the following formula (written in matrix-block notation):
. The straightforward way of performing this computation is for Ci,j to be computed according to the following formula (written in matrix-block notation):
Looking at the memory access patterns of the above equation, we see that at any one of the ![]() steps,
steps, ![]() tasks will be accessing the same block of A and B. In particular, all the tasks that work on the same row of C will be accessing the same block of A. For example, all
tasks will be accessing the same block of A and B. In particular, all the tasks that work on the same row of C will be accessing the same block of A. For example, all ![]() processes computing
processes computing ![]() will attempt to read A0,0 at once. Similarly, all the tasks working on the same column of C will be accessing the same block of B. The need to concurrently access these blocks of matrices A and B will create contention on both NUMA shared-address-space and message-passing parallel architectures.
will attempt to read A0,0 at once. Similarly, all the tasks working on the same column of C will be accessing the same block of B. The need to concurrently access these blocks of matrices A and B will create contention on both NUMA shared-address-space and message-passing parallel architectures.
One way of reducing contention is to redesign the parallel algorithm to access data in contention-free patterns. For the matrix multiplication algorithm, this contention can be eliminated by modifying the order in which the block multiplications are performed in Equation 3.1. A contention-free way of performing these block-multiplications is to compute Ci,j by using the formula
where ‘%’ denotes the modulo operation. By using this formula, all the tasks P∗,j that work on the same row of C will be accessing block ![]() , which is different for each task. Similarly, all the tasks Pi,∗ that work on the same column of C will be accessing block
, which is different for each task. Similarly, all the tasks Pi,∗ that work on the same column of C will be accessing block ![]() , which is also different for each task. Thus, by simply rearranging the order in which the block-multiplications are performed, we can completely eliminate the contention. For example, among the processes computing the first block row of C, the process computing C0,j will access A0,j from the first block row of A instead of A0,0.
, which is also different for each task. Thus, by simply rearranging the order in which the block-multiplications are performed, we can completely eliminate the contention. For example, among the processes computing the first block row of C, the process computing C0,j will access A0,j from the first block row of A instead of A0,0.
Centralized schemes for dynamic mapping (Section 3.4.2) are a frequent source of contention for shared data structures or communication channels leading to the master process. The contention may be reduced by choosing a distributed mapping scheme over a centralized one, even though the former may be harder to implement.
The amount of time that processes spend waiting for shared data to arrive or to receive additional work after an interaction has been initiated can be reduced, often substantially, by doing some useful computations during this waiting time. There are a number of techniques that can be used to overlap computations with interactions.
A simple way of overlapping is to initiate an interaction early enough so that it is completed before it is needed for computation. To achieve this, we must be able to identify computations that can be performed before the interaction and do not depend on it. Then the parallel program must be structured to initiate the interaction at an earlier point in the execution than it is needed in the original algorithm. Typically, this is possible if the interaction pattern is spatially and temporally static (and therefore, predictable) or if multiple tasks that are ready for execution are available on the same process so that if one blocks to wait for an interaction to complete, the process can work on another task. The reader should note that by increasing the number of parallel tasks to promote computation-interaction overlap, we are reducing the granularity of the tasks, which in general tends to increase overheads. Therefore, this technique must be used judiciously.
In certain dynamic mapping schemes, as soon as a process runs out of work, it requests and gets additional work from another process. It then waits for the request to be serviced. If the process can anticipate that it is going to run out of work and initiate a work transfer interaction in advance, then it may continue towards finishing the tasks at hand while the request for more work is being serviced. Depending on the problem, estimating the amount of remaining work may be easy or hard.
In most cases, overlapping computations with interaction requires support from the programming paradigm, the operating system, and the hardware. The programming paradigm must provide a mechanism to allow interactions and computations to proceed concurrently. This mechanism should be supported by the underlying hardware. Disjoint address-space paradigms and architectures usually provide this support via non-blocking message passing primitives. The programming paradigm provides functions for sending and receiving messages that return control to the user’s program before they have actually completed. Thus, the program can use these primitives to initiate the interactions, and then proceed with the computations. If the hardware permits computation to proceed concurrently with message transfers, then the interaction overhead can be reduced significantly.
On a shared-address-space architecture, the overlapping of computations and interaction is often assisted by prefetching hardware. In this case, an access to shared data is nothing more than a regular load or store instruction. The prefetch hardware can anticipate the memory addresses that will need to be accessed in the immediate future, and can initiate the access in advance of when they are needed. In the absence of prefetching hardware, the same effect can be achieved by a compiler that detects the access pattern and places pseudo-references to certain key memory locations before these locations are actually utilized by the computation. The degree of success of this scheme is dependent upon the available structure in the program that can be inferred by the prefetch hardware and by the degree of independence with which the prefetch hardware can function while computation is in progress.
Replication of data or computations is another technique that may be useful in reducing interaction overheads.
In some parallel algorithms, multiple processes may require frequent read-only access to shared data structure, such as a hash-table, in an irregular pattern. Unless the additional memory requirements are prohibitive, it may be best in a situation like this to replicate a copy of the shared data structure on each process so that after the initial interaction during replication, all subsequent accesses to this data structure are free of any interaction overhead.
In the shared-address-space paradigm, replication of frequently accessed read-only data is often affected by the caches without explicit programmer intervention. Explicit data replication is particularly suited for architectures and programming paradigms in which read-only access to shared data is significantly more expensive or harder to express than local data accesses. Therefore, the message-passing programming paradigm benefits the most from data replication, which may reduce interaction overhead and also significantly simplify the writing of the parallel program.
Data replication, however, does not come without its own cost. Data replication increases the memory requirements of a parallel program. The aggregate amount of memory required to store the replicated data increases linearly with the number of concurrent processes. This may limit the size of the problem that can be solved on a given parallel computer. For this reason, data replication must be used selectively to replicate relatively small amounts of data.
In addition to input data, the processes in a parallel program often share intermediate results. In some situations, it may be more cost-effective for a process to compute these intermediate results than to get them from another process that generates them. In such situations, interaction overhead can be traded for replicated computation. For example, while performing the Fast Fourier Transform (see Section 13.2.3 for more details), on an N-point series, N distinct powers of ω or “twiddle factors” are computed and used at various points in the computation. In a parallel implementation of FFT, different processes require overlapping subsets of these N twiddle factors. In a message-passing paradigm, it is best for each process to locally compute all the twiddle factors it needs. Although the parallel algorithm may perform many more twiddle factor computations than the serial algorithm, it may still be faster than sharing the twiddle factors.
As discussed in Section 3.3.2, often the interaction patterns among concurrent activities are static and regular. A class of such static and regular interaction patterns are those that are performed by groups of tasks, and they are used to achieve regular data accesses or to perform certain type of computations on distributed data. A number of key such collective interaction operations have been identified that appear frequently in many parallel algorithms. Broadcasting some data to all the processes or adding up numbers, each belonging to a different process, are examples of such collective operations. The collective data-sharing operations can be classified into three categories. The first category contains operations that are used by the tasks to access data, the second category of operations are used to perform some communication-intensive computations, and finally, the third category is used for synchronization.
Highly optimized implementations of these collective operations have been developed that minimize the overheads due to data transfer as well as contention. Chapter 4 describes algorithms for implementing some of the commonly used collective interaction operations. Optimized implementations of these operations are available in library form from the vendors of most parallel computers, e.g., MPI (message passing interface). As a result, the algorithm designer does not need to think about how these operations are implemented and needs to focus only on the functionality achieved by these operations. However, as discussed in Section 3.5.6, sometimes the interaction pattern may make it worthwhile for the parallel programmer to implement one’s own collective communication procedure.
If the data-transfer capacity of the underlying hardware permits, then overlapping interactions between multiple pairs of processes can reduce the effective volume of communication. As an example of overlapping interactions, consider the commonly used collective communication operation of one-to-all broadcast in a message-passing paradigm with four processes P0, P1, P2, and P3. A commonly used algorithm to broadcast some data from P0 to all other processes works as follows. In the first step, P0 sends the data to P2. In the second step, P0 sends the data to P1, and concurrently, P2 sends the same data that it had received from P0 to P3. The entire operation is thus complete in two steps because the two interactions of the second step require only one time step. This operation is illustrated in Figure 3.41(a). On the other hand, a naive broadcast algorithm would send the data from P0 to P1 to P2 to P3, thereby consuming three steps as illustrated in Figure 3.41(b).
Figure 3.41. Illustration of overlapping interactions in broadcasting data from one to four processes.
Interestingly, however, there are situations when the naive broadcast algorithm shown in Figure 3.41(b) may be adapted to actually increase the amount of overlap. Assume that a parallel algorithm needs to broadcast four data structures one after the other. The entire interaction would require eight steps using the first two-step broadcast algorithm. However, using the naive algorithm accomplishes the interaction in only six steps as shown in Figure 3.41(c). In the first step, P0 sends the first message to P1. In the second step P0 sends the second message to P1 while P1 simultaneously sends the first message to P2. In the third step, P0 sends the third message to P1, P1 sends the second message to P2, and P2 sends the first message to P3. Proceeding similarly in a pipelined fashion, the last of the four messages is sent out of P0 after four steps and reaches P3 in six. Since this method is rather expensive for a single broadcast operation, it is unlikely to be included in a collective communication library. However, the programmer must infer from the interaction pattern of the algorithm that in this scenario, it is better to make an exception to the suggestion of Section 3.5.5 and write your own collective communication function.
Having discussed the techniques for decomposition, mapping, and minimizing interaction overheads, we now present some of the commonly used parallel algorithm models. An algorithm model is typically a way of structuring a parallel algorithm by selecting a decomposition and mapping technique and applying the appropriate strategy to minimize interactions.
The data-parallel model is one of the simplest algorithm models. In this model, the tasks are statically or semi-statically mapped onto processes and each task performs similar operations on different data. This type of parallelism that is a result of identical operations being applied concurrently on different data items is called data parallelism. The work may be done in phases and the data operated upon in different phases may be different. Typically, data-parallel computation phases are interspersed with interactions to synchronize the tasks or to get fresh data to the tasks. Since all tasks perform similar computations, the decomposition of the problem into tasks is usually based on data partitioning because a uniform partitioning of data followed by a static mapping is sufficient to guarantee load balance.
Data-parallel algorithms can be implemented in both shared-address-space and message-passing paradigms. However, the partitioned address-space in a message-passing paradigm may allow better control of placement, and thus may offer a better handle on locality. On the other hand, shared-address space can ease the programming effort, especially if the distribution of data is different in different phases of the algorithm.
Interaction overheads in the data-parallel model can be minimized by choosing a locality preserving decomposition and, if applicable, by overlapping computation and interaction and by using optimized collective interaction routines. A key characteristic of data-parallel problems is that for most problems, the degree of data parallelism increases with the size of the problem, making it possible to use more processes to effectively solve larger problems.
An example of a data-parallel algorithm is dense matrix multiplication described in Section 3.1.1. In the decomposition shown in Figure 3.10, all tasks are identical; they are applied to different data.
As discussed in Section 3.1, the computations in any parallel algorithm can be viewed as a task-dependency graph. The task-dependency graph may be either trivial, as in the case of matrix multiplication, or nontrivial (Problem 3.5). However, in certain parallel algorithms, the task-dependency graph is explicitly used in mapping. In the task graph model, the interrelationships among the tasks are utilized to promote locality or to reduce interaction costs. This model is typically employed to solve problems in which the amount of data associated with the tasks is large relative to the amount of computation associated with them. Usually, tasks are mapped statically to help optimize the cost of data movement among tasks. Sometimes a decentralized dynamic mapping may be used, but even then, the mapping uses the information about the task-dependency graph structure and the interaction pattern of tasks to minimize interaction overhead. Work is more easily shared in paradigms with globally addressable space, but mechanisms are available to share work in disjoint address space.
Typical interaction-reducing techniques applicable to this model include reducing the volume and frequency of interaction by promoting locality while mapping the tasks based on the interaction pattern of tasks, and using asynchronous interaction methods to overlap the interaction with computation.
Examples of algorithms based on the task graph model include parallel quicksort (Section 9.4.1), sparse matrix factorization, and many parallel algorithms derived via divide-and-conquer decomposition. This type of parallelism that is naturally expressed by independent tasks in a task-dependency graph is called task parallelism.
The work pool or the task pool model is characterized by a dynamic mapping of tasks onto processes for load balancing in which any task may potentially be performed by any process. There is no desired premapping of tasks onto processes. The mapping may be centralized or decentralized. Pointers to the tasks may be stored in a physically shared list, priority queue, hash table, or tree, or they could be stored in a physically distributed data structure. The work may be statically available in the beginning, or could be dynamically generated; i.e., the processes may generate work and add it to the global (possibly distributed) work pool. If the work is generated dynamically and a decentralized mapping is used, then a termination detection algorithm (Section 11.4.4) would be required so that all processes can actually detect the completion of the entire program (i.e., exhaustion of all potential tasks) and stop looking for more work.
In the message-passing paradigm, the work pool model is typically used when the amount of data associated with tasks is relatively small compared to the computation associated with the tasks. As a result, tasks can be readily moved around without causing too much data interaction overhead. The granularity of the tasks can be adjusted to attain the desired level of tradeoff between load-imbalance and the overhead of accessing the work pool for adding and extracting tasks.
Parallelization of loops by chunk scheduling (Section 3.4.2) or related methods is an example of the use of the work pool model with centralized mapping when the tasks are statically available. Parallel tree search where the work is represented by a centralized or distributed data structure is an example of the use of the work pool model where the tasks are generated dynamically.
In the master-slave or the manager-worker model, one or more master processes generate work and allocate it to worker processes. The tasks may be allocated a priori if the manager can estimate the size of the tasks or if a random mapping can do an adequate job of load balancing. In another scenario, workers are assigned smaller pieces of work at different times. The latter scheme is preferred if it is time consuming for the master to generate work and hence it is not desirable to make all workers wait until the master has generated all work pieces. In some cases, work may need to be performed in phases, and work in each phase must finish before work in the next phases can be generated. In this case, the manager may cause all workers to synchronize after each phase. Usually, there is no desired premapping of work to processes, and any worker can do any job assigned to it. The manager-worker model can be generalized to the hierarchical or multi-level manager-worker model in which the top-level manager feeds large chunks of tasks to second-level managers, who further subdivide the tasks among their own workers and may perform part of the work themselves. This model is generally equally suitable to shared-address-space or message-passing paradigms since the interaction is naturally two-way; i.e., the manager knows that it needs to give out work and workers know that they need to get work from the manager.
While using the master-slave model, care should be taken to ensure that the master does not become a bottleneck, which may happen if the tasks are too small (or the workers are relatively fast). The granularity of tasks should be chosen such that the cost of doing work dominates the cost of transferring work and the cost of synchronization. Asynchronous interaction may help overlap interaction and the computation associated with work generation by the master. It may also reduce waiting times if the nature of requests from workers is non-deterministic.
In the pipeline model, a stream of data is passed on through a succession of processes, each of which perform some task on it. This simultaneous execution of different programs on a data stream is called stream parallelism. With the exception of the process initiating the pipeline, the arrival of new data triggers the execution of a new task by a process in the pipeline. The processes could form such pipelines in the shape of linear or multidimensional arrays, trees, or general graphs with or without cycles. A pipeline is a chain of producers and consumers. Each process in the pipeline can be viewed as a consumer of a sequence of data items for the process preceding it in the pipeline and as a producer of data for the process following it in the pipeline. The pipeline does not need to be a linear chain; it can be a directed graph. The pipeline model usually involves a static mapping of tasks onto processes.
Load balancing is a function of task granularity. The larger the granularity, the longer it takes to fill up the pipeline, i.e. for the trigger produced by the first process in the chain to propagate to the last process, thereby keeping some of the processes waiting. However, too fine a granularity may increase interaction overheads because processes will need to interact to receive fresh data after smaller pieces of computation. The most common interaction reduction technique applicable to this model is overlapping interaction with computation.
An example of a two-dimensional pipeline is the parallel LU factorization algorithm, which is discussed in detail in Section 8.3.1.
In some cases, more than one model may be applicable to the problem at hand, resulting in a hybrid algorithm model. A hybrid model may be composed either of multiple models applied hierarchically or multiple models applied sequentially to different phases of a parallel algorithm. In some cases, an algorithm formulation may have characteristics of more than one algorithm model. For instance, data may flow in a pipelined manner in a pattern guided by a task-dependency graph. In another scenario, the major computation may be described by a task-dependency graph, but each node of the graph may represent a supertask comprising multiple subtasks that may be suitable for data-parallel or pipelined parallelism. Parallel quicksort (Sections 3.2.5 and 9.4.1) is one of the applications for which a hybrid model is ideally suited.
Various texts, such as those by Wilson [Wil95], Akl [Akl97], Hwang and Xu [HX98], Wilkinson and Allen [WA99], and Culler and Singh [CSG98], among others, present similar or slightly varying models for parallel programs and steps in developing parallel algorithms. The book by Goedecker and Hoisie [GH01] is among the relatively few textbooks that focus on the practical aspects of writing high-performance parallel programs. Kwok and Ahmad [KA99a, KA99b] present comprehensive surveys of techniques for mapping tasks onto processes.
Most of the algorithms used in this chapter as examples are discussed in detail in other chapters in this book dedicated to the respective class of problems. Please refer to the bibliographic remarks in those chapters for further references on these algorithms.
3.1 In Example 3.2, each union and intersection operation can be performed in time proportional to the sum of the number of records in the two input tables. Based on this, construct the weighted task-dependency graphs corresponding to Figures 3.2 and 3.3, where the weight of each node is equivalent to the amount of work required by the corresponding task. What is the average degree of concurrency of each graph?
3.2 For the task graphs given in Figure 3.42, determine the following:
Maximum degree of concurrency.
Critical path length.
Maximum achievable speedup over one process assuming that an arbitrarily large number of processes is available.
The minimum number of processes needed to obtain the maximum possible speedup.
The maximum achievable speedup if the number of processes is limited to (a) 2, (b) 4, and (c) 8.
3.3 What are the average degrees of concurrency and critical-path lengths of task-dependency graphs corresponding to the decompositions for matrix multiplication shown in Figures 3.10 and 3.11?
3.4 Let d be the maximum degree of concurrency in a task-dependency graph with t tasks and a critical-path length l. Prove that
 .
.3.5 Consider LU factorization of a dense matrix shown in Algorithm 3.3. Figure 3.27 shows the decomposition of LU factorization into 14 tasks based on a two-dimensional partitioning of the matrix A into nine blocks Ai,j, 1 ≤ i, j ≤ 3. The blocks of A are modified into corresponding blocks of L and U as a result of factorization. The diagonal blocks of L are lower triangular submatrices with unit diagonals and the diagonal blocks of U are upper triangular submatrices. Task 1 factors the submatrix A1,1 using Algorithm 3.3. Tasks 2 and 3 implement the block versions of the loop on Lines 4–6 of Algorithm 3.3. Tasks 4 and 5 are the upper-triangular counterparts of tasks 2 and 3. The element version of LU factorization in Algorithm 3.3 does not show these steps because the diagonal entries of L are 1; however, a block version must compute a block-row of U as a product of the inverse of the corresponding diagonal block of L with the block-row of A. Tasks 6–9 implement the block version of the loops on Lines 7–11 of Algorithm 3.3. Thus, Tasks 1–9 correspond to the block version of the first iteration of the outermost loop of Algorithm 3.3. The remainder of the tasks complete the factorization of A. Draw a task-dependency graph corresponding to the decomposition shown in Figure 3.27.
3.6 Enumerate the critical paths in the decomposition of LU factorization shown in Figure 3.27.
3.7 Show an efficient mapping of the task-dependency graph of the decomposition shown in Figure 3.27 onto three processes. Prove informally that your mapping is the best possible mapping for three processes.
3.8 Describe and draw an efficient mapping of the task-dependency graph of the decomposition shown in Figure 3.27 onto four processes and prove that your mapping is the best possible mapping for four processes.
3.9 Assuming that each task takes a unit amount of time, [1] which of the two mappings – the one onto three processes or the one onto four processes – solves the problem faster?
3.10 Prove that block steps 1 through 14 in Figure 3.27 with block size b (i.e., each Ai,j, Li,j, and Ui,j is a b × b submatrix) are mathematically equivalent to running the algorithm of Algorithm 3.3 on an n × n matrix A, where n = 3b.
Hint: Using induction on b is one possible approach.
3.11 Figure 3.27 shows the decomposition into 14 tasks of LU factorization of a matrix split into blocks using a 3 × 3 two-dimensional partitioning. If an m × m partitioning is used, derive an expression for the number of tasks t(m) as a function of m in a decomposition along similar lines.
Hint: Show that t(m) = t(m − 1) + m2.
3.12 In the context of Problem 3.11, derive an expression for the maximum degree of concurrency d(m) as a function of m.
3.13 In the context of Problem 3.11, derive an expression for the critical-path length l(m) as a function of m.
3.14 Show efficient mappings for the decompositions for the database query problem shown in Figures 3.2 and 3.3. What is the maximum number of processes that you would use in each case?
3.15 In the algorithm shown in Algorithm 3.4, assume a decomposition such that each execution of Line 7 is a task. Draw a task-dependency graph and a task-interaction graph.
3.16 In Algorithm 3.4, if n = 16, devise a good mapping for 16 processes.
3.17 In Algorithm 3.4, if n = 16, devise a good mapping for 8 processes.
3.18 Repeat Problems 3.15, 3.16, and 3.17 if the statement of Line 3 in Algorithm 3.4 is changed to m = (log2 n) − 1.
3.19 Consider a simplified version of bucket-sort. You are given an array A of n random integers in the range [1...r] as input. The output data consist of r buckets, such that at the end of the algorithm, Bucket i contains indices of all the elements in A that are equal to i.
Describe a decomposition based on partitioning the input data (i.e., the array A) and an appropriate mapping onto p processes. Describe briefly how the resulting parallel algorithm would work.
Describe a decomposition based on partitioning the output data (i.e., the set of r buckets) and an appropriate mapping onto p processes. Describe briefly how the resulting parallel algorithm would work.
3.20 In the context of Problem 3.19, which of the two decompositions leads to a better parallel algorithm? Should the relative values of n and r have a bearing on the selection of one of the two decomposition schemes?
3.21 Consider seven tasks with running times of 1, 2, 3, 4, 5, 5, and 10 units, respectively. Assuming that it does not take any time to assign work to a process, compute the best- and worst-case speedup for a centralized scheme for dynamic mapping with two processes.
3.22 Suppose there are M tasks that are being mapped using a centralized dynamic load balancing scheme and we have the following information about these tasks:
Average task size is 1.
Minimum task size is 0.
Maximum task size is m.
It takes a process △ time to pick up a task.
Compute the best- and worst-case speedups for self-scheduling and chunk-scheduling assuming that tasks are available in batches of l (l < M). What are the actual values of the best- and worst-case speedups for the two scheduling methods when p = 10, △ = 0.2, m = 20, M = 100, and l = 2?
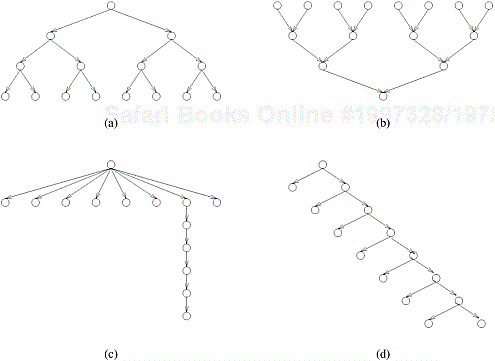
[1] In practice, for a block size b ≫ 1, Tasks 1, 10, and 14 require about 2/3b3 arithmetic operations; Tasks 2, 3, 4, 5, 11, and 12 require about b3 operations; and Tasks 6, 7, 8, 9, and 13 require about 2b3 operations.