
Sift through network data with one of the most advanced protocol analyzers available.
Ethereal is
one of the most popular protocol analyzers on the planet. It runs on
virtually all major platforms, including Linux, BSD, Mac OS X, and
Windows. Like tcpdump
[Hack #37], it
can capture packets
directly from a network interface, or analyze data from a previously
saved file. While capturing data, Ethereal can give you
real-time
statistics about which protocols are actively in use (Figure 3-35). Start capturing by selecting
Capture
→
Start..., select the interface you want to
capture from, and click OK. Note that you need
proper permissions (typically root privileges) to actually capture
data.

If you would like to see these statistics again (with even more
detail) after you have finished capturing packets, go to
Tools
→
Protocol Heirarchy
Statistics
. You can use this on previously captured dump
files as well. If you already have some captured data (say, saved
with tcpdump from a remote machine), you can simply click
File
→
Open... and
select the file you’d like to analyze.
Ethereal displays the data it has collected in three ways. The top part of the window shows a summary of the data, with one packet per line. This lists the sequence, time, IP data, protocol, and general description of the packet. The data can be sorted on any of these fields by clicking the field name at the top. Selecting one packet displays more information in the other two window areas. The middle part of the window shows a hierarchical dissection of the packet, including the Ethernet, IP, TCP, and other layers. This allows you to quickly “drill down” into the particular piece of the packet that you are interested in. The bottom portion of the window shows a hex dump of the actual packet. Bits of the packet are automatically highlighted by selecting parts of the packet in the middle section. For example, selecting the IP source address in the middle section highlights the corresponding 4 bytes in the hex dump at the bottom.
Figure 3-36 shows Ethereal’s
ability to dissect high-level protocols such as
HTTP. Select an HTTP packet at the
top, and open the Hypertext Transfer Protocol
drop-down in the middle section. This shows the contents of the
packet in plain ASCII.

Of course, most
TCP conversations are
spread across several packets. Ethereal reassembles the entire stream
for you by selecting one packet and clicking Tools
→
Follow TCP Stream. Figure 3-37 shows the results of following the above HTTP
stream.
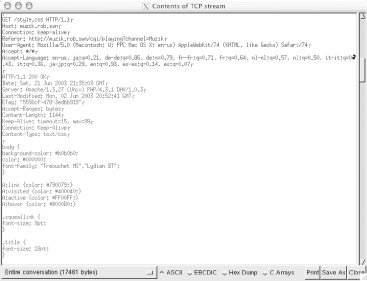
It is difficult to tell in black and white, but the two conversations are actually displayed in different colors, making it simple to tell at a glance which side is speaking.
Speaking of colors, Ethereal can even display its packet data with color coding, defined by a rich pattern-matching language. This can make any data you are searching for leap out in bold red while showing everything else in pale gray, for example. It uses the same pattern-matching language to specify display filters, which unfortunately isn’t the same language used by tcpdump. For an example of how to build a display filter, see [Hack #39].
This is just a simple example of some of Ethereal’s basic features. It can show you as much detail as you care to know about the packets flying around on your wireless network, and is one of the most powerful tools available for tracking down network problems. See the documentation and example capture files at http://www.ethereal.com/ for some other creative uses for Ethereal.