

Syslog Message Analysis Program
This appendix explains to use the Message Analysis Program to analyze your console message traffic in the context of a IBM zAware environment.
Message Analysis Program
To help clients better understand their console message traffic, and set up message suppression lists, Message Processing Facility (MPF) exits and Message Flood Automation (MFA), IBM provides a program called the Message Analysis Program (MAP). This program is available on the z/OS Tools and Toys web site at: http://www-03.ibm.com/systems/z/os/zos/features/unix/bpxa1ty2.html
The program is provided on an as-is basis.
In addition to its use with automation, MPF, MFA, and so on, the program also provides information that might be valuable in an IBM zAware environment.
Capacity planning
The amount of CPU, disk, and network capacity that is required for IBM zAware is a factor of the following items:
•The peak rate at which messages are produced and sent to IBM zAware
•The number of unique message IDs
•How long the information is kept by IBM zAware
MAP provides you with the first two of these three items.
Running the MAP program
To run the MAP program, first download the zip file from the Tools and Toys web site. In the zip file, you will find a README file that contains instructions for uploading the other MAP files to your z/OS system. Note that some of the files must be uploaded in Binary format, and others in Text format.
The README file also includes instructions for link-editing the MAP object code.
When you have all the files uploaded to z/OS and the program has been link-edited, the next step is to create the input file or files for the program. MAP can process syslog files and files that have been created from OPERLOG using the IEAMDBLG program.
There might be a few changes you need to make to the control statements for the program:
•The default date format that MAP expects is 2-digit years (this is controlled by the HCFORMAT keyword in your CONSOLxx member). If you are using 4-digit years, you need to specify “YEAR4” in the MAP control statements.
•If the input file contains carriage control characters, but is not defined as VBA, you need to adjust for that by telling the program to offset all records by one byte. You do this by specifying OFFSET(1) in the MAP control statements.
A sample set of JCL to run the MAP program is shown in Example A-1.
Example A-1 Sample JCL to run MAP program
//MSGLG610 JOB (0,0),
// CLASS=A,MSGLEVEL=(1,1),MSGCLASS=X,NOTIFY=&SYSUID
//* *****************************************************************
//* ALL MESSAGES.
//* *****************************************************************
//JOBLIB DD DSN=KYNEF.MSGLG610.LOAD,DISP=SHR
//MSGRATE EXEC PGM=MSGLG610,REGION=5000K
//OPTIN DD *
TITLE: ZAWARE TEST ITSO
OFFSET(1)
YEAR4
REPORT(SUM,AMSG,CMSG,MFRQ,RTGR,IMRT)
RATEMSGS(ALL)
IMSGINTV(5) -- 1 HOUR INTERVALS
* IMSGSCAL(RELATIVE)
IMSGSCAL(LINEAR)
IMSGRANGE(32000) -- USE WITH IMSGSCAL(LINEAR) ONLY
IMSGLNECT(85) -- LINES BETWEEN PAGE-SKIPS (DEFAULT 60)
//*-------------------------------------------------------------------*
//* 'DUMPTBL(MSG,RATE)' SHOULD BE SPECIFIED AS AN OPTION IF *
//* STATISTICAL DATA IS BEING COLLECTED FOR RETURN TO IBM. *
//*-------------------------------------------------------------------*
//DATA DD DSN=KYNEF.WTSCPLX1.OPERLOGS,DISP=SHR
//TTLLIB DD DSN=KYNEF.MSGLG610.TEXT,DISP=SHR
//SYSUDUMP DD SYSOUT=*
//SYSPRINT DD SYSOUT=*
//*-------------------------------------------------------------------*
//* IF USED, THE FOLLOWING DD'S SHOULD HAVE: OUTPUT=(*.STDOUT) *
//*-------------------------------------------------------------------*
//*LABEL DD SYSOUT=*
//IPLST DD SYSOUT=*
//PRNTOUT DD SYSOUT=*
//COMPRATE DD SYSOUT=*
//COMPMSG DD SYSOUT=*
//UNKNOWN DD DUMMY
//PREVIEW DD DUMMY
//IMSGRATE DD DUMMY
//BURST DD DUMMY
//*-------------------------------------------------------------------*
//* THE FOLLOWING DD'S ARE USED TO DUMP INTERNAL TABLES FOR REUSE. *
//* *
//* ----> IF USED, 'DUMPRATE' -MUST- HAVE A DISP OF 'MOD' <---- *
//* *
//* THE 'DUMPMSG' DD AND 'DUMPRATE' DD SHOULD BE SPECIFIED IF *
//* STATISTICAL DATA IS BEING COLLECTED FOR RETURN TO IBM. *
//*-------------------------------------------------------------------*
//DUMPCNT DD DUMMY
//DUMPMSG DD DUMMY
//DUMPCMD DD DUMMY
//DUMPRATE DD DUMMY
//OUT DD DUMMY
The //DATA DD card must be updated to point at your input file. Also, the JOBLIB and TTLLIB DD cards must be updated to point at wherever you stored the MAP program and the message definitions that are provided with MAP.
The program can provide many different reports (they are all described in the GUIDE160.HTML file in the zip file). But here we simply focus on the ones that are of interest in the context of this book.
When you run this job, the output will contain a number of sections. The ones that we are interested in are ** Message IDs in Alphabetic Order **. The last five lines of that report will look something like the text in Example A-2. Specifically, you are interested in the number of unique message IDs.
Example A-2 Identifying number of unique message IDs
100010 Total message lines
863 Unique message IDs
17079 Total messages without IDs processed
83 Unique messages without IDs identified
3.351 Entries searched on average
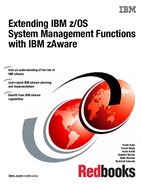
The job output contains a graph titled “message rate / second for: All message traffic incl. cmd responses all msgs selected.” There are four pairs of Message Rate graphs. The first graph of each pair shows message rates as a percentage of total message traffic. The second graph of each pair shows message rates as a percentage of the total number of intervals. A sample is shown in Figure A-1.
Figure A-1 Identifying peak message rates
In the chart, note the following points:
•The 5s indicate the message rate per hour.
•The 4s indicate the message rate per 10-minute interval.
•The 3s indicate the message rate per minute.
•The 2s indicate the message rate per 10-second interval.
•The 1s indicate the message rate per second.
For example, in the chart in Figure A-1, you can see that the 1-second interval line intersects the 80 percent horizontal line at the 200-message per second vertical line. This means that 80 percent of the messages found on the log occur in busy 1-second intervals having an instantaneous message rate of 200 messages per second or less and 20 percent of the messages found on the log occur in busy 1-second intervals having an instantaneous message rate of 200 messages per second or more. In this example, the 10-second interval line intersects the 100 percent line at about 250 messages per second.
Assuming that each message is about 130 bytes and that you want to cater for the busiest 10-second interval, in this example, you might want to provide a bandwidth of at least 32.5 KB per second for this LPAR.
Determining ability to build a model
As described in 3.2, “Selecting which systems to monitor with IBM zAware” on page 96, to be able to create a representative model for a system, IBM zAware needs a minimum number of unique message IDs. In addition, each of those messages must occur a minimum number of times. When considering which systems are good candidates for monitoring with IBM zAware, ensure that the message traffic from those systems meets the modeling criteria.
You can use the Message Analysis Program to identify the number of unique message IDs from each system and the number of occurrences of each message.
As shown in Example A-2 on page 210, MAP displays the number of unique messages IDs in the input file that you provide to it. The number of occurrences of each message is provided in the MAP report entitled “** Message IDs by Frequency”. The report is sorted by number of occurrences, with the most frequently occurring messages at the top.
Example A-3 Determining number of occurrences of each message
** Message IDs by Frequency
Total ID cnt ML cnt ML min ML max
20350 U/S <IEF196I 20350
5120 U/S DFS3258A 5120
4297 U/S +CSQX004I 2149 2148 1 1
4286 U/S HZS0002E 1196 3090 1 4
4179 U/S HZS0001I 1603 2576 1 2
3580 U/S <IXC467I 1072 2508 1 3
3023 U/S <IOS2001I 763 2260 2 3
2557 U/S <IXL014I 812 1745 2 4
2521 U/S ???0029 2521
2243 U/S <IEE252I 2243
To determine whether your input file meets the model criteria, get the number of unique message IDs, then count the number of messages that only occurred once or twice and subtract that from the number of unique message IDs. If the resulting value is too small, you can try increasing the number of days in the input file and see if that helps you meet the criteria.
A useful example of a system to do this for is a system that acts solely as a network owner. Those systems will typically not have a large number of unique message IDs, but they might still be systems that you want IBM zAware to monitor.
..................Content has been hidden....................
You can't read the all page of ebook, please click here login for view all page.