

IBM z/OS system management functions
IBM System z has always had a reputation for delivering the highest levels of system availability. The operating system components have integrated failure detection to allow recovery actions to occur without operator intervention. But even with that capability integrated into the operating system, failures can still occur.
As part of the effort to deliver even better availability, System z has created a set of system management functions that not only detect failures, but avoid failures. When failures do occur, these new functions help you more easily diagnose the cause of the problem and advise solutions to help you either to avoid an outage or reduce your mean time to recovery. Failures will still occur, but the advancements in failure avoidance and early failure detection mean that more failures can be mitigated before being visible to users, and before they impact your business.
As explained in 1.2.4, “Analytics can help address these issues” on page 6, you cannot achieve high availability by looking at only one view of your system or by using only one tool. Therefore, System z has multiple functions and products that perform their processing at different layers of the software stack, using different metrics for their early detection and different methodologies to detect abnormal behavior.
In this chapter, we highlight the various component functions and products available on System z that are designed to help you achieve your availability goals. We also provide sample scenarios in which each of them can be used.
The following topics are discussed:
•Overview of System z system management functions
•IBM z/OS Management Facility
•IBM Health Checker for z/OS
•Runtime Diagnostics
•Predictive Failure Analysis
•IBM zAware
•Message analysis with the various functions and products
•Additional tips
•Sample scenarios
2.1 Overview of System z system management functions
There are three general categories of software-detected system failures: masked failures, hard failures, and soft failures, as explained here:
Masked failure A masked failure is a failure that is detected and corrected by the software.
Hard failure A hard failure occurs when the software fails completely, quickly, and cleanly. For example, a hard failure occurs when the operating system abnormally terminates an address space.
Soft failure Sometimes a software component behaves in an unexpected or unusual manner. This abnormal behavior can be combined with events that usually do not generate failures, but produce secondary effects that might eventually result in a system failure. These types of failures are known as soft failures. You might have also heard these types of failures referred to as “sick, but not dead” incidents, meaning that the system appears to be running, but is not totally available.
Soft failures are often manifested as stalled or hung processes, resource contention, storage growth, or repetitive errors.
Clients have told us that soft failures account for a small percentage of the problems when compared to masked failures and hard failures, but they cause the largest business impact.
Soft failures are difficult to diagnose because the failure often does not occur in the address space causing the problem. In fact, the failure can often occur in an address space that might not even be associated with the issue.
During a soft failure, the problem often escalates from a minor problem in one address space or component to the point that the program eventually stops working and might even cause other components to fail. This sympathy sickness has been observed when either hard failures or abnormal behavior generate a system failure that could not be easily isolated to a failing component or subcomponent.
Because soft failures are difficult to detect, are quite unique, can be triggered anywhere in either software or hardware, and occur infrequently, their isolation is quite difficult. Therefore, to achieve high availability and reduce the rate of system failures, system management functions have been enhanced over the years and new functions have been developed. Additional tools have been developed to help you quickly discover the source of problems when they do arise.
Some of the system management functions are embedded directly in z/OS. These are sometimes referred to as in-band processing. Some of these functions help you avoid failures. Others help you detect, diagnose, and recover from the failures.
With the introduction of IBM zAware, we now have a tool that is independent of the operating system. Being independent of the operating system is sometimes referred to as out-of-band processing. Having an independent systems management function allows diagnosis of failures to occur even when the operating system is nonfunctional. It also allows compute-intensive analysis to be offloaded from the operating system’s LPAR.
System message logs have always been a critical resource for diagnosing operating system, middleware, and application problems. However, the volume of messages sent to the z/OS logs makes it difficult for operators and system programmers to quickly identify the messages required to pinpoint the problem.
Systems management functions including Runtime Diagnostics, Predictive Failure Analysis (PFA), and IBM zAware all provide functions that use messages and message logs to aid in detecting and diagnosing a problem. The differences in how these functions and products use the messages is described in 2.7, “Message analysis with the various functions and products” on page 82.
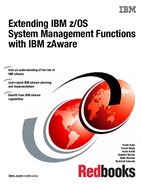
Figure 2-1 illustrates the system management functions included in z/OS. Each of the functions is described later in this book.

Figure 2-1 z/OS system management component relationship
Notice that each of the system management functions has its own specialty and some of them could be put into more than one specialty category:
•Problem detection
– z/OS operating system components have always had problem detection embedded in their logic.
As they detect abnormal situations such as software abends, their recovery code is invoked to handle the failure without operator intervention. Some z/OS components also provide soft failure detection, which usually results in an alert of some kind. See 2.1.1, “z/OS component functions” on page 27 for more information about the system management portion of z/OS operating system components.
– Predictive Failure Analysis (PFA) detects potential soft failures and alerts the operator before the failure escalates into a system problem.
PFA’s output can also be used to help diagnose the failure. See 2.5, “Predictive Failure Analysis” on page 42 for more information about PFA.
•Problem avoidance
– IBM Health Checker for z/OS is designed to identify configuration errors before they result in soft failures.
Health checks can be written by IBM component owners, ISVs, and by you. Health checks can set thresholds for system resources and detect migration actions that have not been completed so that your systems avoid these types of problems. See 2.3, “IBM Health Checker for z/OS” on page 30 for more information about IBM Health Checker for z/OS.
•Problem diagnosis
– z/OS OPERLOG and the z/OS console contain messages issued by z/OS components, middleware, and applications.
These messages are useful for diagnosing problems and are a data source for IBM and ISV problem determination and system automation.
– Runtime Diagnostics is a useful tool that can provide quick point-in-time diagnosis of problems.
This component is designed to be used for quick analysis of specific z/OS system issues to give the system operator an indication of where problem investigation should start. You can point Runtime Diagnostics to a system other than the system on which the command is being issued to detect problems on another system in your sysplex. See 2.4, “Runtime Diagnostics” on page 32 for more information about Runtime Diagnostics.
– z/OS Management Facility (z/OSMF) runs on the z/OS system and manages z/OS from z/OS itself.
z/OSMF is a Web 2.0-based application on z/OS, with direct access to z/OS data and information. It serves multiple roles in delivering simplified tasks to improve system programmer and operator productivity.
This book focuses on the role of z/OSMF as it relates to problem determination due to soft failures which is simplified with the z/OS incident log task. See 2.2, “IBM z/OS Management Facility” on page 28 for more information.
So, where does IBM zAware fit in the picture in Figure 2-1 on page 24? It is independent and resides outside of z/OS. It is designed to complement the functions in that figure by using powerful analytics algorithms to detect and help diagnose message anomalies without the need to access z/OS. This design provides the following benefits:
•It uses fewer system resources. This can sometimes be important when a system problem is occurring.
•It is operational even if all systems in your sysplex are having a problem.
•It allows you to easily see which system or systems are experiencing anomalous message behavior.
Figure 2-2 provides a simplified view of the various z/OS system management functions and products, identifies their locations in relation to z/OS, and gives a rudimentary view of their interfaces.
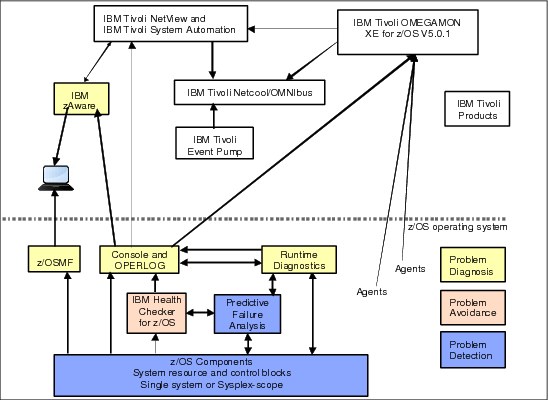
Figure 2-2 Systems management functions and products
Any component or product that uses OPERLOG or other system logs can participate in the systems management realm. For example, both IBM Health Checker for z/OS (including PFA output) and Runtime Diagnostics send their results to the z/OS system log.
Other examples include:
•The IBM Tivoli NetView CANZLOG function consolidates messages from the z/OS syslog and the NetView netlog. NetView can automate messages from either of these sources.
Additionally, as shown in Figure 2-2, NetView is able to use the IBM zAware API to retrieve information from the IBM zAware LPAR, allowing you to consolidate information from IBM zAware into the NetView operator interface.
•IBM Tivoli System Automation can be used to automate messages, and policies can be established to control corrective actions.
•IBM OMEGAMON® XE for z/OS 5.1.0 not only uses the messages, but also shows all health checks produced by IBM Health Checker for z/OS (including those owned by PFA).
•IBM zAware uses analytics to detect anomalous behavior using the OPERLOG.
•Performance issues and system problems can be detected by OMEGAMON.
•Netcool/OMNIbus provides centralized monitoring of health check alerts, performance, network activity, and so on.
•Tivoli Event Pump parses the messages, interprets the resource information within the messages, and converts the message to an event that can be read by other products.
•You can get alerts if PFA detects an abnormal condition and forward those events to other Tivoli event management products.
2.1.1 z/OS component functions
As shown in Figure 1-1 on page 3, detecting soft failures as close to the source as possible uses the minimum amount of system resources and ensures that the failure is responded to in the minimal time. Whenever possible, z/OS components try to detect and address soft failures themselves.
The following list provides a few examples of how z/OS components detect problems on a single system:
•The GRS component added enhanced contention analysis to identify enqueue blockers and waiters a number of releases ago. More recently, GRS implemented similar support for latches. Both enqueue contention detection and latch contention detection use the D GRS,ANALYZE command. The latch identity string is exploited by z/OS UNIX System Services, the Logger component, and IBM RACF® for their latches. In addition, Runtime Diagnostics takes advantage of the functions provided by GRS in its analysis of enqueue contention and GRS latch contention.
•The Missing Interrupt Handler (MIH) component intercepts incomplete I/O operations to prevent an application or system outage due to a device, control unit, or hardware (cabling) error. After the scope of the problem is understood, hardware and software recovery mechanisms are invoked and diagnostic data is captured.
•The system invokes the I/O Timing Facility to identify slow I/O response times by monitoring I/O requests that exceed I/O timing limits for devices.
•IBM has made improvements in channel recovery such that for frequently occurring path errors, the path is taken offline rather than having the hardware or operating system repeatedly try to recover the path.
•z/OS can detect contention in the Catalog Address Space, which identifies catalog tasks that appear to be stuck while waiting on an event. When this occurs, a symptom record is created and the task is terminated if the system deems it is safe to do so.
•The JES2 Monitor assists in determining why JES2 is not responding to requests. It monitors conditions that can seriously impact JES2 performance.
The following list provides a few examples of how z/OS components detect problems in a sysplex:
•XCF stalled member support detects whether a system that appears to be healthy is actually performing useful work. There might be critical functions that are non-operational that are making the system unusable and induce sympathy sickness elsewhere in the sysplex. When a problem is detected, action should be taken to restore the system to normal operation or remove it from the sysplex to avoid sympathy sickness.
•Sysplex Failure Management (SFM) detects and can automatically address soft failures that can cause sympathy sickness conditions when a system or sysplex application is unresponsive and might be holding resources needed by other systems in the sysplex.
•With critical member support, XCF terminates a critical member if it is “impaired” long enough. A critical member is a member of an XCF group that identifies itself as “critical” when joining the group. For example, GRS declares itself as a critical member when it joins its XCF group. If GRS cannot perform work for as long as the failure detection interval, it is marked as impaired. GRS indicates that when this occurs, the system on which it is running should be removed from the sysplex to avoid sympathy sickness.
•System Status Detection (SSD) uses z/OS BCPii to let XCF query the state of other systems through authorized interfaces through the Support Element and HMC network. If XCF detects that the system in question is in a state where it can no longer operate or recover, the system can be immediately partitioned out of the sysplex without having to wait for the failure detection interval to expire.
2.2 IBM z/OS Management Facility
IBM z/OS Management Facility (z/OSMF) simplifies, optimizes, and modernizes the z/OS system programmer and operator experience. z/OSMF delivers solutions using a task-oriented, web browser-based user interface to improve productivity by making the tasks easier to understand and use. z/OSMF makes the day-to-day operations and administration of your system easier for both new and experienced system programmers and operators.
2.2.1 z/OSMF tasks
The primary objective of z/OSMF is to make new staff productive as quickly as possible. This is accomplished by automating tasks and reducing the learning curve through a modern, simplified, and intuitive task-based, browser-based interface.
z/OSMF provides assistance in a number of areas:
•A configuration category with the Configuration Assistant
•The Links category that lets you add web links to the z/OSMF GUI
•A Performance category containing sysplex status, monitoring desktops, and workload management tasks
•The Problem Determination category that provides the incident log function
•The z/OSMF Administration category to let you administer z/OSMF itself
Because this book is focused on tools to help you avoid, detect, and diagnose soft failures, we only discuss the incident log task here.
Details about z/OSMF and its tasks can be found in other publications such as z/OSMF Configuration Guide, SA38-0652 and the IBM Redbooks document z/OS Management Facility, SG24-7851.
2.2.2 z/OSMF Incident Log
With its focus on simplification, z/OSMF is a natural addition to the set of z/OS functions focused on high availability and problem determination. Even with all the system management functions designed to avoid and detect failures, what if a problem still occurs? You need to diagnose and resolve the problem as quickly as possible to reduce your mean time to recovery and hopefully ensure that the problem does not occur again. The z/OSMF Incident Log task is designed to help you achieve higher availability by making problem determination diagnostic data management easier and quicker.
The reality is that when a problem occurs, it can be complicated and time-consuming to collect the right data and documentation to perform your problem analysis. And after you have the data for your problem analysis, it can be difficult to manage, particularly for less experienced staff.
The z/OSMF Incident Log task was created to alleviate these common troubleshooting challenges. It improves the first failure data capture for human-detected and system-detected problems that result in SVC dumps and creates diagnostic data snapshots for log data. It also provides a simple interface that allows you to perform these tasks:
•FTP this data to IBM or other software providers
•Display summary and detail information
•Drive incident management actions
•Manage the data related to the incident
For example, an incident might contain snapshots with 30 minutes of OPERLOG data (or SYSLOG data, if OPERLOG is not activated), one hour of LOGREC detail, and 24 hours of LOGREC summary. These materials are commonly required for z/OS-related problems reported to IBM service.
You can review all the incidents for your sysplex and drill down to see the diagnostic data associated with each incident. These details include the key system problem symptoms and the system symptom string.
If needed, you can then easily FTP the documents to IBM or an ISV or elsewhere for further debugging without having to remember where the data was archived. It also simplifies the steps involved to take another dump for a previously-recognized problem.
The z/OSMF Incident Log also integrates the IBM z/OS Problem Documentation Upload Utility (PDUU), which encrypts all of the files associated with an incident and transmits them to IBM using parallel sessions to send the material (such as a large system dump) more quickly.
z/OSMF Incident Log is accessed directly from the IBM z/OS Management Facility main panel and is located under “Problem Determination” as shown in Figure 2-3.
Figure 2-3 z/OSMF Incident Log
2.3 IBM Health Checker for z/OS
The IBM Health Checker for z/OS helps identify potential configuration problems before they impact availability or cause system outages. It checks the active z/OS and sysplex settings and definitions and compares them to IBM recommended best practice configuration values or customer-defined overrides. It generates output with detailed messages and reports to inform you of any potential problems and suggested actions to resolve them.
IBM Health Checker for z/OS is a preventative application that should be set up to run continuously on all systems to detect potential problems and to alert you if such a situation exists. It is also useful when new software releases or maintenance is installed on your system that might result in configuration issues.
It is not intended as a monitoring tool itself, but the output from health checks can be used by your monitoring tools. For example, NetView could raise an alert if a Health Checker exception above a certain level is issued. Also, some Health Check exception messages are contained in the “domain-specific” rules in IBM zAware.
IBM Health Checker for z/OS consists of the following parts:
•Framework
The framework is an interface that manages services like check registration, messaging, scheduling, command processing, logging, and reporting. It is an open architecture that supports check development by IBM products, independent software vendors (ISVs), and customers.
The framework is used by Predictive Failure Analysis as described in 2.5.3, “PFA and IBM Health Checker for z/OS integration” on page 45.
•Checks
Checks are programs or routines that evaluate component, element, or product-specific setting or definition, and look for potential problems on a running system. Checks are independent of the framework. The IBM checks are owned, delivered, and supported by the corresponding element of z/OS.
The following is an example of the types of things that the health checks provided by IBM look for:
•Check that specific system settings conform to best practices and recommendations.
•Check the configuration for single points of failure.
It is especially important that these checks run on a regular basis in case an unnoticed hardware change or failure has inadvertently introduced a single point of failure.
•Check the usage of finite system resources, such as common storage.
•Check that all the system’s availability-enhancing capabilities are being exploited.
•Check that sensitive system resources are protected.
You can, of course, also use vendor-provided or user-written checks to look for things such as:
•Ensuring compliance with installation-defined system and conventions. For example, you can ensure that user IDs are set up consistently based on the company’s requirements.
•Implement and confirm security compliance and audit. For example, ensure that installation-specific resources are protected properly.
•Check for configuration settings that changed since the last IPL to determine whether the change will be lost upon the next IPL. For example, compare the static content in Parmlib members used at IPL to the settings that are currently in effect.
•Detect changes, either those implemented dynamically or introduced by an IPL, that cause the system to diverge from the recognized best practice or your override. For example, you might have determined that the optimal setting for the WIDGET parameter in this system is 13. If a colleague changes that parameter to some other value without informing you or going through the normal change management process, a health check could inform you of the change.
Starting with z/OS V1R10, a new type of health check was introduced to exploit the IBM Health Checker for z/OS framework. Migration health checks help you determine the appropriateness of various migration actions:
•Before you migrate to the new z/OS release, you can use these new checks to assist with your migration planning.
•After you migrate, you can rerun these checks to verify that the migration actions were successfully performed.
These migration checks only report on the applicability of the specific migration actions on your current active system; they do not make any changes to the system.
IBM provides a rich set of checks. But in addition, other vendors, customers, and consultants can write and add their own check routines to IBM Health Checker for z/OS as shown in Figure 2-4. By utilizing the ability of these various components and products to detect potential problems, IBM Health Checker for z/OS allows you to avoid future problems by alerting you of their existence.
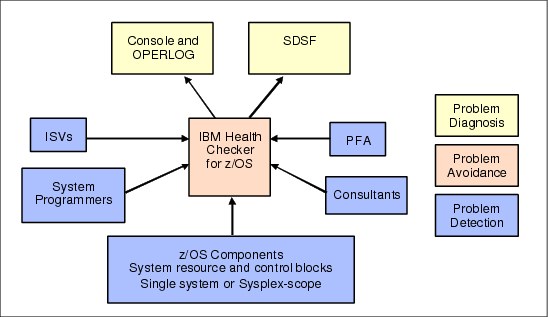
Figure 2-4 IBM Health Checker for z/OS
Details of IBM Health Checker for z/OS are well documented and not repeated here. For more information, see the IBM Redbooks document Exploiting the IBM Health Checker for z/OS Infrastructure, REDP-4590 and IBM Health Checker for z/OS, SA22-7994.
2.3.1 Getting the most out of IBM Health Checker for z/OS
The following tips explain how to use IBM Health Checker for z/OS to optimize your availability:
•Always start IBM Health Checker for z/OS automatically at IPL.
•Do not ignore the results of the migration checks.
•Investigate exceptions and take appropriate action. For example, do not simply change a configuration value without knowing why it should be changed.
– That said, the first time you start the Health Checker, you might get a large number of exceptions. The goal should be to eventually remove all exceptions by fixing the condition or by tuning the check so that it more accurately reflects the normal behavior of your system.
If the check cannot be changed to avoid the exception and you are sure that skipping this check will not expose system problems, you can deactivate it.
In either case, your objective should be that no exceptions are detected during normal operation.
•After your systems run with no exceptions, you are in an ideal position to know that a health check exception indicates something is abnormal.
•Automate exceptions issued by IBM Health Checker for z/OS:
– The messages produced by each check are documented together with the check in IBM Health Checker for z/OS, SA22-7994. Because a given check might vary in significance from one enterprise to another (or even one system to another), you can use the WTOTYPE and SEVERITY parameters for each health check to control how exceptions are presented.
•In an IBM GDPS® environment, the recommendations provided by GDPS might not be the same as those provided by z/OS. If there is a clash, use the value provided by GDPS value.
2.4 Runtime Diagnostics
What if a problem occurs on your system? Do you fear getting that phone call saying that something is wrong and you have no idea where to start looking? Is there a “bridge call” in your future and do you need an initial check of the system before attending it?
Starting with z/OS 1.12, the Runtime Diagnostics function is available to reduce the time needed to analyze and diagnose a problem and to reduce the experience level needed by the system operator. It provides timely, comprehensive diagnostics at a critical time period and suggests next steps for you to take to resolve the problem quickly.
Runtime Diagnostics was created as a joint design effort between IBM development and service organizations.
•IBM service personnel provided the expertise in knowing what types of symptoms they most often saw in diagnostic data, and the types of data that are most helpful when investigating system failures.
•IBM development personnel provided the expertise in knowing what types of symptom data component experts need when diagnosing problems, and the knowledge for creating this type of service tool within z/OS.
The goal of Runtime Diagnostics is to diagnose a failure in a timely manner and mimic the types of investigation that an experienced system programmer would do to help isolate the problem as quickly as possible.
•It looks for specific evidence of soft failures at the current point in time, with a goal of doing so in 60 seconds or less.
•It also provides recommendations for the next steps that the system programmer should take in the analysis, such as what to investigate further. However, it does not take any corrective action itself, because many of the recommended actions can be disruptive. For example, Runtime Diagnostics might recommend that jobs need to be cancelled.
As shown in Figure 2-5, Runtime Diagnostics obtains its data from OPERLOG, system control blocks, and system APIs. It perform no processing until explicitly invoked, and has minimal dependencies on system services when performing its diagnosis.
The Runtime Diagnostics output is called an event. A Runtime Diagnostics event is simply a multiline WTO that describes the event and the recommended actions to take. If you want the output to be directed to a sequential data set, you can do so by editing the HZR procedure that is shipped in SYS1.PROCLIB and modifying the HZROUT DD statement to point at a data set instead of DD DUMMY.
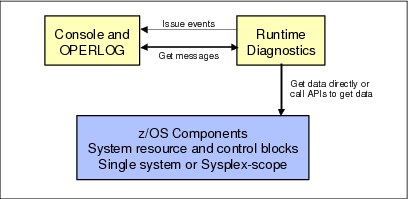
Figure 2-5 Runtime Diagnostics input and output
There are three categories of Runtime Diagnostics symptoms, all of which are shown in Figure 2-6. Runtime Diagnostics identifies problems in the following areas:
•Specific components through OPERLOG messages that are related to the component
•Global resource contention issues with enqueues, GRS-managed latches, and z/OS UNIX file system latches
•Address space execution issues by identifying high CPU usage, local lock suspension issues, and TCB loops.

Figure 2-6 Runtime Diagnostics detection types
2.4.1 Invoking Runtime Diagnostics
Depending on your release, there are differences in how you invoke Runtime Diagnostics:
•In z/OS 1.12, Runtime Diagnostics was a started task that you started when needed using the start hzr,sub=mstr command. When it completed its analysis, the task would end.
•In z/OS 1.13, Runtime Diagnostics became a long-running started task that is started with the same command used in z/OS 1.12. However, now it does not end until you issue a p hzr command. In z/OS 1.13, the Runtime Diagnostics started task will remain started, but will not do anything until you request it to run its diagnostics using the modify command: f hzr,analyze.
The reason that it is a long-running started task in z/OS 1.13 is because it needs to be available for PFA to invoke if PFA thinks a metric might be abnormally low, and to avoid startup and shutdown resource thrashing. The integration between Runtime Diagnostics and PFA is described in 2.5.8, “PFA and Runtime Diagnostics integration” on page 63.
If you want to target a system other than the home system for critical message detection and enqueue contention checking, you can use the SYSNAME parameter. In z/OS 1.12, this parameter is specified on the start command. In z/OS 1.13, this parameter is specified on the modify command.
Even though Runtime Diagnostics was first made available in z/OS 1.12, the targeted system can be at z/OS 1.11 or later and the diagnostics are still performed.
There is also a DEBUG parameter that takes dumps when different types of events are found, or when they are not found and you believe they should be. This parameter is specified on the start command in z/OS 1.12 and on the modify command in z/OS 1.13. It should only be used when the IBM service organization requests this information.
Runtime Diagnostics is not an automated process and is not a system monitor. Its intent is to be a quick, on-demand, diagnostics tool that you use when you believe a soft failure is occurring.
If you choose to automate calls to Runtime Diagnostics, such as invoking it every hour, it is likely that events will be issued even though you are not experiencing soft failures. Some of the events also occur when the system is behaving normally, but they are not a real issue unless you have noticed that the system is having problems. These events are probably not indicative of a system problem at that time and you might waste time investigating these events when no system problem is occurring. This point is especially true for the address space execution and global resource contention categories.
For more information about starting and controlling Runtime Diagnostics, refer to z/OS Problem Management, G325-2564.
2.4.2 Component analysis
Runtime Diagnostics searches OPERLOG for any occurrences of an IBM-defined list of messages that are deemed to be critical to system availability. These messages were identified by z/OS component experts from both IBM service and development as the types that when found, truly indicate a potential system problem. However, due to the volume of messages in the OPERLOG, they are difficult to detect because their occurrence is rare and requires an experienced system programmer to know which ones are critical. If any of these messages are found, an event is created.
Runtime Diagnostics looks back for one hour in the OPERLOG (if that much data is available). For some critical component messages detected by Runtime Diagnostics, additional diagnostics are done. For example, some related messages are grouped into a single event. Runtime Diagnostics also recognizes when a critical situation has been relieved. In some cases, it only shows the last message if a critical message for the same resource name is repeated with some frequency.
Do not expect to always find the full text of the message in the event. Rather, a summarized version that includes the message identifier, up to five lines of message text, and the recommended actions are created in the event. A list of the messages that Runtime Diagnostics detects can be found in z/OS Problem Management, G325-2564.
Figure 2-7 shows an example of the Runtime Diagnostics output for a critical message event.
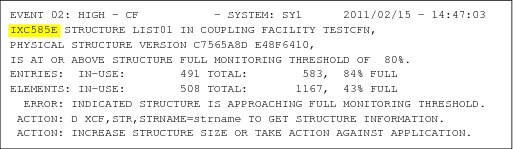
Figure 2-7 Runtime Diagnostics critical message event
Critical message detection is performed for the system for which Runtime Diagnostics was invoked, even when SYSNAME is not the system on which the command was run. That is, you can target any system in your sysplex that is at z/OS 1.11 or above and the critical message detection is performed for it if OPERLOG is available.
To minimize the CPU cost of scanning potentially millions of messages in the OPERLOG, Runtime Diagnostics only searches for messages that were issued on the system for which it was invoked. That is, you cannot use Runtime Diagnostics to search the OPERLOG for all systems in the sysplex with one command. To have critical message detection performed for all systems in the sysplex, the command would have to be issued for each system separately.
|
Tips for critical message detection:
•OPERLOG must be active.
•The list of messages for which OPERLOG is searched is a hardcoded list defined by IBM and cannot be modified.
•OPERLOG is searched back one hour from the current time (if available).
•The Runtime Diagnostics event contains a summary of the message and the recommended actions.
•Some messages are grouped into one event that describes a single problem symptom.
•The detection is performed on the system specified in the SYSNAME parameter. If SYSNAME was not specified, the detection will be performed on the system that the command was issued on.
|
For a list of the messages for which Runtime Diagnostics creates events, refer to z/OS Problem Management, G325-2564.
2.4.3 Global resource contention
Runtime Diagnostics detects three types of global resource contention, as explained here.
Enqueue contention for system address spaces
This type of event is created when a system address space is waiting for an enqueue for more than five seconds.
Runtime Diagnostics has a hardcoded list of system address spaces for which enqueue contention could mean that a system failure is occurring. You cannot modify this list of address spaces.
The checking performed by Runtime Diagnostics to detect enqueue contention is equivalent to invoking the D GRS,AN,WAITER command. The event is created when a waiter is found that has been waiting for more than five seconds. No event is created for blockers that exist on this system because the blocker is listed in the event along with the waiter’s information.
Figure 2-8 shows a sample enqueue contention event. Notice that the event shows both the waiter and the blocker ASID, job name, and the system name, along with other diagnostic information.

Figure 2-8 Runtime Diagnostics enqueue contention event
Enqueue contention checking is performed for the system for which Runtime Diagnostics was invoked. That is, you can target any system in your sysplex that is at z/OS 1.11 or above.
|
Tips for enqueue contention detection:
•The address space must be in the list of system address spaces as defined by Runtime Diagnostics. This list cannot be modified.
•The address space must be waiting for an enqueue for at least five seconds.
•The detection is performed on the system specified in the SYSNAME parameter, or on the home system if SYSNAME was not specified.
|
GRS-managed latch contention
Contention checking for GRS-managed latches is available starting with z/OS 1.13. A GRS latch contention event is created when any address space has been waiting for a latch for more than five minutes.
Latch contention information is obtained directly from GRS by the use of GRS APIs. z/OS UNIX System Services file system latches are omitted from this category because they have their own category (this is described in “z/OS UNIX System Services file system latch contention” on page 38).
Figure 2-9 shows an example of a GRS latch contention event. The “top waiter” is the address space that has been waiting the longest for the latch set. The recommended action is circled.
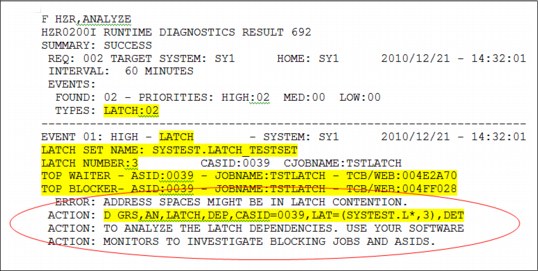
Figure 2-9 Runtime Diagnostics GRS latch contention event
|
Tips for GRS latch contention detection:
•This function is available starting with z/OS 1.13.
•The event is created for any address space waiting for a latch for more than five minutes.
•Contention in z/OS UNIX System Services file system latches are handled separately.
•The top waiter is the address space that has been waiting for the latch set the longest.
|
z/OS UNIX System Services file system latch contention
Also new in z/OS 1.13 is z/OS UNIX System Services file system latch contention checking. An OMVS event is created when threads have been waiting for more than five minutes in z/OS UNIX System Services.
These types of latches are separated from the GRS-managed latch contention events because additional processing is performed to determine the specific source of the contention.
The normal action to take when this type of event occurs is to issue a D OMVS,W,A command to determine the ASID and the job names of the waiters to investigate (this is circled in the example event shown in Figure 2-10).
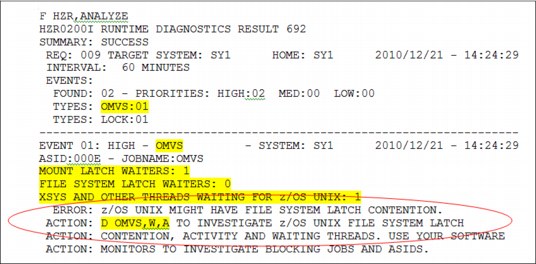
Figure 2-10 Runtime Diagnostics z/OS UNIX Latch contention event
|
Tips for z/OS UNIX System Services file system latch contention detection:
•This function is available starting with z/OS 1.13.
•The event is created when a thread in any address space is waiting for a UNIX System Services latch for more than five minutes.
•The normal action to take is to issue the D OMVS,W,A command.
|
2.4.4 Address space execution
Runtime Diagnostics provides three types of checking to determine whether execution within any address space is behaving abnormally such that it might cause a soft failure.
CPU analysis
The Runtime Diagnostics CPU analysis is a point-in-time inspection to determine whether any task is using more than 95 percent of the capacity of a single CPU. This level of CPU consumption might indicate that the address space is in a loop.
The analysis is performed by taking two snapshots one second apart to calculate the percentage of CPU used based on the capacity of a single CPU within the LPAR. It is possible for the usage reported to be greater than 100 percent if the address space has multiple TCBs and several of the TCBs are individually using a high percentage of the capacity of a single CPU.
When a high CPU event and a loop event occur for the same job, there is high probability that the task in the job is in a loop in which case the normal corrective action is to cancel the job.
Figure 2-11 shows an example of a high CPU event created by Runtime Diagnostics.
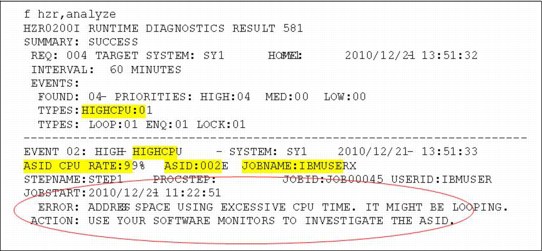
Figure 2-11 Runtime Diagnostics High CPU event
|
Tips for CPU analysis:
•Two snapshots are taken one second apart.
•If any task is using more than 95 percent of a single CPU, a high CPU event is created.
•The event might show usage greater than 100 percent.
•A high CPU event combined with a loop event for the same job usually indicates the job is truly in a loop.
|
Local lock suspension
Local lock suspension analysis is a point-in-time check of local lock suspension for any address space.
Runtime Diagnostics calculates the amount of time an address space is suspended waiting for the local lock. If an address space is suspended more than 50 percent of the time waiting for a local lock, Runtime Diagnostics creates a lock event for that address space.
Figure 2-12 shows an example of a local lock suspension event.
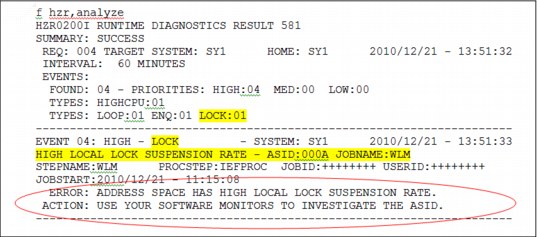
Figure 2-12 Runtime Diagnostics local lock suspension event
|
Tip for local lock suspension analysis:
•If an address space is suspended for more than 50 percent of the time, a high local lock suspension rate event is created.
|
TCB loop detection
Runtime Diagnostics looks through all tasks in all address spaces to determine whether a task appears to be looping.
Runtime Diagnostics does this by examining various system information for indicators of consistent repetitive activity that typically appears when a task is in a loop.
When a high CPU event and a loop event occur for the same job, there is a high probability that the task in the job is in a loop, in which case the normal corrective action is to cancel the job.
Figure 2-13 shows an example of a high CPU event and a loop event for the same job.
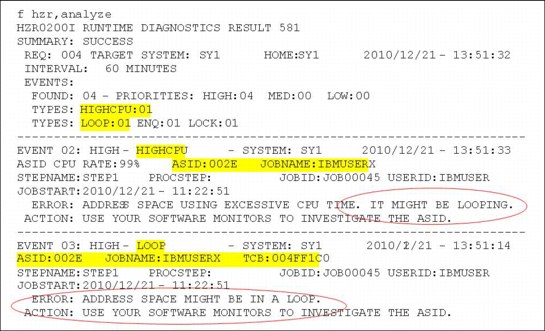
Figure 2-13 Runtime Diagnostics High CPU event and loop e vent
|
Tips for TCB loop detection:
•The analysis is done for all tasks in all address spaces.
•A high CPU event combined with a loop event for the same job usually indicates that the job is truly in a loop.
|
2.5 Predictive Failure Analysis
Most experienced IT professionals have probably encountered many examples of soft failures. Consider the following example: a common transaction that rarely fails hits a glitch that causes it to fail more frequently. The recovery code in the underlying component is normally successful and applications continue to work even though the problem is occurring. The system programmer has not noticed or has not been notified that something is amiss.
By the time the system programmer is notified, there have been multiple failing transactions and the system has become heavily loaded. Recovery continues to occur, but it slows down the transaction manager to the point that completely unrelated transactions start experiencing time-outs.
Although this example is hypothetical, it shows that if a soft failure like the one described occurs, it needs to have some external symptoms before the system programmer can start to take corrective action.
2.5.1 Predictive Failure Analysis overview
The goal of predictive analysis and early detection is to notify the system programmer as soon as the system becomes aware that a problem is occurring. Predictive Failure Analysis (PFA) detects problems before they are visible externally by checking resources and metrics at different layers of the software stack that can indicate that resource exhaustion, damage to address spaces, or damage to the system could be occurring by comparing existing metric values to trends for the LPAR.
PFA is not intended to find problems that will bring the system down the instant they start. Rather, it can detect potential problems on a human-time scale.
Various of the metrics that PFA uses in its analysis are closer to the hardware, and others are closer to the application. It is easier for PFA to detect an error that is close to the hardware. The closer the metric is to the application, the more difficult it is to determine whether this is really a soft failure or simply an anomaly due to a workload change.
Figure 2-14 on page 43 shows how PFA fits into z/OS:
•PFA obtains its data from z/OS control blocks and published programming interfaces.
•It collaborates with Runtime Diagnostics when it thinks that some metric has an abnormally low value to determine whether this really represents a problem. This is a new capability that was delivered in z/OS 1.13. For more information about this capability, refer to “PFA and Runtime Diagnostics integration” on page 63.
•Finally, it sends the results to IBM Health Checker for z/OS, which issues the message as a WTO if necessary and makes the output viewable in SDSF.
Details about PFA processing and integration are provided in the following sections. All documentation related to PFA (including installation steps, management, and usage) is contained in z/OS Problem Management, G325-2564.
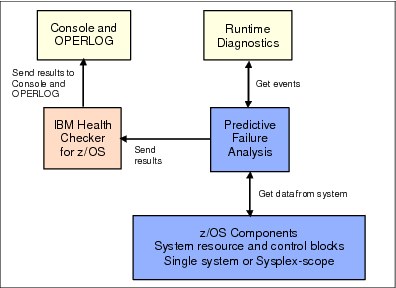
Figure 2-14 PFA input and output
2.5.2 Types of abnormal behavior detected
After the review of many soft failures on clients' systems, it was determined that there are four common reasons why a system has stopped functioning:
•Damaged address space or system
The indication of a damaged system is typically when there are recurring or recursive errors somewhere in the software stack.
•Serialization problems
Serialization problems are most often caused by priority inversion, classic deadlocks, and owner-gone scenarios.
•Physical or software resource exhaustion
Exhaustion of a shared and finite system resource.
•Indeterminate or unexpected states
PFA focuses on the damaged address space or system and the resource exhaustion categories.
PFA uses historical data together with machine learning and mathematical modeling to detect abnormal behavior and the potential causes of this abnormal behavior. It also predicts whether exhaustion of certain finite resources will occur if the current trend continues.
PFA’s objective is to convert soft failures to correctable incidents by alerting you as soon as it detects that a problem might be occurring or predicts that one will occur in the future.
PFA does not use hardcoded thresholds to determine abnormal behavior. Rather, it collects the data from the system and models it to determine what is normal for that system and what kinds of resource usage trends are occurring. It then uses advanced algorithms in conjunction with configurable values for sensitivity to determine whether an abnormal condition exists or whether the current trend indicates future exhaustion.
There are three types of abnormal behavior detection that PFA's algorithms incorporate:
Future prediction This processing performs trend analysis and models the behavior into the future to predict whether the current trend will exhaust a common resource.
Expected value This processing performs trend analysis and models the behavior to determine what value should be expected at the current time to determine whether an abnormal condition is occurring.
Expected rate This processing performs trend analysis and models the behavior to determine whether the current rate, when compared to rates for multiple time periods, indicates that an abnormal condition is occurring. The rate is often calculated by normalizing the value of the metric being analyzed by the CPU being used. By using a normalized rate and comparing against multiple time period predictions, normal workload changes do not appear as abnormal conditions.
For both the expected value and the expected rate types of predictions, PFA clusters the historical data so that trends within the data can be identified. It then determines which trend is currently active and uses the prediction for that trend in its comparisons.
|
Tip: PFA does not take the time of day or the day of the week into account when comparing current values to projections of what the current values should be. However, by using CPU consumption to normalize its rate metrics, it effectively takes into account whether the system is busy or quiet. In practice, this has been found to be effective and negates the need to take time or day into account when creating its model of system behavior.
|
2.5.3 PFA and IBM Health Checker for z/OS integration
It is important to understand the relationship between IBM Health Checker for z/OS and PFA so that you can fully benefit from IBM Health Checker for z/OS and PFA integration.
PFA exploits the remote check feature of the IBM Health Checker for z/OS framework to control the scheduling of the PFA checks and to present the results back to the operator. Therefore, the commands, SDSF health check interface, and reporting mechanism available through IBM Health Checker for z/OS are fully usable by the PFA checks.
Figure 2-15 on page 45 shows the flow of PFA processing to and from IBM Health Checker for z/OS. Each step is described separately in 2.5.4, “PFA processing” on page 46.
Information about the IBM Health Checker for z/OS can be found in the IBM Redpaper™ Exploiting the IBM Health Checker for z/OS Infrastructure, REDP-4590, and in IBM Health Checker for z/OS, SA22-7994.
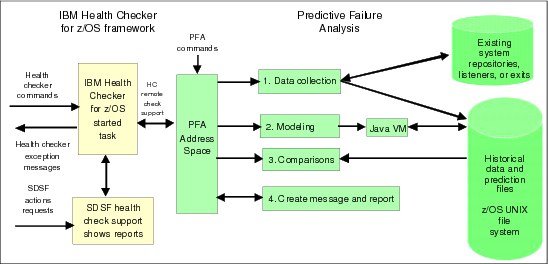
Figure 2-15 PFA and IBM Health Checker for z/OS integration
If IBM Health Checker for z/OS is not active prior to PFA starting, PFA collects data and creates predictions as usual, but waits for IBM Health Checker for z/OS to start before performing comparisons or issuing results. This is because those functions are dependent on IBM Health Checker for z/OS.
If IBM Health Checker for z/OS is not available when it is started, PFA uses the default configuration values such as COLLECTINT and MODELINT. These values can be overridden by parameters you specify in IBM Health Checker for z/OS, but that depends on IBM Health Checker for z/OS being available. An example of the HZSPRMxx statements that you use to change the COLLECTINT are shown in Example 2-1.
Example 2-1 Sample HZSPRMxx statements to modify a PFA check
/* */
/*-------------------------------------------------------------------*/
/* Sample PFA override */
/*-------------------------------------------------------------------*/
/* */
ADD POLICY UPDATE CHECK(IBMPFA,PFA_COMMON_STORAGE_USAGE)
ACTIVE
PARMS=('COLLECTINT(10)')
DATE(20120827)
REASON('Update collection interval')
You can use the health check commands both to display and modify the PFA checks. Unlike other health checks, the PFA checks allow you to modify their parameters individually and accumulate the changes rather than requiring all parameters to be specified when modifying a check. This feature allows you to change one parameter without needing to remember the settings for all the others.
For example, to change only the STDDEV parameter of the JES spool usage check and set it to 6, issue the following command:
f hzsproc,update,check(ibmpfa,pfa_j*),parm(‘stddev(6)’)
|
Display all parameters and obtain status of PFA checks: IBM Health Checker for z/OS is unaware of the cumulative nature of the PFA checks’ parameters. Therefore, if you display a PFA check using the IBM Health Checker for z/OS modify command to display details, or you look at the parameters in the reports, only the parameters that were last modified are displayed.
To properly display all the parameters and to obtain the status of the PFA checks, use the PFA MODIFY command with the display details option such as shown:
f pfa,display,check(pfa_*),detail
Variations of the MODIFY PFA command and a description of the parameters can be found in z/OS Problem Management, G325-2564.
|
The results of PFA’s comparisons are sent to IBM Health Checker for z/OS, which writes the report. If an exception occurs, a WTO is issued by default. You can configure the type of message issued when an exception occurs by changing the check’s SEVERITY or WTOTYPE in IBM Health Checker for z/OS.
2.5.4 PFA processing
PFA contains check-specific code that collects the data for an individual check; creates a prediction; and compares the current values to an internal value created by PFA using the current predictions, domain knowledge, and customer-configurable parameters that adjust the sensitivity of the comparisons.
Depending on the result of the comparison, PFA uses the remote check support with IBM Health Checker for z/OS to issue an exception or informational message and to create a report in SDSF. Some of these functions are written in Java and therefore are eligible to run on a zAAP if the system is configured with one (see 2.5.9, “Achieving maximum benefit from PFA” on page 65 for more information).
Data collection
Data is collected for each check by interrogating system control blocks or using externally available interfaces such as APIs, ENF listeners, and dynamic exits. Data collection (shown in Figure 2-16 on page 47) occurs as follows:
1. Data collection occurs asynchronously on an interval that you can configure (although it is not anticipated that changing it will be necessary). For example, the default value for the data collection function for a check might be to collect data every fifteen minutes. This parameter is called COLLECTINT.
2. The data is stored in files in the z/OS UNIX file system. Data that is deemed by PFA to be too old for use in making new predictions is automatically deleted by PFA.
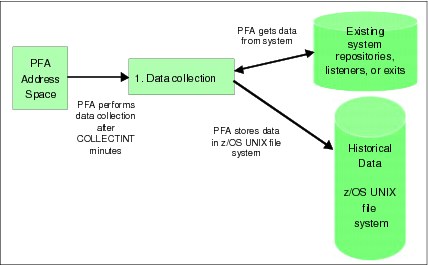
Figure 2-16 PFA data collection processing
Modeling
The data collected in the first step is modeled asynchronously to create predictions for the current trends.
Depending on the type of check, the result of the modeling might be a value that is predicted to occur in the future based on the current trends, or it might be a value that is expected at this point in time based on the current trends.
When the prediction is an expected value, PFA clusters the data into appropriate parts based on the historical values to determine workload differences within the data and creates predictions for each cluster. It then chooses which cluster’s prediction to use in the comparisons.
For expected rate comparisons over time, PFA creates predictions for multiple time ranges and then determines which time range predictions should be applied during the comparison. By performing this clustering and creating multiple predictions, PFA can better detect workload changes which otherwise will lead to unwarranted exceptions.
Modeling (shown in Figure 2-17 on page 48) occurs as follows:
•Modeling occurs asynchronously on an interval that you can control (although it is not anticipated that changing it will be necessary). For example, the default value for the modeling interval for all checks (starting in z/OS 1.12) is to run every twelve hours. This is controlled by the MODELINT parameter.
•When PFA starts, the first prediction is created after the check has determined that there is enough data to make a prediction, rather than necessarily waiting for the MODELINT number of minutes.
– For some checks, the first prediction is created seven hours after PFA starts as follows:
If PFA started at IPL, the first hour’s worth of data (when everything is in startup mode) is discarded so that it does not skew the prediction. If PFA started more than an hour after the IPL, data collection can begin immediately. This reduces the wait time for the first prediction from seven hours to six hours.
PFA then performs data collection for six hours (or the MODELINT number of minutes if it is less than six hours) and the first prediction is created. Subsequent predictions in a stable environment occur every twelve hours thereafter.
– For other checks, the first prediction is created thirteen hours after PFA starts.
The checks that first create a prediction thirteen hours after PFA starts are those that need a warm-up period to detect which jobs to track individually.
If PFA started at IPL, the first hour’s worth of data is discarded so that it does not skew the results of the warm-up. If PFA started more than an hour after IPL, data collection for the warm-up can begin immediately, thereby reducing the wait time for the first prediction from thirteen hours to twelve hours.
PFA then collects data for six hours for the warm-up, after which PFA determines the address spaces with the highest rates to track individually.
After the address spaces are properly categorized, PFA collects data for six hours (or the MODELINT number of minutes if it is less than six hours) and the first prediction is created. Subsequent predictions in a stable environment are made every twelve hours thereafter.
•Modeling runs when it is determined that it is time to update the model with new predictions based on the configured value. It can also run dynamically when PFA determines that the model might be too old to make accurate comparisons because the trend is changing.
•PFA requires at least four successful collections before modeling is attempted.
•The results of the modeling are stored in files in the z/OS UNIX file system. PFA automatically deletes files when they are no longer required.
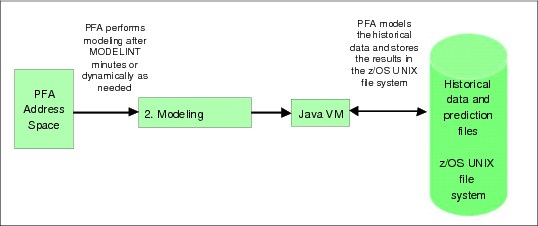
Figure 2-17 PFA modeling processing
|
Important points about PFA modeling:
•Modeling is done in Java and is zAAP eligible. It is strongly advised to offload PFA’s Java processing to a zAAP.
•Even though the MODELINT value is configurable, you cannot force PFA to model at a specific time of day due to the fact that PFA models more frequently when your system is unstable to ensure that the model is current. When the system stabilizes, PFA resumes using the specified MODELINT value.
|
Comparisons
PFA performs the comparisons needed to determine whether an exception is to be issued. It compares what is currently occurring on the system to what was predicted by applying mathematical algorithms based on statistics and z/OS domain knowledge (information known about z/OS from experience) and by incorporating the user-defined parameters allowed for the check1. These algorithms determine whether the current values are abnormal, becoming abnormal, or everything is working fine.
If PFA determines the trend is abnormal or becoming abnormal, the comparison step might cause the check to create a new prediction before the next scheduled modeling interval.
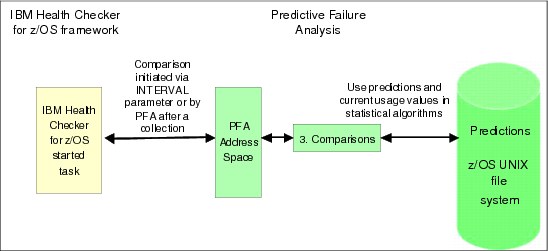
Figure 2-18 PFA comparison processing
For some checks, comparisons are initiated by IBM Health Checker for z/OS when the number of minutes specified in the INTERVAL parameter for the check is reached. For other checks, the comparisons are performed at the end of every collection rather than using the INTERVAL parameter in IBM Health Checker for z/OS.
|
Important points about PFA comparisons:
•If the value of the INTERVAL parameter in IBM Health Checker for z/OS is set to ONETIME for a PFA check, it is a check that runs after every collection. Do not change this setting. If you do, the comparison uses the data collected at the last collection rather than retrieving new current usage data.
•Even though IBM Health Checker for z/OS allows you to run a health check on demand by using IBM Health Checker for z/OS interfaces, it is best to allow PFA to run the checks when PFA determines it is time for the comparisons to be performed.
When a check is run manually that has the INTERVAL parameter set to ONETIME, message HZS0400I is issued with message AIR023I embedded. You can display the current INTERVAL value by using the SDSF CK command and scrolling to the right to the column titled “INTERVAL.”
|
For each check, configuration parameters are available that affect the results of the check by changing the sensitivity of the comparisons. For further details about how to tune PFA comparison algorithms, see 2.5.9, “Achieving maximum benefit from PFA” on page 65.
Send results and alert the operator
For each comparison (regardless of whether the comparison resulted in an exception, or everything is working normally), PFA creates a report with the current data and predicted data. The report is only accessible by using the SDSF CK function and selecting the PFA check you are interested in.
1. Details specific to the exception are provided in the report to aid in your investigation. For example, if PFA issued the exception for comparisons done for specific address spaces, only those address spaces are listed on the report.
2. IBM Health Checker for z/OS issues message HZS000na with the PFA message (AIRHnnnE) embedded in it based on the SEVERITY and WTOTYPE settings of the check. This message goes to the system log and therefore is visible to your automation software.
3. Future WTOs for the same exception are suppressed until new data is available.
4. A directory is created with the data needed for IBM service to investigate the exception in cases where you believe the exception was unwarranted. Some of this information might be useful in your investigation as well.
The data is written to a subdirectory of the PFA check’s directory and is named EXC_timestamp, where the time stamp contains the date and time the exception occurred. A maximum of 30 directories per check are kept. When more are required, the oldest directory is deleted.
5. Modeling might occur more frequently until the data stabilizes.

Figure 2-19 PFA sends results to IBM Health Checker for z/OS
2.5.5 PFA reports
Figure 2-20 shows an example of a PFA report for the Message Arrival Rate check. When applicable, PFA reports have the following three parts:
•Heading information
This information includes the status and configuration of the collections and the models.
•System-level information
This information includes the current values and predictions for the total system.
•Address space information
This information includes details for address spaces that PFA is tracking, address spaces for which the exception was issued, or address spaces that might be the cause of the problem.
The report is accompanied by IBM Health Checker for z/OS information and the message that was issued.
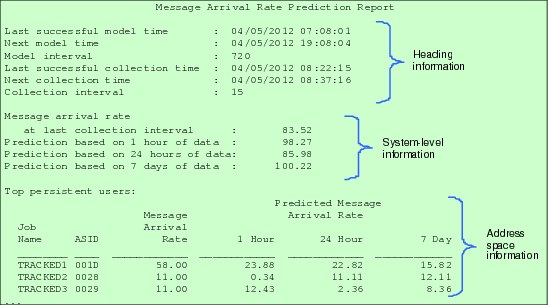
Figure 2-20 PFA Message Arrival Rate Prediction Report
2.5.6 PFA checks
This section summarizes the PFA health checks and provides details about their execution. Other information about PFA checks such as example reports, file descriptions, best practices, and so on can be found in z/OS Problem Management, G325-2564.
With z/OS 1.13, there are six PFA health checks. One check detects resource exhaustion. The other five checks detect a damaged address space or system. Three of those checks can also detect a hung address space or system. A summary of the checks, what each detects, the type of analysis each uses, and the release each is available is shown in Table 2-1 on page 52.
Table 2-1 PFA checks
|
Resource or metric
|
Causes detected
|
Type of analysis
|
Release
|
|
Common storage usage
|
Detects resource exhaustion in common storage by looking for spikes, leaks, and creeps.
|
Future prediction
|
1.10
SPE
|
|
LOGREC record arrival rate
|
Detects a damaged address space or system.
|
Expected rate
|
1.10
SPE
|
|
Console message arrival rate
|
Detects a damaged or hung address space or system based on an abnormal rate in the WTOs and WTORs issued, normalized by the amount of CPU being used.
|
Expected rate
|
1.11
|
|
SMF record arrival rate
|
Detects a damaged or hung address space or system based on an abnormal rate of SMF record arrivals, normalized by the amount of CPU being used.
|
Expected rate
|
1.12
|
|
JES spool usage
|
Detects a damaged persistent address space based on an abnormal increase in the number of track groups used.
|
Expected value
|
1.13
|
|
Enqueue request rate
|
Detects a damaged or hung address space or system based on an abnormal rate of enqueue requests, normalized by the amount of CPU being used.
|
Expected rate
|
1.13
|
|
Apply the PTF for APAR OA40065: If you are familiar with PFA, you might have noticed that the check for frames and slots usage (PFA_FRAMES_AND_SLOTS_USAGE) was omitted from Table 2-1. This check has been permanently removed from PFA with APAR OA40065 because it caused unwarranted exceptions that could not be avoided with the available mechanisms.
It is advisable to apply the PTF for APAR OA40065 as soon as possible. To remove the check from PFA prior to applying the PTF, use the following IBM Health Checker for z/OS command:
f hzsproc,delete,check(ibmpfa,pfa_f*)
|
PFA is not an address space monitor. Rather, PFA attempts to detect when abnormal activity on the system could lead to a system outage and alert the operator before the system crashes or hangs.
Notice in Table 2-1 that the only check looking for any type of resource exhaustion and using a future prediction is the one that checks for common storage exhaustion. Sometimes, clients are puzzled by the fact that the JES Spool Usage check does not detect exhaustion of track groups.
So, it is important to understand that the JES Spool Usage check is not looking at spool usage from the perspective of warning you when the spool starts to fill (JES2 already has messages that provide that information). Instead, it is looking for damaged persistent address spaces by detecting that an address space is using an abnormal number of track groups compared to what it normally uses. An address space that is increasing the number of track groups it uses at a rate significantly higher than it normally uses might be creating a large job log or might be in a loop, even if it is not exhausting the number of track groups available.
Common storage usage check
The PFA_COMMON_STORAGE_USAGE check is designed to detect future common storage exhaustion.
This check performs trend analysis to determine whether the current usage of common storage will exhaust common storage in the future. It does not detect when the common storage usage reaches a certain threshold, such as the percentage used compared to its available capacity.
For example, you might receive an exception for storage exhaustion even though only 53 percent of the available storage is currently being used. This is because PFA has determined that you will exhaust the storage in the future, based on your current trend. This early detection allows you to take action before your system starts behaving abnormally.
The example in Figure 2-21 shows an instance of how the current usage trend of SQA was fairly stable and was running at a fairly high percentage of used SQA compared to the capacity. However, the usage then started to increase such that if the new trend continued, SQA exhaustion would have occurred. The system overflows SQA into CSA eventually, but it was not yet doing so and the trend could have clearly indicated a problem on the system.
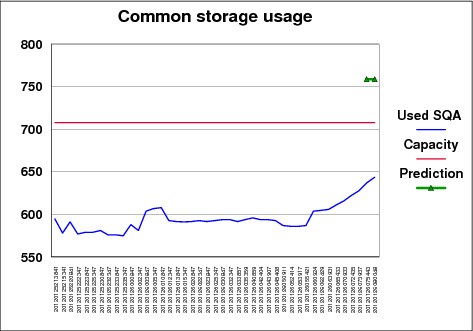
Figure 2-21 PFA Common Storage Usage Check example
In this example, the following sequence occurred:
1. The SQA capacity was 708 KB.
2. For about eight hours, the SQA usage hovered around 600 KB, which is about 85 percent of capacity.
3. Then, for about two hours, the trend started to gradually increase.
4. A new prediction was created after the last collection that detected, based on the current trend, that SQA usage would increase to 759 KB in the next six hours, which was well beyond the capacity.
5. Five minutes later, the current usage was continuing its upward trend and was then at 644 KB. At that point, the exception was issued.
Therefore, when usage was stable, even though it was rather high, the predictive trending indicated no problem would occur. However, when the usage started to steadily increase, the predictive trending indicated it would exceed the available capacity. The continued upward trend caused an alert to be issued to the operator.
PFA also applies z/OS domain knowledge in its comparison algorithms. That is, it knows at what usage level most systems tend to have soft failures for each storage location, and knows to issue exceptions for some locations earlier than others.
The common storage usage check also understands storage expansion from one location to another. If storage expands from SQA into CSA, it is included in the CSA usage, and predictions and comparisons for SQA are not performed. Similarly, when storage expands from ESQA into ECSA, it is included in the ECSA usage and predictions. Comparisons for ESQA are never performed (starting with APAR OA38279) because expansion into ECSA always occurs and such expansion does not cause system problems. This category is still tracked and modeled separately for your reference.
This check cannot detect exhaustion caused by fragmentation or rapid growth such as exhaustion that occurs within a collection interval or on a machine-time scale.
Also, this check does not monitor individual address spaces so it does not detect a storage leak in an individual address space unless that leak can result in storage exhaustion for the entire system.
When an exception occurs, it is not typically the address space that is using the most common storage that is the cause of the problem. Rather, it is the address space whose usage has increased the most recently.
Therefore, the exception report lists the top address spaces whose usage has increased the most in the last hour along with their current usage, and a prediction based on their trends (although comparisons are not performed using these values). If *SYSTEM* is listed, no attempt is made to determine the current usage due to performance considerations and UNAVAILABLE is displayed.
|
PFA_COMMON_STORAGE_USAGE check:
•This check requires that the following DIAGxx parmlib member options are set: VSM TRACK CSA(ON) SQA(ON)
•When an exception occurs, refer to the best practices defined for this check in z/OS Problem Management, G325-2564.
|
LOGREC arrival rate
The PFA_LOGREC_ARRIVAL_RATE check is designed to detect a potentially damaged address space or system based on the LOGREC arrival rate being too high. The rate produced by this check is the number of LOGREC record arrivals within the collection interval grouped by key. The key groupings are LOGREC records for key 0 by itself; keys 1 through 7 as a group; and keys 8 through 15 as a group.
This check models the expected number of LOGREC records by key for four time ranges: 1 hour, 24 hours, 7 days, and 30 days. This check does not use the CPU consumption to normalize the arrival rate. The reason for this is that it assumes that a completely healthy system will not create any LOGREC records, no matter how busy it is. So, any number of LOGREC records greater than zero is considered to be “bad”.
The check models the number of LOGREC records that are normally created by this system over each hour, day, week, and 30 days. This information is then used to detect changes in the record creation rate because this check assumes that an abnormal number of LOGREC records being created is highly likely to indicate a damaged address space.
Any one of the key groupings within any one of the time ranges can produce an exception. When a time range does not have enough data available for the entire time period, it is not included on the PFA report.
PFA is made aware every time a new LOGREC record is created, and it keeps a running count of the number of records created over the last x minutes. When a collection occurs, the current count is saved in the PFA files.
This check is somewhat unique when compared to the other “expected rate” checks in that it does not run after every collection. Instead, it runs whenever it is scheduled by the IBM Health Checker for z/OS, based on the INTERVAL value for the check. When the check is scheduled, it uses the current count of LOGREC records created over the last x minutes, where x is the collection interval value, not the value as it existed at the end of the last collection interval. This ensures that the check is always working with the latest information. For example:
•The time of the last collection was 8:00 a.m. (this data is collected for the time period 7:00 a.m. to 8:00 a.m. because COLLECTINT is 60).
•The time of the next comparison is 8:45 a.m. (every 15 minutes, because the INTERVAL is set to 15).
•The LOGREC record arrival rate used in the comparison is the arrival rate from 7:45 a.m. to 8:45 a.m.
This check does not look for individual LOGREC records, patterns of LOGREC records, or bursts of failures unless that burst is within a key grouping.
This check supports the ability to exclude address spaces that issue LOGREC records erratically by allowing you to define them in the PFA_LOGREC_ARRIVAL_RATE/config/EXCLUDED_JOBS file. This feature is especially useful when address spaces are not production-ready and create many LOGREC records on an irregular basis, or when address spaces that issue LOGREC records in a regular fashion are stopped and started frequently.
|
PFA_LOGREC_ARRIVAL_RATE check:
•The record must be a software LOGREC record with a usable SDWA to be counted as an arrival.
•z/OS LOGREC provides two options for the LOGREC recording medium: a System Logger log stream, or the LOGREC data set.
When a LOGREC record is produced, PFA is notified through an ENF listener. If you are writing a LOGREC record to the LOGREC data set and that data set fills up, PFA stops getting notified when a LOGREC is produced.
Therefore, for the best reliability, use the log stream method.
•If you change the COLLECTINT, perform the following steps to ensure that the values being modelled in the check remain consistent:
– First, stop PFA.
– Next, delete the files in the PFA_LOGREC_ARRIVAL_RATE/data directory.
– Finally, restart PFA.
•If an exception occurs, refer to the best practices in z/OS Problem Management, G325-2564.
|
Frames and slots usage
As noted in the label box Apply the PTF for APAR)A40065 on page 52, the PFA_FRAMES_AND_SLOTS_USAGE check has been permanently removed from PFA.
Message arrival rate
The PFA_MESSAGE_ARRIVAL_RATE check detects a potentially damaged address space or system based on the message arrival rate being higher or lower than expected. Messages included in the count of arrivals are single line and multi-line WTO and WTOR messages. Multi-line WTO messages are counted as one message. Branch Entry WTO messages are not counted. Messages are counted prior to being excluded or modified by other functions such as message flood automation.
The message arrival rate is a simple ratio calculated by dividing the number of arrivals in the collection interval by the CPU time used in that same collection interval.
This check does not track the message by individual message identifier, and therefore is not designed to detect abnormal message patterns or single critical messages.
The message arrival rate check performs its comparisons after every collection rather than being scheduled by the IBM Health Checker for z/OS INTERVAL parameter. By performing the check automatically upon successful completion of a collection, the check is able to compare the most recent arrivals with the predictions modeled at the last modeling interval. This design increases the validity of the check itself and the responsiveness of the check to the current activity of the system. Even though it can be run manually using IBM Health Checker for z/OS interfaces, there is no benefit because doing so only repeats the last comparison.
The message arrival rate check creates models and performs comparisons for time ranges based on 1 hour of data, 24 hours of data, and 7 days of data. If the amount of data is not available, the total system rate line for that time range is not printed on the report and UNAVAILABLE is printed for the individual address spaces for that time range.
|
PFA_MESSAGE_ARRIVAL_RATE check: So that address spaces that produce erratic numbers of messages do not skew the predictions, the following exclusions are done:
•The CONSOLE address space is excluded from this check’s processing. This behavior cannot be changed.
•Any address space that starts with “JES” is excluded from this check’s processing by default through the PFA_MESSAGE_ARRIVAL_RATE/config/EXCLUDED_JOBS file. This behavior can be changed, but is not suggested.
|
For guidance about what to do when an exception occurs for a rate that is too high, refer to 2.9.5, “PFA message arrival rate check exception issued for a high rate” on page 91.
If an unexpectedly low message arrival rate is detected, examine the report in SDSF for details about why the exception was issued. Use the Runtime Diagnostics output in the report to assist you in diagnosing and fixing the problem. Also, refer to 2.9.6, “PFA exception issued for a low rate” on page 92.
SMF arrival rate
The PFA_SMF_ARRIVAL_RATE check detects a potentially damaged address space or system based on the SMF record arrival rate being higher or lower than expected. The check’s metric is the rate derived from the count of the SMF arrivals per the amount of CPU used in the interval.
If SMF is not active, this check is not processed and a WTO message is issued.
The SMF arrival rate check is not designed to detect performance problems caused by insufficient resources, a faulty WLM policy, or spikes in work. However, it might help to determine whether a performance problem detected by a performance monitor is caused by a damaged system.
This check does not detect abnormal SMF patterns or individual types of SMF records.
If SMF is stopped and restarted across a collection interval, PFA detects this change and automatically deletes the previously collected data and re-enters the warm-up phase to detect which jobs to track.
|
PFA_SMF_ARRIVAL_RATE check: If a change to your SMF definitions would result in a significant change in the number of SMF records being produced, it is advisable to do the following:
1. Stop PFA.
2. Delete the files in the PFA_SMF_ARRIVAL_RATE/data directory.
3. Restart PFA.
This ensures that PFA does not use the previously collected data in the models so that the models accurately reflect the new configuration.
|
If an unexpectedly high SMF record arrival rate is detected, review the SMF records sent by the address spaces identified on the report and examine the system log to determine what caused the increase in SMF activity. Also, refer to 2.9.7, “PFA exception issued for a high SMF arrival or high ENQ request rate” on page 92.
If an unexpectedly low SMF record arrival rate is detected, examine the report in SDSF for details about why the exception was issued. Use the Runtime Diagnostics output in the report to assist you in diagnosing and fixing the problem. Also, refer to 2.9.6, “PFA exception issued for a low rate” on page 92.
The SMF arrival rate performs its comparisons after every collection rather than being scheduled through the IBM Health Checker for z/OS INTERVAL parameter. By performing the check automatically upon successful completion of a collection, the check is able to compare the most recent arrivals with the predictions created at the last modeling interval. This enhances both the validity of the comparisons and the responsiveness of the check to the current activity of the system. Even though it can be run manually using IBM Health Checker for z/OS interfaces, there is no benefit because doing so only repeats the last comparison.
The SMF arrival rate check creates models and performs comparisons for time ranges based on 1 hour of data, 24 hours of data, and 7 days of data. If the amount of data is not available, the total system rate line for that time range is not printed on the report and UNAVAILABLE is printed for the individual address spaces for that time range.
This check supports excluding address spaces that issue SMF records erratically by allowing you to identify them in the PFA_SMF_ARRIVAL_RATE/config/EXCLUDED_JOBS file.
JES2 spool usage
The PFA_JES_SPOOL_USAGE check is designed to detect abnormalities in persistent address spaces based on an abnormal increase in the number of spool track groups being used from one collection to the next. An abnormal increase in track groups usage can indicate a damaged job.
This check does not look for exhaustion of track groups. An abnormal increase might occur even if the address space is using a seemingly small number of track groups.
If the increase in the number of track groups is small and an exception is issued that you want to avoid in the future, you can increase the EXCEPTIONMIN parameter to be the minimum increase that must exist for PFA to perform the comparison.
The total number of track groups used per address space is listed on the reports. However, this value is irrelevant to PFA processing and is only provided for your reference.
Figure 2-22 shows a sample JES Spool Usage report for an exception caused by JOB1 and JOB55. The reason for the exception is that the change in the number of track groups used from one collection to the next is much higher than the expected change. The current number of track groups used is not used by the comparisons and is only provided for your reference.
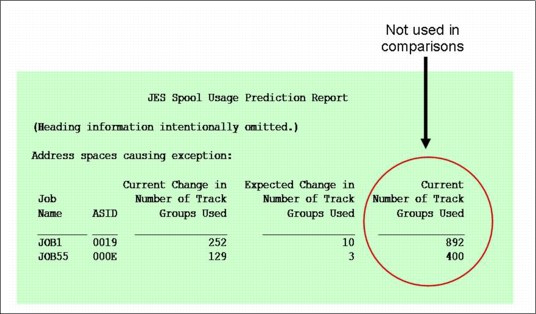
Figure 2-22 PFA JES Spool Usage Prediction Report
Not all persistent address spaces are modeled, but the data is collected for all persistent address spaces. At modeling time, PFA determines which address spaces had the highest increase in their usage and makes predictions for those because they are the ones that are showing the most difference in their behavior.
Modeling a subset of the address spaces reduces the CPU cost of the modeling and eliminates data that is inconsequential to causing a soft failure. During the comparisons, if PFA detects that address spaces that were not modeled have increased their usage significantly, it remodels immediately to include those address spaces in the model.
Not all persistent address spaces are listed on the report. When this check determines that no exception exists, the address spaces with the highest increase in their usage are printed on the report rather than those that are using the highest number of track groups. When an exception occurs, the persistent address spaces that caused the exception, that is, those deemed to be using an abnormal number, are printed on the report.
This check supports excluding address spaces that use erratic numbers of track groups by allowing you to identify them in the PFA_JES_SPOOL_USAGE/config/EXCLUDED_JOBS file.
|
PFA_JES_SPOOL_USAGE check: This check is only active if JES2 is the primary JES. A WTO message is issued when PFA starts if JES2 is not the primary JES, and the check will not be initialized.
|
Enqueue request rate
The PFA_ENQUEUE_REQUEST_RATE detects a potentially damaged address space or system based on the enqueue request rate being higher or lower than expected. The check’s metric is the count of ENQ requests per amount of CPU used in the interval.
The report for this check is nearly identical to that of the message arrival rate and SMF arrival rate checks. However, this check only tracks the top individual persistent address spaces and the total system as described in 2.5.7, “How PFA groups address spaces for monitoring” on page 60.
This check supports the ability to exclude address spaces from its processing using the PFA_ENQUEUE_REQUEST_RATE/config/EXCLUDED_JOBS file. The PFA install script creates an EXCLUDED_JOBS file that excludes *MASTER* and NETVIEW* when PFA is installed. Other address spaces can be excluded by adding them to this file as needed.
The enqueue request rate check performs its comparisons after every collection rather than being scheduled through the IBM Health Checker for z/OS INTERVAL parameter. By performing the check automatically upon successful completion of a collection, the check is able to compare the most recent system behavior with the predictions created at the last modeling interval. This enhances the validity of the comparisons and the responsiveness of the check to the current activity of the system. Even though it can be run manually using IBM Health Checker for z/OS interfaces, there is no benefit because doing so only repeats the last comparison.
The enqueue request rate check creates models and performs comparisons for time ranges based on 1 hour of data, 24 hours of data, and 7 days of data. If the amount of data is not available, the total system rate line for that time range is not printed on the report and UNAVAILABLE is printed for the individual address spaces for that time range.
This check requires two time ranges to be available before comparisons are made.
|
PFA_ENQUEUE_REQUEST_RATE check: If you change the maximum number of concurrent ENQ, ISGENQ, RESERVE, GQSCAN and ISGQUERY requests, or change system-wide defaults using the SETGRS command or through the GRSCNFxx Parmlib member, or the system is radically different after an IPL (such as a change from a test system to a production system), perform the following steps:
1. Stop PFA.
2. Delete the files in the PFA_ENQUEUE REQUEST_RATE/data directory.
3. Restart PFA.
This ensures that PFA is collecting relevant information and that your models accurately reflect the behavior of your system.
|
If an unexpectedly high enqueue request rate is detected, examine the report in SDSF for details about why the exception was issued. Also, refer to 2.9.7, “PFA exception issued for a high SMF arrival or high ENQ request rate” on page 92.
If an unexpectedly low enqueue request rate is detected, examine the report in SDSF for details about why the exception was issued. Use the Runtime Diagnostics output in the report to assist you in diagnosing and fixing the problem. Also, refer to 2.9.6, “PFA exception issued for a low rate” on page 92.
2.5.7 How PFA groups address spaces for monitoring
Each individual metric that PFA uses has its own characteristics of what is important to track and what data to use. For example:
•PFA excludes the data collected within the first hour after IPL and the last hour of data collected before the last shutdown because that data can skew the results of the prediction.
•PFA also uses the data collected prior to the IPL only if it can be applied to the trends after the IPL. For example, the data collected for common storage exhaustion cannot be applied after an IPL because the users of storage are not necessarily the same after the IPL. Similarly, the data obtained for the JES spool usage check cannot be used after the IPL.
You cannot manually exclude specific time ranges of data from the model. However, you can exclude data from specific address spaces from being modeled for most checks. More information about excluding specific address spaces can be found in the list item “Eliminate address spaces causing exceptions” on page 66.
Table 2-2 on page 61 describes which address spaces are tracked for each check. For some metrics, the results are the most accurate when using several different groupings of address spaces. Multiple categories allows the check to detect both damage to individual address spaces and to the entire system.
When a check supports several categories, the comparisons are performed in the following order for each category supported. If an exception is found in a category, the exception is issued for that category and the subsequent categories are not compared.
1. Tracked, persistent address spaces
Those with the highest individual rates in a warm-up period.
2. Other persistent address spaces
All the persistent address spaces not being tracked individually are grouped.
3. Other non-persistent address spaces
All the non-persistent address spaces as a group.
4. Total system
All address spaces as a group.
Table 2-2 The address spaces that are tracked per check
|
The address spaces tracked
|
Which checks track this data
|
Description
|
|
Total system as a group
|
Common Storage Usage
LOGREC Arrival Rate
Message Arrival Rate
SMF Arrival Rate
ENQ Request Rate
|
For some metrics, the data is required to be tracked for the entire system to determine whether exhaustion is occurring or if the cumulative failures on the system indicate a damaged system.
For example, for exhaustion of common storage, it tracks the common storage usage for the entire system. Similarly, detecting a damaged system based on LOGREC arrival rates by key groupings requires accumulating the arrivals for the entire system.
|
|
Every persistent address space individually
|
JES Spool Usage
|
A persistent address space in PFA is defined to be any address space that was started within the first hour after IPL. This definition was created so that PFA could detect critical system address spaces without using a hardcoded list.
Address spaces with duplicate names are not tracked. If a persistent address space restarts while PFA is running, it continues to be considered persistent even if it is assigned a different ASID.
This category is used to detect a damaged persistent address space.
|
|
Tracked, persistent address spaces
|
Message Arrival Rate
SMF Arrival Rate
ENQ Request Rate
|
Tracking address spaces that have the highest rates individually allows PFA to detect damaged or hung address spaces among the address spaces that tend to have the highest rates for this metric.
PFA checks determine which persistent address spaces to track by entering a six-hour warm-up phase for the check to determine which address spaces have the highest rates in that period. The warm-up phase waits for one hour after IPL and then collects data for six hours. At the end of the warm-up phase, the rates are calculated for each persistent address space and those with the highest rates are chosen to be tracked.
If PFA is restarted or an IPL occurs, PFA still tracks the same address spaces without entering the warm-up period if those address spaces still exist and the maximum PFA chooses to track were being tracked prior to the IPL or PFA restart. When PFA can track the same persistent address spaces, it can use the data collected prior to the IPL in its modeling.
Address spaces with duplicate names are not tracked individually, but if an address space that is tracked ends and restarts, it continues to be tracked even if it was assigned a different ASID. In this case, the data collected from the previous address space is used when making predictions for this address space.
|
|
All other persistent address spaces as a group
|
Message Arrival Rate
SMF Arrival Rate
|
Some metrics also categorize all persistent address spaces that are not being tracked individually as a group and compare the actual usage of those persistent address spaces in this category to the group average.
|
|
Non-persistent address spaces as a group
|
Message Arrival Rate
SMF Arrival Rate
|
Some metrics track the address spaces that started more than an hour after IPL as the non-persistent address spaces as a group.
|
2.5.8 PFA and Runtime Diagnostics integration
Consider the case where the system is issuing an unusually low number of messages. This could mean that there is simply little happening at that time (it could be a public holiday, for example). Or it might mean that there is a significant problem on the system and all the work has come to a halt. You would not want PFA issuing an exception in the first case. But you would want it to issue an exception in the latter case. To help PFA determine whether the low message rate indicates a problem or not, it exploits the diagnostic capabilities of Runtime Diagnostics.
Starting with z/OS 1.13, PFA and Runtime Diagnostics were integrated so that PFA can detect a potentially hung persistent address space or system by determining that a metric is too low compared to its expected value. Prior to this enhancement, PFA was only able to detect if the metric was abnormally high.
•If PFA believes that a metric is abnormally low, it verifies its findings with Runtime Diagnostics.
•If Runtime Diagnostics determines that the situation really is a problem, a PFA exception is issued and the Runtime Diagnostics output is included in the PFA report.
– If PFA detects the problem to be in specific address spaces, it asks Runtime Diagnostics to perform checking only for those address spaces.
– If PFA detects the problem to be for the entire system, it directs Runtime Diagnostics to perform its comprehensive checking.
– In either case, when PFA invokes Runtime Diagnostics, critical message analysis is not performed.
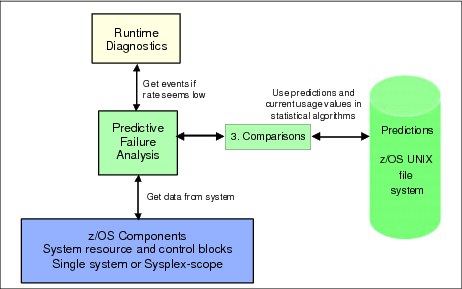
Figure 2-23 PFA and Runtime Diagnostics integration
This new feature is supported by three checks: message arrival rate, SMF arrival rate, and the enqueue request rate check. The message arrival rate and SMF arrival rate checks support detection of an abnormally low condition for the tracked, persistent address spaces; the other persistent address spaces as a group; and the total system rates. The enqueue request rate supports this checking for the tracked, persistent address spaces and the total system rate.
The Runtime Diagnostics address space must be active for PFA to interact with it. If Runtime Diagnostics is not active when PFA starts, PFA issues a WTO message and does not perform the comparisons for detecting a “too low” condition.
If Runtime Diagnostics is started after PFA starts, PFA detects that Runtime Diagnostics is now active and performs the checking for “too low” when the next comparison is performed.
If PFA has detected that the rate was too high in any of the categories it compares, it does not perform checking for a rate being too low.
The supported categories are checked in the following order:
1. Tracked, persistent address spaces
2. Other persistent address spaces
3. Total system rate
If a category detects a too low condition and Runtime Diagnostics corroborates the comparison, exceptions for the subsequent categories are not issued.
Figure 2-24 shows an example of the Message Arrival Rate prediction report for a “too low” exception.
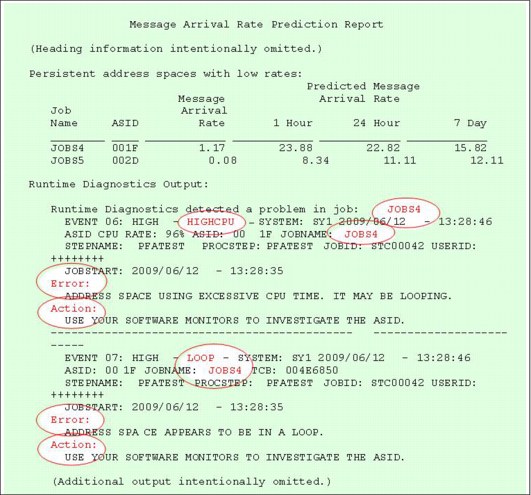
Figure 2-24 PFA and Runtime Diagnostics exception report
When an exception for an abnormally low condition is found, a health check exception is issued describing the problem. The PFA report includes the current rates and predicted rates for the categories that were failing. It also includes the Runtime Diagnostics output received when PFA called Runtime Diagnostics to verify the problem.
Note that in this example, PFA detected that jobs JOBS4 and JOBS5 had a Message Arrival Rate that was likely too low when compared to their expected rates. Runtime Diagnostics verified that there could be a problem by detecting both a HIGHCPU and a LOOP event for JOBS4. Therefore, the abnormally low message arrival rate coupled with the results of Runtime Diagnostics show that JOBS4 is likely to be looping. The Runtime Diagnostics output for JOBS5 was similar, but was purposely omitted from this example for simplicity.
As with the other PFA prediction reports, the PFA prediction reports for abnormally low conditions are available in SDSF.
|
PFA uses Runtime Diagnostics only for “too low” problems: PFA only uses Runtime Diagnostics for “too-low” problems because PFA is unable to determine whether or not the lack of activity is really a problem. For “too-high” problems, PFA is able to determine the problem on its own and is usually able to present helpful diagnostic information based on the information that is available to it.
For this reason, and also to eliminate the CPU cost of running Runtime Diagnostics when it is not really needed, PFA does not invoke Runtime Diagnostics for “too-high” problems.
|
2.5.9 Achieving maximum benefit from PFA
The following tips can help you obtain maximum benefit from using PFA:
•Start PFA and its companion address spaces (Runtime Diagnostics and IBM Health Checker for z/OS) at IPL.
•Use a zAAP to offload PFA modeling processing.
The complex algorithms used by modeling would be compute-intensive in any language. Because this processing in PFA is done in Java, you can offload this work to a zAAP (or zAAP on zIIP).
•Follow the installation steps in z/OS Problem Management, G325-2564. The following steps are the most common omissions:
– Run the install script for each release. The most common indication that the install script was not run is the following message:
AIR010I PFA CHECK check_name WAS UNABLE TO OPEN LOG FILE, ERRNO=00000081 ERRNOJR=0594003D
– Update the ini file to specify the paths to PFA’s Java code and the Java code for your system if it is not in the paths specified by default. If PFA cannot find the Java code, the problem is typically reported as:
AIR022I REQUEST TO INVOKE MODELING FAILED FOR CHECK NAME=check_name. UNIX SIGNAL RECEIVED=00000000 EXIT VALUE=00000006 (or EXIT VALUE=00000002).
– Allocate the appropriate amount of DASD for your release as documented in z/OS Problem Management, G325-2564.
– Update your PFA JCL to specify the path in which you installed the executable code if it is not the default path /usr/lpp/bcp. The most common symptom of this omission is that even after modeling should have occurred, the successful model count for the checks is 0 even though there are no AIR022I messages.
Also, the systemNameMODEL.LOG file contains the following line:
AIRHLJVM failed BPX1SPN errno=00000081 errnojr=053B006C
The default PFA procedure is shown in Example 2-2. To resolve the previous error, update the path statement to point at the correct directory:
Example 2-2 PFA procedure
//PFA EXEC PGM=AIRAMBGN,REGION=OK,TIME=NOLIMIT,
// PARM=’path=(/usr/lpp/bcp)’
•Develop automation routines for the PFA Health Check exceptions.
There are several ways to accomplish this task. For more information, refer to IBM Health Checker for z/OS, SA22-7994.
•Stay current by getting the most recent PFA PTFs.
– PFA strives for continuous improvements in its algorithms so that soft failures can be detected more accurately. These improvements are released in the service stream when they are available. To obtain a list of all available PFA service, search on the PFA component ID: 5752SCPFA.
– If you believe you have received an invalid exception and tuning is not helping, contact IBM service. Customer feedback on potential problems helps IBM to improve the PFA algorithms.
•Use the PFA modify command to display parameters.
Use the PFA modify command rather than the IBM Health Checker for z/OS modify command to display all the parameters and status details for a PFA check, as described in the label box Display all parameters and obtain status of PFA checks on page 46.
•Eliminate address spaces causing exceptions.
Exclude from PFA processing those address spaces that are normally unstable and unpredictable.
For example, when you suspect certain jobs or address spaces are inconsistent and have the potential of being restarted often, you can increase the accuracy of PFA reporting by excluding the job or address spaces from analysis.
Excluding jobs is also useful in a test environment where certain test programs are expected to have erratic behavior and can cause unwanted exceptions, such as issuing many LOGRECs or many WTOs and causing exceptions for those checks.
To exclude jobs from processing, follow these steps:
– First, add the jobs to the EXCLUDED_JOBS file in the check’s /config directory.
– Then use the update command f pfa,update,check(pfa_check_name) to have PFA read the contents of the file and start excluding the jobs you added.
•Change the type of WTO of a check.
The type of WTO issued when a PFA check issues an exception is controlled by the SEVERITY and WTOTYPE parameters of the Health Check. The default value for all PFA checks is SEVERITY(MED), which issues an eventual action WTO for a PFA check exception.
If this value is not appropriate for a PFA check in your installation, you can modify the WTOTYPE setting using the IBM Health Checker for z/OS modify command. For example, to change the JES spool usage check so that it issues informational messages to the console, use the following command:
f hzsproc,update,check(ibmpfa,pfa_j*),wtotype=info
•Configure checks to reduce or eliminate unwarranted exceptions.
Exceptions tend to be ignored if they occur too frequently when a real problem does not exist. Therefore, reducing the number of unwarranted exceptions leads not only to better accuracy, but a greater sense of urgency when a PFA exception occurs.
Even with the complex comparison algorithms in place, predictive technology requires part art and part science and unwarranted exceptions can be reported, especially in an environment that is unpredictable. To allow you to influence PFA’s results in these environments, mechanisms are provided to allow you to tune the behavior of the individual checks.
All PFA checks were implemented with at least one configuration parameter to help you tune the sensitivity of the check. Default values for all parameters were carefully chosen to minimize the amount of customization required for most systems. However, your individual environment might require different values than the defaults.
Do not be intimidated by these parameters. They are available for your use so that PFA can detect problems in your environment accurately and so that you are satisfied with the results.
– If you are experiencing unwarranted exceptions and the problem is not for a specific address space that is unstable, modify the configuration value for the check to cause the comparisons to be less sensitive. For example, if the standard deviation value (STDDEV) is currently set to 5, incrementally increase the value until the unwarranted exceptions are reduced or eliminated.
– If the problem is for specific address spaces and you have investigated the issue and are sure that they are not going to cause soft failures, consider excluding them from the processing as previously described so that you can determine whether the check is issuing appropriate results for the rest of your address spaces. Alternatively, you can increase the configuration value for the check, but you then might miss real exceptions for other address spaces.
Table 2-3 describes how the values of the configuration parameters affect the sensitivity of the PFA comparison algorithms. For more information about the definitions of each parameter and the parameters supported for each check, see z/OS Problem Management, G325-2564.
To modify a value, change it using the IBM Health Checker for z/OS modify command as described in the label box Display all parameters and obtain status of PFA checks on page 46.
Table 2-3 PFA configuration parameters to adjust sensitivity of comparisons
|
Parameter
|
Supported checks
|
Description
|
|
THRESHOLD
|
Common storage usage
|
This parameter is often confused and thought to be a hardcoded threshold (such as 80 percent) that the location must be using in order for the exception to be issued.
Instead, the THRESHOLD is a percentage of the capacity that the prediction must be before the comparisons are performed after domain knowledge is applied. That is, it sets the sensitivity level of the comparison to know when exhaustion of the available capacity is being predicted.
For example, if PFA’s domain knowledge says that the location should allow 100 percent of the available capacity and THRESHOLD(2) is used, the prediction must be at 102 percent of the available capacity before comparisons for exhaustion are performed.
This design allows PFA to detect exhaustion even though current usage might not be nearing exhaustion yet.
To make this check less sensitive so it issues exceptions less frequently, set THRESHOLD to a higher value so that a larger prediction is required before exceptions can be issued.
|
|
STDDEV
|
LOGREC Arrival Rate
JES Spool Usage
Message Arrival Rate
SMF Arrival Rate
Enqueue Request Rate
|
This value is used as a multiplier to calculate the comparison value for comparisons detecting if the current usage or rate is too high compared to the expected value.
A higher STDDEV value requires the difference between the current value and the prediction to be greater in order for an exception to be issued. Therefore, exceptions are issued less frequently with a higher STDDEV.
To reduce exceptions indicating the metric is too high for checks that have the STDDEV parameter, incrementally increase the value until you are satisfied with the results.
If an exception is issued, a systemNameRUN.LOG file is created in the EXC_timestamp directory for this exception. For some checks, the STDDEV value needed to avoid the exception might be printed to help you tune the check if the exception was unwarranted.
|
|
STDDEVLOW
|
Message Arrival Rate
SMF Arrival Rate
Enqueue Request Rate
|
This parameter is similar to STDDEV except that it is used in the algorithms detecting “too low” conditions.
This value is used to set the variance between the current value and the comparison value when detecting rates that are too low.
A larger value requires the current rate to be significantly lower than the expected rate in order for an exception to be issued.
To reduce exceptions indicating the metric is too low for checks that have the STDDEVLOW parameter, incrementally increase the value until you are satisfied with the results.
If an exception is issued, a systemNameRUN.LOG file is created in the EXC_timestamp directory for this exception. For some checks, the STDDEVLOW value needed to avoid the exception might be printed to help you tune the check if the exception was unwarranted.
|
|
EXCEPTIONMIN
|
LOGREC Arrival Rate
JES Spool Usage
Message Arrival Rate
SMF Arrival Rate
Enqueue Request Rate
|
This parameter is used when detecting abnormally high values and rates.
A higher EXCEPTIONMIN value requires the current value (and sometimes the prediction) to be higher than this value before an exception can be issued.
This parameter is used to eliminate exceptions for “noise” on the system. That is, if your system tends to have a low rate for a given metric, you can set this parameter to the minimum value that should be compared so that the normal, low rates are not even compared.
To reduce indicating the metric is too high when your system is stable and normally has a relatively low rate or value, set EXCEPTIONMIN to the minimum value you want to be compared.
For example, if your system typically has a message arrival rate of 20 and you do not want comparisons for high rates to be performed for rates that are less than 20, set EXCEPTIONMIN(20).
|
|
LIMITLOW
|
Message Arrival Rate
SMF Arrival Rate
Enqueue Request Rate
|
This parameter is available on all checks that detect hung address spaces or systems based on a determination that the rates were too low.
Its purpose it to avoid “too low” conditions for rates that are higher than this value that indicate normal system activity is occurring.
That is, comparisons for “too low” conditions are only performed for rates that are less than this value.
To reduce exceptions indicating the metric is too low for rates that are relatively high, set LIMITLOW to the maximum value you want compared for “too low” conditions.
For example, if your system typically has a message arrival rate of 3, set LIMITLOW to a value less than 3 so that low values are not even compared.
|
|
CHECKLOW
|
Message Arrival Rate
SMF Arrival Rate
Enqueue Request Rate
|
This parameter is available on all checks that detect hung address spaces or systems based on a determination that the rates were too low.
Use this parameter to bypass comparisons for low rates and values if you do not want PFA to perform this function.
|
|
TRACKEDMIN
|
Message Arrival Rate
SMF Arrival Rate
Enqueue Request Rate
|
This parameter is used by the checks that find individual persistent address spaces to track.
It defines the minimum rate that an address space must have at the end of the warm-up period in order for it to be tracked.
To allow an address space with any rate to be considered for tracking, set this value to 0.
If you notice that you have many tracked jobs with normally low rates and you receive unwarranted exceptions for this normal, low behavior, consider setting TRACKEDMIN to a higher value.
To force PFA to track a different set of address spaces after changing this value, you must follow these steps:
1. Stop PFA.
2. Delete the /data subdirectory for the check for which you are changing the TRACKEDMIN parameter.
3. Start PFA.
|
•Make configuration changes persistent.
Create a policy in the HZSPRMxx PARMLIB member to make configuration changes to PFA checks persistent.
•Quiesce checks that issue unwarranted exceptions.
Rather than stopping PFA or deleting a PFA check (which requires PFA to be restarted to re-add the check), if unwarranted exceptions are occurring and you need to postpone their investigation, you can quiesce PFA checks so that they do not issue exceptions, but continue their other processing, if desired. This method allows all other checks to continue processing and does not require PFA to be restarted to re-add a deleted check.
To quiesce a check:
a. (Optional). if you want to stop the check from collecting, modeling, and issuing exceptions, set the COLLECTINACTIVE parameter to 0. For example, to modify the JES spool usage check to stop collecting and modeling when the check is not active, execute the following command:
f hzsproc,update,check(ibmpfa,pfa_j*),parm(‘collectinactive(0)’)
Unless the collections and models are causing system issues, we suggest leaving COLLECTINACTIVE set to 1, which is the default on all PFA checks.
b. Deactivate the check using IBM Health Checker for z/OS. For example, you can deactivate the JES spool usage check using the following command:
f hzsproc,deactivate,check(ibmpfa,pfa_j*)
To reactivate the check, use the following command:
f hzsproc,activate,check(ibmpfa,pfa_j*)
2.6 IBM System z Advanced Workload Analysis Reporter
The latest addition to the family of z/OS-related system management tools is IBM System z Advanced Workload Analysis Reporter (zAware). IBM zAware extends the set of tools designed to help you achieve higher availability. It does this by performing machine learning, pattern recognition, and statistical analysis of console messages to look for unexpected patterns and anomalies to provide fast, near realtime, detection of changed message behavior on your systems.
Chapter 1, “Introduction to IBM zAware” on page 1, introduces IBM zAware and described its architecture. This section summarizes the steps you need to follow to get IBM zAware running, and provides information to help you use it effectively.
2.6.1 Preparing IBM zAware for use
IBM zAware does not require authoring of rules or any coding to query the right fields, for example, to detect anomalies in your systems’ message activity. You will notice, for example, that this section of this chapter is much shorter than the PFA section. Compared to PFA, IBM zAware is a “black box” solution, meaning that little, if any, customization is required or possible.
After you connect a system to IBM zAware, there is little that you can do to influence its analysis of incoming messages. Most of our focus in this book is on planning for, using, and managing IBM zAware.
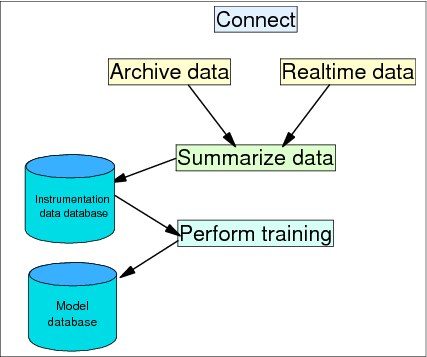
Figure 2-25 Preparing IBM zAware for use
The required steps are summarized here:
1. Connect
Each monitored client needs to connect to IBM zAware. The connection is required for two reasons, that is, to enable the transmission of archived log data, and so that messages can be sent to IBM zAware in real time.
2. Load the instrumentation data database
The instrumentation data database can be primed using archived message data that was sent to IBM zAware using the bulk load utility, or by allowing IBM zAware to collect data in real time until enough data exists for training.
When message data is received by IBM zAware, it is parsed, summarized, and stored in the instrumentation data database, regardless of whether it is real time message data or historical archived data.
3. Training
When the instrumentation data database contains sufficient message data, you can use it to create a model for that system, using a process known as “training.” The training can be run after historical data has been bulk-loaded, or you can wait for the normal realtime message loading to pass over sufficient data to build a representative model of that system’s message behavior.
The following section explains these steps in greater detail.
Connecting monitored clients
Before you can start using IBM zAware to analyze your realtime message traffic compared to the normal behavior for that system, you need to send message data so that IBM zAware can build its model database. To enable the transmission of that data, you need to establish a TCP/IP connection between each monitored client and the IBM zAware LPAR. The network connection that you establish between a monitored client and the IBM zAware LPAR can be used to transmit both realtime and historical message data.
Note that every monitored client will require its own connection to the IBM zAware LPAR. Even if multiple monitored clients are in the same sysplex, each will still require its own connection and will be responsible for sending its own realtime data.
Chapter 3, “Planning for an IBM zAware implementation” on page 95, contains information to help you plan for the required network connections. Chapter 4, “IBM zAware installation” on page 113, demonstrates our experiences with setting up IBM zAware, based on the information provided in the IBM System z Advanced Workload Analysis Reporter (IBM zAware) Guide, SC27-2623.
Assuming that all the prerequisite setup work has been completed, System Logger will start sending realtime message data to IBM zAware as soon as the connection is started (using the System Logger SETLOGR FORCE,ZAICONNECT command).
Loading the instrumentation data database
As each message is received by IBM zAware, it is reduced and summarized by message ID, counts of occurrences, and the first occurrence’s text. Clustering information is kept for pattern-matching. All of this information is then used to update the instrumentation data database.
It is possible to wait for the volume of messages received in realtime to build up to the point that you can successfully build a model of the system. However, we expect that most customers will extract historical message data from syslog or OPERLOG archive data sets and use that to prime the instrumentation data database.
The Bulk Data Load Utility allows you to transmit historical message data from archive data sets. You typically run the bulk load function once. However, if you run the utility more than once, IBM zAware simply overlays any data that it had already received.
Remember that no analysis will be performed, and no analysis data presented on the IBM zAware GUI, until a model for the system has been successfully created.
The Bulk Data Load Utility
The Bulk Data Load Utility consists of a batch job that runs a REXX exec to perform the transformation and load of the message data into a temporary log stream for transmission to the IBM zAware application.
The Bulk Data Load Utility processes sequential data sets that contain data from syslog (from JES2) or OPERLOG (from both JES2 and JES3) in HCL (two-digit year) or HCR (four-digit year) format. The input files can contain message data from one or multiple systems.
After the message data has been successfully transmitted to IBM zAware, and each monitored client has connected to IBM zAware, then you must use the IBM zAware GUI Assign function to associate each system with the sysplex that it is a member of, as shown in Figure 2-262.
Figure 2-26 Assign bulk data window
The monitored client that runs the bulk data load job must have a connection to the IBM zAware application. Information about managing connections to IBM zAware is provided in 5.4, “Managing connections from monitored clients” on page 165.
Chapter 13 in IBM System z Advanced Workload Analysis Reporter (IBM zAware) Guide, SC27-2623, explains how to perform the bulk data load.
Training
The final step in preparing IBM zAware for use is to build the model of normal system behavior from the historical data. The Training Sets tab on the IBM zAware GUI presents a list of systems that have data in the instrumentation data database.
To create the initial model for each system, you would normally select the system that you want to train, and then select the Request Training option in the Actions drop-down, as shown in Figure 2-27 on page 75.
|
Tip: You might find that IBM zAware appears to be selective about which systems are able to be successfully trained. This is particularly the case for test or development systems. However, remember that IBM zAware is trying to emulate what you do when presented with a system problem, which is, identifying what is different about the system now, compared to its normal state. The best way that IBM zAware has of creating a reliable model of the normal state of a system is to require that monitored systems exhibit consistent behavior and a statistically significant number of messages.
Successfully creating a model for every system, even one that produced few messages or exhibited no consistency, would simply result in IBM zAware marking normal messages as being anomalous. If it behaved in this manner, you would soon learn to ignore its results, thus reducing its value as a reliable tool.
The topic of identifying suitable systems for IBM zAware to monitor is discussed further in 3.2, “Selecting which systems to monitor with IBM zAware” on page 96.
|
Figure 2-27 Training Sets window
IBM zAware training divides the historical data in the Instrumentation data database into 10-minute slices.
Within those time slices, it performs the following tasks:
•Categorizes message ids.
•Determines the frequency of messages being issued by determining the percentage of intervals that contain the message and the number of times within the interval the message occurred.
•Attempts to identify groups of messages that consistently appear together.
Ninety days of message data is the recommended minimum amount of data for training. This increases the likelihood that clusters of messages will occur multiple times and be identified as a valid pattern. Having data that represents mid-week and weekends, month-end, and any other special processing periods increases the value of your model.
Regardless of how many days of message data you use, it is important that there are enough unique message IDs and enough repetition to allow IBM zAware to discern clusters of messages and to create a realistic model.
The initial training will probably be initiated manually. Subsequent training, to update the model with current message data, can be performed manually or (more likely) on a schedule. Refer to 2.6.3, “Achieving maximum benefit from IBM zAware” on page 81 for a discussion about which method is more useful for you.
2.6.2 Using IBM zAware
After you perform the preparation steps, you will have a model of the “normal” message activity of a system, and be sending realtime message data to the IBM zAware LPAR. To help you obtain the best value from IBM zAware, the following sections explain some of the processing that IBM zAware performs, and then discuss what you can expect to see on the IBM zAware GUI Analysis results panels and how to use that information.
When a model of the system exists and realtime message data is being sent to IBM zAware, every two minutes the analytics engine compares the current data to the model. The results of the comparisons are output to the XML files and to the IBM zAware GUI. When performing the analysis, IBM zAware applies the following criteria to each message ID so that it can assign an anomaly score to that message:
•How frequently is this message ID seen in the model database? Messages that appear infrequently are, by their nature, more anomalous than ones that are issued every few minutes.
•Is there any domain-specific information for this message ID? For example, IBM zAware might know that this message is quite common and is purely informational and therefore is generally considered to be “background noise.” Or, it might know that this message can be an indication of a significant system problem.
•If this message is part of a cluster, then are the other messages that normally appear in that cluster also present?
•Is the frequency with which the message is appearing significantly different than the normal frequency with which it is seen?
When investigating a potential problem on your system, these are the same types of questions that you as an experienced system programmer apply to the logs that you are reviewing. And IBM zAware can process huge volumes of data in a short time. But you can use intuition and knowledge of other environmental factors that IBM zAware might not be aware of. So the objective is to help you combine your experience with IBM zAware’s strengths to more quickly identify potential problems. IBM zAware’s GUI is designed to help you achieve that.
Contents of the Analysis view
The results of the analysis of the realtime message data is shown on the IBM zAware Analysis view window, as shown in Figure 2-28 on page 77. Notice that each monitored client has its own row, with each row containing a number of bars. The height and the color of the bars on the Analysis view present two types of information, as explained here:
•The height of the bar is based on the number of unique message IDs for that system in that interval.
For example, if messages ABC123I, DEF123I, and GHI456E are issued, that counts as three different messages. If message ABC123I was issued three times, that only counts as one message. So, a high bar indicates that many unique messages were issued in that interval.
Figure 2-28 IBM zAware Analysis view
•The color of the bar represents how close the messages in the corresponding interval are to the model of that system.
Factors such as messages being issued out of context, messages being issued at a higher rate than expected, messages that were not seen in the model, or messages that IBM zAware knows are important messages will increase the interval anomaly score.
A low interval anomaly score will result in light blue bars. Higher interval anomaly scores will result in darker blue, yellow, or orange bars. In general, intervals with dark blue, yellow, or orange bars would be considered to be more “interesting”. A key (shown in Figure 2-29) describing the scores associated with the different colors is contained in the bottom-right part of the Analysis view window.

Figure 2-29 Interval anomaly score key
Note that there are two sets of anomaly scores. Each message ID in an interval is assigned an anomaly score (which is a value between 0 and 1). Additionally, the interval is assigned an anomaly score (which is a value between 0 and 101). The interval anomaly score for an interval is the one that is reflected in the color of the bar for that interval.
The interval anomaly score is based on the anomaly scores of the messages in that interval. However, it is not simply the sum of the individual message anomaly scores. Rather, the interval anomaly score represents an overall view of how widely the messages in the interval differed from the normal behavior for that system. A high score indicates unusual message IDs or unusual patterns of message IDs compared to the system model.
The anomaly score for a specific message ID is shown on the Interval View window (which is described in “Interval View window” on page 79). It is an indication of how different the behavior of the specific message ID is from the normal behavior of the message ID during the training period.
During training, IBM zAware determines whether this message ID is issued as part of a pattern of messages, how frequently within a 10-minute interval it is issued, and how many intervals contain the unique message ID. If the message is issued more often within a 10-minute interval than observed in the past, the score will be higher. If the message did not occur in many intervals or not in any intervals in the past, then the score will be higher. If the message is usually issued as part of a pattern of messages but is issued by itself, the score will be higher.
The observed behavior is fitted to two different statistical distributions and these distributions are used to calculate a portion of the message anomaly score:
•The Poisson distribution, applied to the likelihood of a message appearing in a group of messages
•The Bernoulli distribution, applied here to the probability of a message occurring or not occurring
IBM domain knowledge is combined with the observed behavior of the message traffic to construct a final message anomaly score. IBM adds their domain knowledge to make sure that certain critical messages like those associated with actions like sysplex partitioning or the occurrence of an SVC dump receive the correct score, no matter what the behavior of the z/OS image was during the training period.
For example, the messages issued when an SVC dump is taken are marked as important and generate a higher message anomaly score even if during the training period a large number of SVC dumps occurred (this would normally reduce the score associated with those messages). Similarly, message IDs that appear to occur at random in most, if not all, intervals and that reflect random normal behavior of the z/OS image are identified and marked so that the message anomaly score for that message ID is low.
The interval bars on the GUI normally represent a 10-minute interval. The most recent bar is updated every two minutes and might represent less than 10 minutes of data. Every two minutes, IBM zAware analyzes the data for the last two minutes. Depending on the results of that analysis, the color and height of the bar representing the current interval might change. For example it might be light blue at the beginning of the period, then dark blue, and then orange. At the end of the 10-minute interval, the XML that represents the information behind each bar is saved in the IBM zAware file system and will never be updated again. The XML files are kept for the length of time specified in the “Analysis results retention time” field on the Analytics tab of the Configuration Settings window.
Note that the 10-minute period is a fixed window for analysis. At the beginning of each interval, IBM zAware starts its analysis again, but does not carry any information forward from the last interval. It also does not use any information for previous intervals from the instrumentation data database. This means that a cluster of messages that spans two 10-minute intervals might appear to not match any cluster in the model. This could affect the anomaly score of those messages and the interval anomaly score for the two intervals, by making them higher than they would normally be.
To investigate a problem at a specific time, select the bars around that time to determine whether IBM zAware has detected any anomalous message activity. However, to verify that everything is working as expected, select the bars that are dark blue, yellow, or orange to determine what it is about those intervals that makes them significantly different than the normal behavior of that system.
Interval View window
After you identify the interval or intervals that you are interested in, click the bar representing that interval. This brings you to the Interval View window shown in Figure 2-30.
Figure 2-30 Interval View window
The Interval View contains a row for each message ID that occurred in that interval. Each message ID has a time line that shows where the message occurred in the 10-minute period. If the message ID appeared multiple times in the interval, there will be only one row for that message ID but there will be multiple lines in the time line column, one line for each occurrence of the message.
The variables that affect the message anomaly scores are shown in the Interval View window. The associated columns are explained in Table 2-4.
Table 2-4 Interval View descriptions
|
Column heading
|
Description
|
|
Interval Contribution Score
|
This shows how this message has contributed to the overall anomaly score for this interval. The higher the Interval Contribution Score, the more influence that message has on the interval anomaly score.
|
|
Message Context
|
This indicates whether this message appears in any clusters contained in the model. The possible values are:
•NEW - This means that this message was not found in the model database for this system.
•UNCLUSTERED - This means that the message is in the model, but IBM zAware did not identify any other messages that always appear together with this message.
•IN_CONTEXT - This means that the message has appeared in a cluster in the model and in this interval, the message was issued together with the other messages in that cluster.
•OUT_OF_CONTEXT - This means that this message was issued in the interval, but other messages in the cluster were not issued in this interval.
|
|
Rules Status
|
This shows the application of domain knowledge, where metadata has been stored about the context of a message.
The possible values (in order of significance) are:
•CRITICAL - the rule indicates that this message might be important when diagnosing a problem.
•IMPORTANT - the rule identifies this message is likely to indicate a problem.
•INTERESTING - the rule identifies this message is indicative of a diagnostically useful event, such as a health check exception.
•None - no rule was found for this message.
•NON-INTERESTING - the rule for this message indicates that it is not a significant message.
|
|
Appearance Count
|
This shows how often the message appeared in the 10-minute interval1.
|
|
Rarity score
|
This is an indicator of how often this message was issued during the model interval. A score of 101 means that the message was not found in the model. A low score means that this message was found frequently in the model.
|
|
Cluster ID
|
If this message is part of a cluster, the cluster ID identifies the cluster. All the messages in a cluster have the same Cluster ID.
|
1 Some message IDs can be issued with differing message text. Because IBM zAware does not look at the text of a message, if the same message ID is issued twice, with two different message texts, the message ID will have an Appearance Count of “2”.
The messages in the interval view are presented sorted on their anomaly score, with the most anomalous messages at the top. However, you can sort on any column by clicking the heading for each column and selecting whether you want to sort in ascending or descending order. Using the ability to sort the report based on each column, you can easily find the following items:
•Messages that IBM zAware observed did not exist in the model for that system (by sorting the “Rarity Score” column).
These might be interesting candidates to add to your automation or your message suppression table. They might also be messages warning you of the existence of a single point of failure, for example.
•Messages that were issued a large number of times (by sorting the “Appearance Count” column).
These can help you identify a problem in a particular component or with a particular data set.
•Messages that might be impacting your system (by sorting the “Anomaly Score” and “Interval Contribution Score” columns).
These can make you aware of messages that IBM has determined to be high impact (based on its domain knowledge about specific message IDs) or messages that IBM zAware has determined to be highly anomalous. It can also highlight messages that are normal messages, but that are being issued much more frequently than normal.
•The relationship between different components (by sorting the “Time Line” column).
By showing the messages in the chronological order that they were issued, you might spot relationships between messages or components that you were not aware of.
•You can also use the “Cluster ID” column. Messages that IBM zAware has determined are issued as a group will have the same Cluster ID.
If messages from different components (shown in the “Component” column) have the same Cluster ID, that might indicate a relationship that you would not expect. Message IDs with a Cluster ID of -1 are messages that are not clustered; that is, they do not appear to be consistently related to other messages.
For a detailed description of the meaning of the columns in the interval view, refer to IBM System z Advanced Workload Analysis Reporter (IBM zAware) Guide, SC27-2623.
2.6.3 Achieving maximum benefit from IBM zAware
Use the following tips to quickly achieve the maximum benefit from IBM zAware:
•Use bulk load to prime the data.
Using bulk load to prime the data allows IBM zAware to start performing message analysis as soon as the training is done.
If you do not use bulk load to prime the data, IBM zAware needs to upload the data in realtime and training cannot occur until enough data is available to create a valid model.
Because 90 days of data is recommended for training to begin, performing a bulk load can save a considerable amount of time.
•Rebuild the model by manually training, when necessary.
If there have been changes in the message traffic on your system, determine whether they are caused by changes such as a new release of the operating system, new or changed middleware, or new or changed applications. If IBM zAware is flagging the new messages as anomalous and you are satisfied that the messages are normal, you can initiate a training of that system to update the model.
|
Retraining consideration: You must wait until at least after midnight of the day the anomalies occurred because training uses only full days of data. The effect of retraining depends on the stability of the system and the degree to which the new messages cluster. Therefore, waiting more than one day to collect additional data allows the patterns to be more obvious, which can result in a more valid model.
|
•Exclude days containing unusual events from the model.
If an incident or an outage occurs for which you do not want the anomalous behavior to become a part of the normal model, you can exclude those days from the next IBM zAware training. If the anomalous behavior is allowed to be a part of the model, similar incidents in the future might not be recognized as an anomaly by IBM zAware.
to do this, you need to be cognizant of when the next model is scheduled to occur so that you can exclude the days desired before training occurs automatically.
•Do not worry about “holes” in your data.
If connections are quiesced or not reconnected, messages issued during that period will not be in the instrumentation data database, and therefore will not be included in the model the next time the model is updated. However, this is no cause for concern. The data used by IBM zAware should not be considered to be critical to things like transaction logs. Because using at least 90 days of data is recommended, missing data for a few hours does not invalidate the model.
2.7 Message analysis with the various functions and products
In 2.4, “Runtime Diagnostics” on page 32, the seven types of behavior detected by Runtime Diagnostics are discussed, including component message analysis.
In 2.5, “Predictive Failure Analysis” on page 42, the six PFA checks are discussed, including the message arrival rate.
In 2.6, “IBM System z Advanced Workload Analysis Reporter” on page 71, how IBM zAware’s analysis uses OPERLOG messages to detect anomalous system behavior is discussed.
Those sections highlight that there are three separate functions and products that all use messages. This might seem confusing, leading you to the following questions:
•Why are there multiple functions and products that use messages in their analysis and diagnostic behavior?
•What are their differences?
•Which one should I be using and in what situations?
As stated in 1.2.4, “Analytics can help address these issues” on page 6, it takes more than one view of your system to determine whether it is functioning properly. The individual functions and products use different types of diagnostics and analysis to achieve the same ultimate goal, which is high availability on your systems and reduced mean time to recovery. This section focuses on the differences in these functions and products as they relate to their message processing.
2.7.1 Runtime Diagnostics critical message analysis
Runtime Diagnostics is intended to be used when you think something might be wrong on your system. It does quick, on-demand, processing to help you diagnose system problems. It determines whether critical messages were issued in the last hour, or if the other Runtime Diagnostics events related to global resource contention or address space execution exist.
The critical component message analysis in Runtime Diagnostics answers the following questions:
•In the last hour of OPERLOG data, do any of the messages in the IBM-defined list exist?
•For the messages for which additional analysis is done, are the combinations of messages and other things required occurring?
This list of messages that Runtime Diagnostics detects was compiled by IBM development and service personnel based on the messages most often found in dumps sent to IBM from systems that experienced failures. It also contains messages identified by component owners who deemed the messages to be indicative that a critical function was experiencing a failure. This list is updated as necessary so that Runtime Diagnostics can detect more and more critical component events.
Because OPERLOG is used in the message processing, Runtime Diagnostics can search the OPERLOG for messages originating on any system in the sysplex by specifying the system name on the SYSNAME parameter when Runtime Diagnostics is invoked. However, to determine whether any system in your sysplex has issued these messages in the last hour, you need to issue the f hzr,analyze command for each system in your sysplex.
Runtime Diagnostics does not continually monitor for these messages and does not perform any processing until invoked.
Armed with the results of Runtime Diagnostics, you then have an idea where to perform deeper diagnostics to resolve the problem. The results are also often used as preparation for a “bridge call.”
|
Runtime Diagnostics message processing information:
•Runtime Diagnostics looks for a hardcoded list of messages in the last hour of the OPERLOG.
•Runtime Diagnostics is intended to be used “after the fact” when you think a system problem exists.
|
2.7.2 PFA message arrival rate check
The PFA message arrival rate check is designed to detect a potentially damaged address space or system based on the answer to the following question:
•Based on the trends created with 1 hour of data, 24 hours of data, and 7 days of data, is the current message arrival rate within the range expected at this time?
The PFA message arrival rate check relies solely on the rate of WTO and WTOR messages within the collection interval, divided by the amount of CPU used in the collection interval for the system on which PFA is running.
By performing analysis and comparisons on the message rate, PFA can detect whether the current rate is too high (which could mean that an address space or the entire system is damaged) or too low (which could mean that an address space or the entire system is hung).
The model used in the comparisons is a predictive model based on current trends. That is, the model is updated on a regular basis to incorporate the most recent trends over three time ranges to detect workload changes. It provides you with the list of address spaces that might be the cause of the problem to use to help diagnose the problem, and proactively alerts you to the abnormal behavior using exceptions through IBM Health Checker for z/OS.
This check applies domain knowledge by excluding all messages issued by any address space starting with JES by creating an EXCLUDED_JOBS file in the check’s /config directory when PFA is installed. You can customize PFA to exclude messages from other address spaces by adding them to this file as needed.
The message arrival rate check is not aware of individual messages or patterns of messages. It detects an abnormality based on the calculated rate being too high or too low when compared to the expected rates. Three time range predictions are generated to reduce unwarranted exceptions due to workload changes.
|
PFA message processing information:
•PFA looks for abnormally high or low message arrival rates, normalized by CPU utilization, to detect address spaces or the system being hung or damaged.
•PFA includes the current data in the historical data when creating a new model so that current, predictive trends can be established.
•PFA is intended to detect and alert you to the abnormal behavior before it can be seen externally and to provide the potential address spaces that are the source of the problem to help you diagnose the problem.
|
2.7.3 IBM zAware message analysis
IBM zAware message analysis uses message IDs and pattern recognition. The data used in the training creates a model of the normal behavior of the message traffic on the system.
Using the normal behavior as the model, IBM zAware can detect anomalies due to the following reasons:
•Messages not previously found in the historical data.
•Messages that are rare when compared to the historical data.
•A specific message ID is issued too frequently when compared to its historical data.
•Messages that are out of context when compared to the patterns found in the historical data
IBM zAware’s message analysis answers the following question:
•Was the message activity in the interval significantly different than the model of normal behavior?
This processing can detect anomalies on the system that can eventually result in a system outage or a soft failure. It can also help you diagnose problems on your system when you think a problem is occurring by highlighting messages that might otherwise have gone unnoticed. For example, if z/OS system programmers are examining the system log for unusual messages, would they know which IBM DB2® messages are unusual? IBM zAware detects anomalous messages and brings them to the attention of anyone who looks at it. The programmers might not know what the message indicates, but can at least bring it to the attention of their DB2 colleagues.
IBM zAware is independent of the operating system, which allows it to be used even when the systems being investigated are not operating, assuming that the network connectivity to let you logon to IBM zAware is in place. And if it is not in place, that in itself could be valuable diagnostic information.
|
IBM zAware message processing information:
•IBM zAware understands message IDs and message patterns.
•IBM zAware resides outside of z/OS, which means it can be used when the system is non-functional.
•IBM zAware analysis is based on models that depict historical normal behavior for the system, rather than on predictive trends.
•IBM zAware is intended to be used to validate major software changes, detect anomalies before they are externally visible, and help identify the cause of the problem after the fact when you think the system is experiencing a problem.
|
2.7.4 Comparison summary
Each of these tools has specific strengths and is designed to be used in particular circumstances. This section provides this information in a table format to make it easier to compare one product or function to another.
Message analysis detailed comparison
Table 2-5 Comparisons of Runtime Diagnostics, PFA, and IBM zAware message analysis processing
|
Function
|
Metric used
|
Data source
|
Intent
|
Analysis method
|
Output
|
|
Runtime
Diag-
nostics
|
Hardcoded list of critical component messages.
|
•OPERLOG
•LPAR-specific
|
Diagnose a problem by finding specific messages in OPERLOG after event was reported.
|
When invoked, search OPERLOG back for 1 hour (if available) to find a critical message on the targeted system and perform additional analysis on some of them.
|
Runtime Diagnostics Critical Message Event sent to the console (default) with actions suggested.
|
|
PFA
|
Rate of the count of WTO and WTORs, divided by the CPU used in the collection interval.
(Not counted by individual message ID).
|
•Console address space (before Message Flooding Automation)
•LPAR-specific
|
•Detect and alert you to a problem before it is externally visible by detecting potentially damaged address spaces or system and issuing a WTO (which could be processed by your automation product) before your business is impacted.
•Helps you diagnose a problem by identifying the potential address spaces causing the problem. Information is externalized using IBM Health Checker for z/OS.
|
•Predictive, trending model of historical and current rates stored for three time ranges (to distinguish workload variances) creates an expected rate for this point in time.
•Applies statistical comparison algorithms using the current rates and expected rates and issues an exception if the current rate is statistically abnormal when compared to the expected rate.
•Invokes Runtime Diagnostics to corroborate “too low” condition.
•Compares top 10 individual jobs.
•Compares other persistent jobs.
•Compares non-persistent jobs.
•Compares total system.
•Performs comparisons every 15 minutes by default.
|
IBM Health Checker for z/OS exception sent as WTO (default).
|
|
IBM zAware
|
Scores based on message pattern analysis, using message IDs and message clusters, against learned historical message data for each system.
|
•OPERLOG (before Message Flooding Automation).
•LPAR-specific .
|
•Make sure system is likely to work (validate new workloads, new releases).
•Detect events before your business is impacted by detecting message anomalies.
•Diagnose a problem by identifying the potential cause of the problem after event was reported.
|
•Creates a behavioral model of normal, historical behavior based on message ID and by message pattern.
•Applies analytics to determine how far message activity deviates from the model of normal behavior.
•Results updated every two minutes.
|
•IBM zAware GUI shows scores and results.
•Can view all LPARs at once.
•API can be used to make results visible to automation products.
|
Message analysis functions individual benefits
Runtime Diagnostics, PFA, and IBM zAware all provide useful functions to help you achieve high availability. But each performs different processing and offers individual benefits, as listed in Table 2-6.
Table 2-6 Runtime Diagnostics, PFA, and IBM zAware message analysis individual benefits
|
Function
|
Benefits
|
Other considerations
|
|
Runtime
Diagnostics
|
•Simple setup.
•Simple command interface.
•Output provides recommended actions.
•Can search through volumes of messages and isolate critical messages quickly.
•Only consumes CPU time when needed.
•Applies domain knowledge.
|
•IBM-defined list is not modifiable.
•No proactive detection capability (diagnostic only).
•Returns only messages found in last hour (must be used in real-time immediately after symptoms detected).
•Not able to use if system is unresponsive.
•Must be run for each LPAR (when needed).
|
|
PFA
|
•Reasonably simple setup.
•Identifies address spaces potentially causing problem.
•Can detect potentially hung address space or system based on rate that is too high or too low.
•Attempts to understand workload changes across time so that unwarranted exceptions are not produced when workloads change.
•Alerts operator through WTO (by default).
•Alert can be acted on by your automation product.
•Can be customized to exclude erratic address spaces from all processing.
•Requires minimal data to model and little storage for persistence.
•Counts all WTO and WTOR messages for this LPAR, including ISV and application-generated messages (except for address spaces specifically excluded)
•Self-learning based on individual system workload.
•Remodels as necessary to improve understanding of recent trends.
•Exclusion list is modifable.
•Applies domain knowledge and excludes some address spaces by default (such as JES* address spaces and CONSOLE, which cause “noise”).
|
•Relies solely on rates - has no message ID knowledge.
•Has no understanding of which messages are critical.
•Does not provide an option to exclude times when problems were occurring from next model.
•Requires z/OS system resources to run
•Analysis occurs after every collection (15 minutes by default), but is configurable
•Not able to use if system unresponsive.
•Must be running on each LPAR you want analyzed.
|
|
IBM zAware
|
•Independent of the operating system; can be used even if system is unresponsive.
•Consumes minimal additional z/OS system resources.
•Analyzes by message ID and the group of messages that they normally appear with (this is referred to as “clustering” in IBM zAware terminology).
•Analyzes messages by count to determine whether rate is higher than expected
•Can analyze large volumes of messages and isolate intervals of anomalous behavior quickly.
•Finds anomalous behavior of newly changed workloads, newly installed products, or changes due to a new release based on message ID and patterns.
•Tells you about anomalies, in contrast to Runtime Diagnostics, which looks for a set of known problems. IBM zAware tells you what is different, and you determine whether it is a problem.
•Near real-time analysis with the IBM zAware GUI, which is refreshed every two minutes.
•The IBM zAware APIs can be used to automatically monitor for intervals with an anomaly score above a threshold that you specify.
•Can exclude data from next model by day.
•Groups analysis results by sysplex (not consolidated; each LPAR is analyzed separately).
•Analyzes all messages in OPERLOG for each LPAR, including ISV, suppressed, and application-generated messages.
•Model can be updated to reflect a “new normal.”
•Analysis of messages can be done for problems that started days or weeks ago (if datis available).
•Applies domain knowledge; gives more weight to critical messages and removes specific messages as “noise” (such as JES2 messages).
|
•More effort required to set up than Runtime Diagnostics or PFA.
•Cannot exclude specific address spaces or specific messages.
•Cannot detect message traffic that is unusually low or messages that are missing.
•The message text listed in the interval view might not be representative of the message related to the problem (for message IDs that have multiple possible message texts).
•Requires more data for training and more storage for persistence.
•Must be retrained if workloads or system changes significantly from model.
•Each LPAR analyzed must be connected to IBM zAware.
•No automated alerts (by default), but can be automated through APIs and XML output.
|
2.8 Additional tips to achieve high availability
The following section contains additional tips for using the various functions and products to help you achieve high availability.
•Use IBM Health Checker for z/OS to avoid problems.
– Start IBM Health Checker for z/OS at IPL.
– Do not ignore the results of the migration checks.
– Investigate exceptions and take appropriate action. Aim to have Health Checker run with zero exceptions.
– Automate exceptions issued by IBM Health Checker for z/OS.
•Use Runtime Diagnostics to quickly diagnose problems.
– Invoke Runtime diagnostics when:
• The help desk or operations staff reports a problem on the system.
• You need to get ready for the “bridge call” or for a meeting in the “war room.”
• PFA detects abnormal behavior.
In z/OS 1.13, start Runtime Diagnostics at IPL. If you do not start Runtime Diagnostics, PFA cannot detect when an address space or the system might be hung.
•Use PFA to detect and alert you to potential failures.
– Investigate PFA exceptions and take appropriate action based on PFA reports.
– Tune PFA checks for your installation.
– Automate the PFA Health Check exceptions after the checks have been tuned.
•Use the z/OSMF Incident Log to help you gather diagnostic data and send it to IBM service.
•Use IBM zAware to detect message anomalies and diagnose problems
– Investigate occurrences of message anomalies.
– Retrain IBM zAware after anomalies caused by changed environments are investigated and at least one full day has passed.
– Use IBM zAware when a system problem is detected and you need to pinpoint when the problem started to occur and what the source of the problem could be.
– Use IBM zAware to get an indication whether the problem is affecting multiple systems or only a single system, or whether anomalous message activity on another system might be related to the problem you are investigating.
– Use IBM zAware when the system is unresponsive.
•Use the availability tools provided by z/OS components to find problems within those components.
•Automate critical messages.
– Keep your automation current. Automation can only detect messages you define to it.
• Automate new messages each release.
• Automate new messages delivered through PTFs.
• Automate z/OS, middleware, ISV, and application messages.
2.9 Sample scenarios
The following section defines sample problem scenarios and suggests the functions and products you can use to detect and diagnose the problem.
Note that providing sample scenarios for z/OS component functions and specific examples of using z/OSMF or the z/OSMF incident log task are beyond the scope of this book. There is also little mention in this section of scenarios using IBM Health Checker for z/OS. This does not imply that these functions are less important, but they are not the focus of this document. For detailed information about those topics, consult the following publications:
•z/OSMF Configuration Guide, SA38-0652
•z/OS Management Facility, SG24-7851
•IBM Health Checker for z/OS, SA22-7994
•Exploiting the IBM Health Checker for z/OS Infrastructure, REDP-4590
Also refer to the IBM System z Advanced Workload Analysis Reporter (IBM zAware) Guide, SC27-2623, for more detailed information about using IBM zAware and its GUI interface for detecting and diagnosing system problems.
2.9.1 The system is unresponsive
If the system is too sick for Runtime Diagnostics, PFA, or any other functions or products dependent on the operating system to be operational, IBM zAware is available for diagnostics to see if anomalous messages were issued on the failing system.
Using IBM zAware’s GUI, identify times of anomalous behavior to help identify the source of the problem.
2.9.2 A sysplex problem exists in which all LPARs are affected
Assume that you have a large sysplex of more than twenty LPARs. All the LPARs seem to be exhibiting abnormal behavior, but PFA has not issued any messages.
Searching the OPERLOG yourself is an option if you know exactly what to search for, or you are able to digest the huge number of messages a large sysplex can produce in a short time. Unfortunately, the root cause of the problem might be one message buried among thousands and thousands of messages.
Runtime Diagnostics might be helpful, but to obtain the full picture of where the problem originated, you might have to invoke Runtime Diagnostics on every LPAR. And the message indicating the issue might not be one of the messages Runtime Diagnostics detects, or it might have been issued more than an hour ago.
You could simply IPL the LPARs one at a time until the problem is resolved. But this activity is quite disruptive and history shows that you would need to IPL more than half of the LPARs on average to find the source.
In this case, IBM zAware is the most logical place to start diagnosing this scenario. In IBM zAware’s Analysis view, there might be messages that are issued frequently, causing the bars in the IBM zAware output to be orange in color the closer you get to the current time, because there are now multiple problems occurring.
However, the source of the problem might be more readily identified by looking for a bar prior to the problem being known that identifies the following anomalous behavior:
•A unique message; that is, a message that did not exist in the model database was issued
•One or more out-of- context messages was issued
•Some message was issued more frequently than is normal
The fact that the IBM zAware GUI shows all LPARs in a sysplex makes it easier to identify a problem that exists across the sysplex. It can also help you identify a trigger event on a system other than the one that is currently having a problem.
2.9.3 Software changes have been made to your system
Both IBM Health Checker for z/OS and IBM zAware provide useful, but different, ways to avoid and detect abnormal behavior after significant software changes on your system.
Use IBM Health Checker for z/OS to avoid problems
IBM Health Checker for z/OS can detect configuration settings that are not compatible if a check exists for it. If the software change is a new release of z/OS, many checks exist in the operating system to detect whether migration actions have been performed. Do not ignore the results of these checks, as they are provided specifically to help you avoid problems after migration.
Use IBM zAware to detect and diagnose problems
IBM zAware can be quite useful in helping you to determine whether software changes in your installation are behaving correctly. Consult IBM zAware whenever a significant change is made in your installation.
When new software levels are installed, or when system settings or the system configuration have been altered, use IBM zAware to answer the following questions:
•Are new, unusual messages being issued during periods immediately following the changes to your system?
•Are more messages issued than expected?
When you are satisfied with the behavior of your new environment, use IBM zAware training functions to update the model. The newly collected data is included in the new model so that IBM zAware does not erroneously identify new normal messages as being anomalous.
2.9.4 IBM zAware detects an anomaly
If IBM zAware detects an anomaly (as reported by the height and color of the bar on the GUI), the cause might be a message that has never been seen before, a message that appears out of context, or a message that occurs more times than expected. Use the IBM zAware GUI to drill down to obtain more details about the anomaly:
•Investigate the messages with the largest interval contribution score.
•Check to see whether the messages were for the same component, subsystem, or product. This might indicate the component, subsystem, or product is misbehaving and might need to be restarted.
For additional information, use Runtime Diagnostics on the system exhibiting the message anomaly.
•Correlate Runtime Diagnostics events with the message anomalies.
•Perform actions recommended in the Runtime Diagnostics events.
2.9.5 PFA message arrival rate check exception issued for a high rate
When the PFA message arrival rate check issues an exception for a message rate that is too high, the exception typically occurs due to a burst of messages. PFA can detect the address space causing the burst in some cases, but it has no knowledge of the message IDs that were issued.
IBM zAware complements the PFA message arrival rate check because it provides the message IDs and the exact times of those messages, and provides deeper analysis to help you identify the source of the burst that was detected by PFA.
In addition, a high message arrival rate might actually be sympathy sickness caused by another problem. Using IBM zAware, you can identify whether there were any unique messages or other anomalies prior to the high rate.
For further problem determination, Runtime Diagnostics can be used to identify whether there were other causes of the high rate of messages. For example, an address space that is looping might be the source of the high message arrival rate.
When an exception occurs in the PFA message arrival rate check for a rate that is too high, follow these steps:
1. Examine the PFA report in SDSF.
– Note the time of the exception.
– Note the address spaces listed.
2. In IBM zAware, find the LPAR for which PFA issued the exception.
– Using the time of the exception noted in step 1, find the interval in which the exception occurred and drill down to determine more information about the anomaly in that interval.
– On the sysplex view, look at the message intervals prior to the exception. Determine if there were any unique messages identified or any other anomalous behaviors that could be the true source of the error.
– Review the message details in the message documentation for the messages identified. Follow the directions provided by the message to continue to diagnose and fix the problem.
3. If the problem has not yet been identified or resolved, use Runtime Diagnostics to see if there is another reason for the high message arrival rate.
– Invoke Runtime Diagnostics on the system that issued the PFA exception.
– Determine whether any events are issued for the address spaces identified in step 1 or if any events have been issued for other address spaces for reasons that could be the source of the high message arrival rate.
2.9.6 PFA exception issued for a low rate
When PFA issues an exception for a message arrival rate that is too low, an SMF arrival rate that is too low, or an enqueue request rate that is too low, Runtime Diagnostics has already been invoked and the results are in the report available in SDSF. Therefore, the starting place for your investigation should be the PFA report.
Most often for a rate that is too low, Runtime Diagnostics detects some form of contention such as ENQ contention, GRS latch contention, or z/OS UNIX latch contention, or it detects high local lock suspension.
If the problem seems to be sympathy sickness, use IBM zAware to determine whether there was a unique message prior to the PFA exception that could identify the source of the problem as described in step 2 of section 2.9.5, “PFA message arrival rate check exception issued for a high rate” on page 91.
2.9.7 PFA exception issued for a high SMF arrival or high ENQ request rate
When PFA issues an exception for an SMF arrival rate that is too high or an enqueue request rate that is too high, the starting place for your investigation should be the PFA report. PFA attempts to identify the address spaces that are the cause of the high rates and prints them on the report.
For further problem determination, Runtime Diagnostics can be used to identify whether there were other causes for the high rates. For example, an address space that is looping might be the source of the high SMF arrival rate or the high ENQ request rate.
For additional diagnostics, IBM zAware can be consulted to determine whether there are any other message anomalies on the system.
When an exception occurs in the PFA SMF arrival rate check or the ENQ request rate check for a rate that is too high, follow these steps:
1. Examine the PFA report in SDSF.
– Note the time of the exception.
– Note the address spaces listed.
If the exception is for the SMF arrival rate check, review the SMF records sent by the address spaces identified on the report and examine the system log to determine what caused the increase in SMF activity.
2. Use Runtime Diagnostics to see whether it detects an event that might be the reason for the high rate.
– Invoke Runtime Diagnostics on the system that issued the PFA exception.
– Determine whether any events are issued for the address spaces identified in step 1 or whether events have been issued for other address spaces for reasons that could be the source of the high rate.
– If Runtime Diagnostics issues an event for the address space with the high rate, the most common events issued are loop events or high CPU events, which is likely the reason for the high rates. The recommended action is to cancel the job.
3. If the problem has not been resolved, use IBM zAware to see whether there any message anomalies prior to the exception.
– In IBM zAware, find the LPAR for which PFA issued the exception.
– Using the time of the exception noted in step 1, find the interval in which the exception occurred and drill down to determine more information about the anomaly in that interval.
– On the sysplex view, look at the message intervals prior to the exception. Determine whether there were any unique messages identified or any other anomalous behaviors that could be the true source of the error.
– Review the message details in the message documentation for the messages identified. Follow the directions provided by the message to continue to diagnose and fix the problem.
If the problem seems to be sympathy sickness, use IBM zAware to determine whether there was a unique message prior to the PFA exception that could identify the source of the problem, as described in step 2 of 2.9.5, “PFA message arrival rate check exception issued for a high rate” on page 91.
2.9.8 Runtime Diagnostics message event detected
In this scenario, Runtime Diagnostics has been invoked and has issued a critical component message event which provides actions recommended for each message event.
If you need to acquire more information about the problem prior to taking the recommended action (which might be destructive), use IBM zAware to further analyze the interval when the message was actually issued, and the intervals prior to the message being issued.
Because Runtime Diagnostics searches back one hour in the OPERLOG (or less if an hour’s worth is not available), it is guaranteed that Runtime Diagnostics message events include only messages that were issued in the hour prior to Runtime Diagnostics being invoked.
2.9.9 PFA and Runtime Diagnostics examples
The following are simply a few examples of PFA exceptions that have occurred on IBM systems used in internal, large test environments.
These systems were not specifically testing PFA and Runtime Diagnostics. That is, they have PFA running simply to detect system abnormalities and Runtime Diagnostics was active so that PFA could invoke it and so that it could be used for additional diagnostics. In other words, these are situations that can also happen in your installation.
•The PFA_ENQUEUE_REQUEST_RATE check issued an exception for an abnormally high rate.
– Investigation showed that a HOLDACTION had not been performed after maintenance was applied.
•The PFA_LOGREC_ARRIVAL_RATE check issued several exceptions while workloads were running at a high stress level.
– The EREP report showed many OC4 abends in a particular module.
– The problem was that a HIPER PTF had not been applied.
•Both the PFA_ENQUEUE_REQUEST_RATE and the PFA_SMF_ARRIVAL_RATE checks indicated that their rates were too low on many LPARs in a 9-way sysplex.
– The sysplex was experiencing a hang condition in a critical address space.
– The problem was detected before it would have been seen externally through other mechanisms, and the problem was fixed quickly without requiring an IPL.
•The PFA_ENQUEUE_REQUEST_RATE issued an exception for the total system ENQ rate being too low because of latch contention in a critical system address space.
– The problem was resolved without the need for an IPL.
•The PFA_LOGREC_ARRIVAL_RATE check caught a problem where one of the middleware started tasks was continuously dumping.
•The PFA_JES_SPOOL_USAGE check caught a problem that at first glance seemed insignificant.
– There was a task that started, used a little spool space, and then ended.
– The check sent an exception when the task was using 14 track groups instead of the expected 0 track groups.
– This exception seemed unwarranted at the time because 14 track groups is so little. However, after further investigation, it was discovered that tracing had been turned on and the tester thought it was subsequently disabled, but it was not.
– Further investigation discovered that there were over 1 million lines of trace output in the spool for the task.
•Both the PFA_MESSAGE_ARRIVAL_RATE check and the PFA_ENQUEUE_REQUEST_RATE check detected rates that were too low for a critical, persistent address space.
– Runtime Diagnostics corroborated the PFA exception by determining that the address space had enqueue contention and was hung.
1 See 2.5.9, “Achieving maximum benefit from PFA” on page 65 for information about the user overrides that are available.
2 System Logger passes the sysplex name for each realtime message that is sent to IBM zAware. However, that information is not available for message data that is sourced from an archive data set. That is why you must perform this association using the Assign function.
..................Content has been hidden....................
You can't read the all page of ebook, please click here login for view all page.