
Over the last five chapters I have described methods, tools, and techniques for the five functions of project management: managing scope, project organization, quality, cost, and time. All five of these require us to make predictions about future performance, but as we all know, we cannot predict the future. We can make informed estimates (guesses), but there always remains some residual uncertainty. I have said several times over the last nine chapters, that the more effort that is put into our estimates, and the more historical information that can be used in guiding them, the more accurate they will be. However, if we put in too much effort, we reach a point where the estimate costs more than the impact of the inherent risk. In a repetitive production environment the uncertainty can be reduced to a very low level, and the emphasis of management becomes to eliminate any variations from the status quo because variations remove certainty and reintroduce risk. In a project environment, because of the essential uniqueness of projects, some uncertainty must always remain, and the emphasis of management becomes to manage the risk. In my view, the essence of project management is risk management.
I describe risk management in this chapter. At the core of risk management is a risk management process. I start by introducing a generic risk management process, and then describing four steps in this process, identifying, assessing, analyzing, and controlling the risk.
10.1 THE RISK MANAGEMENT PROCESS
When describing the management of quality, cost, and time, I repeatedly used the control cycle (Fig. 7.2) to define a process for managing each of them. However, in the case of those three functions, the process informed our thinking, but was not central to the discussion. With risk management, the risk management process (RMP) is central and drives our thinking.1,2 Table 10.1 shows a generic risk management process, and how it is realized by several global standards. Table 10.2 lists those and several other risk management standards. The steps in Table 10.1 are as follows:
Focus on risk management: You should set the project plan up from the start in a way that facilitates risk management.
Identify risks: You should identify potential risks on your project.
Assess risks (qualitatively): There are two parts to assessing the impact of the risks on the project: the qualitative assessment and the quantitative analysis. Qualitative assessment should be made mandatory. It should be done on almost all projects.
Prioritize risks: You need to select risks to be concentrated on. If you try to deal with all the potential risks on a project you will be swamped with too much information
TABLE 10.1 Generic Risk Management Process
| ||||
Generic process | APM PRAM3 | PMI PMBoK4 | PRINCE5 | |
| ||||
Focus on risk | Initiate |
|
| Focus |
Identify risk | Identify | Identify | Identify | Identify |
|
|
|
| Structure |
|
|
|
| Assign ownership |
Assess | Assess | Assess | Evaluate | Estimate |
(qualitatively) |
|
|
| Evaluate |
Prioritize | ||||
Analyze (quantitatively) |
| Analyze |
| Evaluate |
Reduce | Plan response | Mitigate | Identify response | Harness |
| Implement response |
| Select response |
|
Control | Manage response | Manage | Plan & resource Monitor & report | Manage |
| ||||
(Example 10.1). You need to focus on the significant few, and put the insignificant many to one side. Don't forget about them entirely, but let them look after themselves unless they look to become significant. You might ask what if it is a significant many and an insignificant few? The answer is probably don't do your project.
Analyze risks (quantitatively): You can also conduct a quantitative analysis using tools such as three-point estimating and Monte Carlo analysis. This is optional. It takes a lot of effort and so only repays that effort on larger, more complex projects. The qualitative assessment is mandatory, the quantitative analysis is optional. Three-point estimating is easier than full Monte Carlo analysis and so may be used on medium-complexity projects.
Develop a response plan: Having identified the risks, assessed their impact on the project, and selected those for management, the next step is to a plan how to reduce their impact on the project. There are several ways of doing that, depending on the nature of the risk.
Manage the risks: Finally, you manage those risks, and the response plan throughout the project. You monitor whether or not the risk occurs, and take action if it does. Hopefully your response plan reduced the impact if it does occur and makes you better able to respond, further reducing the impact.
TABLE 10.2 Risk Management Standards
| ||
Institution | Name | Number |
| ||
Association for Project Management | Risk Analysis and Management Guide | PRAM |
Project Management Institute | Guide to the Project Management Body of Knowledge | |
Office of Governance Commerce |
| PRINCE2 |
British Standards Institute | British Standard for Risk Management | BS6079 |
Institution of Civil Engineers | Risk Analysis and Management for Projects | RAMP |
Australian Standards | Australian Standard for Risk Management | AS4340 |
| ||
Example 10.1 Focusing on the significant few risks
I worked with the British Museum that had been developing a new gallery. They commissioned a consultant to do a risk analysis. He identified 100 risks and produced a report which became a doorstop. The British Museum didn't know where to start. On the other hand, on a €300 million project to build a fixed link between Copenhagen and Malmö in the south of Sweden, the team identified just 10 significant risks, and by focusing on those managed to reduce the project's duration by six months.
I cannot tell you what risks you are likely to encounter on your projects. What I can tell you is how to identify your risks, and how to categorise them, which may help you assess their impact on your projects.
Techniques for Identifying Risks
There are two main techniques for identifying risk: the organic, creative process and the mechanistic process.
Organic, Creative Process. This approach encourages creative, free-flowing thinking to try to identify risks that may not be obvious in the mechanistic process. Brainstorming, which we met in Sec. 5.3, can be used. Brainstorming is a two step process:
a. During the first step the facilitator (project manager) stands at the white board or flip chart, with a pen in hand, and the team members are encouraged to shout out potential risks. They should be encouraged to say whatever comes into their minds. The facilitator should NOT say that a particular idea is stupid, and so won't write it up. The idea is to encourage free-flowing thinking. A stupid idea from one person can stimulate a good idea in somebody else, and if you tell somebody their ideas are stupid, they will shut up for the rest of the process. The emphasis of this step is quantity not quality of ideas.
b. During the second step you try to sort the wheat from the chaff; delete the ideas that are not sensible risks on the project to be left with ideas for further analysis. What we are left with, the wheat, is both the significant few and insignificant many. We cannot distinguish between those until we have started the assessment. What we delete here is things which are just not relevant. The emphasis of this step is quality of ideas.
Mechanistic Process. With the mechanistic approach, you take a version of the project plan, and work through it in a methodical way to identify risks in each element of the plan. You could use the milestone plan (Sec. 5.3) or the responsibility chart (Sec. 6.4). If you are using the milestone plan, you can ask yourself, milestone by milestone, what can go wrong at this milestone, and if it does go wrong what impact will it have on other milestones. Then as part of the risk-reduction process you can ask yourself how you can stop the risk at that milestone, or if you can't, how can you reduce the impact on other milestones. The use of expert judgement, checklists, and people who have done similar projects in the past can help in this process.
Beware, that if a risk occurs in one milestone, it can have an impact on another to which it is not linked to logically, even on a milestone that is already finished. The logic represents the project going well, and risks are the project not going well. For instance, in an early milestone you can make a design assumption, and the logic represents that design assumption flowing through the project. If at a later milestone you find you cannot make that assumption work, it impacts on every milestone dependent on it, even the milestone where it was first made. There is such a link between milestones A2 and O5 in Fig. 5.2, for instance. Both assume we know sites 1 and 2, and if that is the case, they are not linked. However, if at A2 it proves impossible to use the chosen sites, then O5 is affected. The risk-reduction strategy is to try to make the design assumption less dependent on what is done at the later milestone.
Categorizing Risks
Risks can be categorised according to
![]() The impact they have
The impact they have
![]() Where control of the risk lies
Where control of the risk lies
Impact of the Risk. There are two types of risk under this heading:
1. Business risks
2. Insurable risks
Business risks: These are the risks, or uncertainty, inherent in all our estimates. People tend to treat their project estimates as point-wise correct. However, in reality, our estimates just represent some mid-range value, and they can turn out better or worse than that. (It never ceases to amaze me that in their lives people accept some uncertainty in their estimates of how long things will take, but on their projects they expect their estimates to be exactly correct, Example 10.2.) Business risk is a two-sided risk or uncertainty. Sometimes our projects will turn out better than we expect, when we will make more profit, and sometimes worse, when we will make less profit or even a loss. Table 8.5 analyzes the impact of business risks on a project using three-point estimating.
Example 10.2 Uncertainty of estimates
I did a series of workshops with a consultancy which was having a problem with overruns on its assignments. As a result, it reduced their overruns from an average of 10 percent, twice their annual profit, to about 2 percent. At an early workshop, a director gave a list of overruns. He grouped them by size of overrun in dollars. He started with some nightmares, jobs estimated to cost $40,000 and ending up costing $100,000. His last group were projects with overruns between $2000 and $4000, and the last was a project estimated at $400,000 that overran by just over $2000. I pointed out that the last one only overran by one half of 1 percent, and nobody could expect to estimate better than that. He was not pleased by my contribution.
Insurable risks: These are risks which can only go wrong. There is a hopefully small and random chance that some item of the project will fail. They are called insurable risks, but that is not to say either that an insurance company will want to buy the risk off us, or that we would want them to; see the discussion on risk reduction in Sec. 10.5.
Control of Risk. Risk can also be categorised by where control lies. Control can be internal or external to the project manager's organization, or legal. Internal risks can be technical or nontechnical. External risks can be predictable or unpredictable. Legal risks can fall under the criminal law or civil law, and those under the civil law under the law of contract or the law of tort.
Internal, technical risks: These risks arise directly from the technology of the work, or the design, construction, or operation of the facility, or the design of the ultimate product. They can arise from changes or from a failure to achieve desired levels of performance.
Internal, nontechnical risks: These usually arise from a failure of the project organization or resources (human, material, or financial) to achieve their expected performance. They may result in schedule delays, cost overruns, or interruption to cash flow.
External Risks
External, predictable but uncertain risks: These are ones with reasonably predictable outcomes, should they occur (like tossing a coin). There are two major types of risk in this category: the first is the activity of markets for raw materials or finished goods, which determines prices, availability, and demand; the second is fiscal policies affecting currency, inflation, and taxation. They also include operational requirements such as maintenance, environmental factors such as the weather, and social impacts.
External, unpredictable risks: These are more ambiguous, with possibly unknown potential outcomes. They arise from the action of government or third parties, acts of God, or from failure to complete the project due to external influences. Government can unexpectedly pass new regulatory requirements. Whether a change of government at an election falls in this or the following category is a moot point. Actions of third parties can include sabotage or war, and acts of God are natural hazards such as an earthquake, flood, or the sinking of a ship. Failure to complete can arise from the failure of third parties through bankruptcy, or a totally inappropriate project design. By their nature, these risks are almost all "insurable" risks.
Turning Internal Risks into External Risks. Before discussing legal risks, I wish to discus a point arising from this issue of internal and external risk. In the 1980s, standard contracting practice was to dump risk down the contract chain. The client passed risk on to the contractor and the contractor on to the subcontractor. What you sometimes did was take a risk that the client could control and do something about reducing, and convert it into a risk external to the contractor, for which they can do nothing but allow a contingency. The client then chooses a contractor via compulsory competitive tendering, and awards the job to the contractor that bids the least amount, that is the contractor that has allowed the least contingency and is therefore most likely to fail (Example 10.3 is an apocryphal story about this). In Table 8.5, do you award the job to the contractor that bids 700, 950, 1000, 1050, 1100, 1200, or 1500 units? If you award the work to the firm that bids 700, and they go bankrupt when you are only half way through the project, you have little recourse to cover your losses, and you may have to start the project again.
In the 1990s, standard practice became to try to assign the risk to the party best able to control it: the client took client risk, contractor A their risk, contractor B theirs, and so on. This did not work either because risks are coupled. What happened was the client tried to reduce their risk and increased contractor A's, contractor A tried to reduce theirs and increased contractor B's, and contractor B increased the client's.
What is now viewed as best practice is where there are risks controlled by multiple parties, you should form an alliance of those parties to manage the risk together. Sometimes the risk is only controlled by the contractors, and then it should be assigned to an alliance of the contractors working under a fixed-price contract. Sometimes it is controlled just by the client, in which case they should keep it. Sometimes it is controlled both by client and contractors and they should then form a partnering arrangement to work together to reduce the risk. Viewing the project as a partnership was a necessary condition for project success suggested in Sec. 3.3.
Neil Armstrong was being interviewed about the moon landing and was asked what was the most frightening moment; was it as the Lunar Lander came down and might crash; or was it as he stepped off the ladder; or was it when they came to blast off from the moon and the rockets might not have been powerful enough. No, he said, the most frightening moment was being on the launch pad at Cape Canaveral, and under him were 2000 components, every single one of which had been bought on minimum price tender!!! And one of them did fail in 1986.
Legal Risks. There are three types of legal risk: risks under the criminal law, risks under the law of contract, and risks under the law of tort. (The law of tort is the duty of reasonable care we all have to our fellow citizens. Even where we do not have a contract with somebody, we have a duty to behave responsibly and with reasonable care.) If an employee is killed in an accident at work, you can be prosecuted under health and safety legislation, fined, and potentially sent to jail. You can be sued by his or her estate under the contract of employment, or under the law of tort. If a visitor to your site is killed, you can be prosecuted under the criminal law as above, or the law of tort, but you may have had no contract with the individual. This applies to the software industry as much as the engineering industry with the development of computer control systems to control complex plant (Example 10.4).
Under the criminal law there have been several attempts in the United Kingdom to bring charges of corporate manslaughter. The most recent was when track on a high-speed rail failed, causing a train to derail and killing half a dozen people. In the subsequent enquiry it was discovered that the rail company and their contractors had been reducing maintenance work to save money and so charges were brought. Corporate manslaughter is difficult to prove because one person has to be responsible for the decision that caused the accident, whereas often it is caused by a series of mistakes. In the United Kingdom, the current Labour government is proposing to introduce a charge of corporate killing which could be based on a general culture of sloppiness and irresponsibility, rather than a single incorrect decision.
In the event of a charge being brought, whether as corporate manslaughter or under more general health and safety legislation, or under the law of contract or the law of tort, the case is judged on the basis of what any reasonable professional would have done in the circumstances. Standards improve with time, so you cannot necessarily condemn what somebody did 20 years ago by today's standards, and likewise you cannot excuse a mistake today by the standards of 20 years ago. Examples 10.4 to 10.7 contain four cases, showing how this might apply. The law is not necessarily fair or logical, as Example 10.6 shows. It just tries to be precise.
Example 10.4 Testing a computer control system
Some years ago I was on a course where we were discussing the health and safety legislation, and the duty of care. One of the delegates said he was responsible for testing the control software for a jet fighter used by the Royal Air Force. He said that in a reasonable amount of time they could test 90 percent of all the paths through the software, which would represent 99.9 percent of all the occurrences. However, to test all the paths would take 100 years. His question was what would happen if there was a failure because the control system locked into a path that had not been tested but which had a fault. He was told that he would be judged by what any reasonable professional would have done, and because it was not sensible to test all the paths, he would not be held liable.
A few years later one of that type of aircraft suddenly ejected its pilot over the middle of England and then flew about 150 miles to crash in the Irish Sea. They weren't sure whether the pilot had committed suicide or the computer control system had failed, though the fact that the plane seemed to be on course to crash in the Irish Sea tended to point to the former. However, I thought of the course delegate.
Example 10.5 Seeking damages after 50 years
A woman who worked in an asbestos factory in the late 1930s developed asbestos-related diseases in the 1980s. She sued her former employers claiming they had been negligent in the containment of asbestos in the factory. Her employer had to be judged by the standards of the 1930s, not the 1980s, but was still judged to have been negligent.
Example 10.6 The law is not fair, but scrupulously exact
In the United Kingdom, children with stunted growth are sometimes given growth hormones. Up to 1980, this was made from extracts from the brains of dead people. From July 1978, the government knew this could cause Creutzfeldt–Jakob disease (CJD), the human equivalent of mad cow disease, but did not replace it with a synthetic alternative until 1980. The families of people who had suffered CJD sued the government. The courts ruled that anyone who had been fed the hormone for the first time on or after 1 July 1978 should receive compensation. Anyone who had received it on 30 June 1978 or earlier could not because the government could not have known there was a problem before then. There was one person who had received it for the first time on exactly 30 June 1978, and everyone said this is not fair—not fair but scrupulously exact. (The ruling was subsequently overturned by the Court of Appeal, and all people suffering CJD could claim. People not suffering CJD want to claim now for the fear they have to live with!!!)
Example 10.7 Not judging by today's standards
It was suggested to Sir Winston Churchill in early 1945 that the allies might bomb the railway line leading to Auschwitz, and he said it was not worth the risk. People now react in horror that he could have said such a thing, but they are judging by today's standards. With the technology of 60 years ago they were lucky to drop the bomb within two miles of the target. It saved more lives to use the pilot's life to shorten the war than to go on a fool's errand.
Expecting the Unexpected
Good project managers learn to be risk aware, to expect failure where they least expect it. This is known as Sod's law or Murphy's law, sometimes stated as: if something can go wrong it will; if something can't go wrong, it still will! The value of this attitude is that if you expect things to go wrong, you will be on your guard for problems, and will be able to respond quickly to them. The failures may be ones you had predicted, or ones you least expect. If you anticipate problems, and plan appropriate contingency, you will not be disrupted when those problems occur. If the unexpected then also occurs, you will be able to focus your management effort into the areas that might now cause greatest disruption (Example 10.8). Having said that you must not be so pessimistic you cannot make progress. You need to achieve a balance between blithe optimism and morbid pessimism (see Example 10.9).
Example 10.8 Expecting the unexpected (1)
In the early 1980s, I managed an area of work on the shutdown-overhaul of a petrochemical plant. We were uprating the steam system, and this required us to run a line between the 50-bar and 30-bar steam mains. On the overhaul, all had to do was make the break ins into the two mains at each end of the line. For the 30-bar main this was easy. We made an 8- by 6-inch T-section in advance of the overhaul. In the overhaul we just had to cut the line, which would be completely cold, weld in the T-section, and install an isolation valve. The break-in to the 50-bar main, however, carried greater risk. We had to weld a 6-inch branch onto the 12-inch main just downstream from the main isolation valve, separating the plant main from the factory main. This valve had not been closed in 12 years, and so we did not know if it would shut tight. If it did not, the job would be more difficult, or even impossible. We put considerable effort into drawing up contingency plans in the event of a partial or full leak of the valve. In the event it shut like a dream. However, when we offered up the T-section at the other end, we found it had been made 6 by 6 inch instead of 8 by 6 inch. We therefore had to make a new T-section in a hurry, and an 8-inch pipe of the right pressure rating was not immediately available. That particular job almost extended the duration of the overhaul. However, the time spent planning the other job was not wasted. I knew that so well, I could leave it to run itself and focus my attention on procuring 8-inch pipe.
Example 10.9 Expecting the unexpected (2)
I play bridge as a hobby. We are taught that if the play of the hand looks easy, you should be pessimistic, think about the worst possible layout of the cards and play for that (as long as it doesn't cost you the contract). On the other hand, if the contract looks impossible, you should be blithely optimistic, and play for the only layout of the opposing cards that will enable you to make the contract, no matter how unlikely.
Having identified possible sources of risk to the project, we need to determine their impact. First, we assess the impact of individual risks through qualitative assessment. On more complex projects, we can then determine their combined impact through quantitative analysis. What follows applies to insurable risks. The impact of business risks can be determined through three-point estimating as illustrated in Table 8.5.
The Impact of a Single Risk
The impact of a risk factor depends on its likelihood of occurring and the consequence if it does occur (Fig. 10.1):
Impact of risk = Likelihood of risk × Consequence of risk
To illustrate this concept, consider the question of whether buildings in the British Isles have earthquake protection. The answer is very few do. Multistory office blocks in London do not. The consequence of an earthquake in London of force 7 on the Richter scale would be severe loss of life. However, the probability of such an earthquake is so small, virtually zero, that it is considered unnecessary to take precautions. However, one type of building which does have earthquake protection is nuclear power stations. The likelihood of an

FIGURE 10.1 The likelihood by consequence plot.
earthquake has not changed, but the consequence is now unacceptably high; it would make the surrounding countryside uninhabitable for the next 10,000 years. It has pushed the impact of the risk over a line of tolerance where action has to be taken.
It is suggested that there should be two lines of tolerance in Fig. 10.1. Risks below the first line are the insignificant many, the risks that can almost be allowed to look after themselves. An earthquake of force 7 on the Richter scale is classified as such in the United Kingdom for most building construction. Risks above the first line are the significant few, ones where a risk response is necessary. There is a second line of tolerance of very high likelihood, very high consequence risks. Risks above this line are showstoppers; if the risk cannot be eliminated the project should not go ahead. The consequence of an earthquake under a nuclear power station pushes it here. Earthquake risks in the middle band in the United Kingdom are earthquakes of force 4 or 4.5 on the Richter scale. There is an earthquake force 4 on the Richter scale somewhere in the United Kingdom about three times a year. However, if a building is designed to stand up it is designed to withstand such an earthquake. So action is taken to withstand such an earthquake, but that is to design the building properly according to design regulations. An earthquake force 4.5 will cause more damage, but it is a once in 10 year event. Once every 10 years there will be an earthquake force 4.5 on the Richter scale somewhere in the United Kingdom, and it will damage buildings within about a 2-mile radius, but nobody is likely to be hurt. Buildings are not designed to withstand such an event. Instead they are insured against such an event. It is not cost effective to design every building to withstand the event. Instead it is better to pay a premium to an insurance company, and the insurance companies spread the risk over a large number of buildings over a 10-year period. So we have two insurable risks: one the owner insures by spending money on design and construction; and the other the owner insures by paying a premium to an insurance company.
You see through this discussion that through the two lines of tolerance we have begun to prioritize the risks. There are several further issues that arise.
What Do We Mean by High, Medium, and Low? Figure 10.1 shows us categorizing likelihood and consequence as high, medium, and low. What do we mean by these? The answer
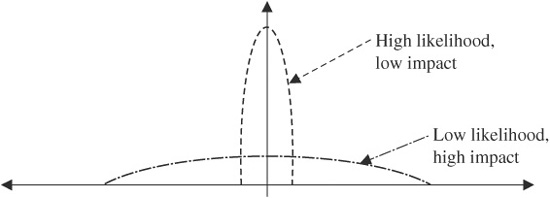
FIGURE 10.2 Low and high likelihood risks.
is whatever is right for your project and your own risk tolerance. You or your organization needs to decide what risk you (it) can tolerate. Project Management Institute (PMI) in their body of knowledge suggests four ranges of figures for likelihood.4 You can use these, but I do suggest you work out what your or your organization's risk tolerance is.
Are Risk on Lines Parallel to the Lines of Tolerance the Same? The equation above is presented as a multiplication which suggests risks with high likelihood and low consequence are the same as risks with low likelihood and high consequence. Unfortunately they are not. The difference is the spread of possible outcomes (Fig. 10.2). Both have the same expected outcome, but the high likelihood, low consequence risk has a much lower spread of potential outcomes than the low likelihood and high consequence. The former has a very predictable outcome, the latter very unpredictable. Thus with the high likelihood, low consequence risk we can give it to a contractor to manage and they can predict quite closely what its impact will be and allow a cost for it. With latter, we have to insure with an insurance company. They buy a large number of risks, some of which will have no consequence, and some a very larger consequence, and spread their risk over a large number of events. So the mitigation strategy is very different for the two types. We saw this with the earthquakes of force 4 and 4.5 on the Richter scale. The former is medium likelihood, medium consequence and we design the risk out. The latter is low likelihood, high consequence, and we insure it.
The Assessment of Risk Is Often Irrational. Unfortunately the assessment of risk is often irrational (Example 10.10), with people giving huge focus to trivial risks, while ignoring huge ones. Example 10.10 may seem extreme, but it happens in companies that executes focus on trivial issues while ignoring significant risks. You need somehow through the risk identification process to protect against that. Sometimes, however, companies are responding not to their own assessment of the risk, but the public perception (Examples 10.11 and 10.12). Example 10.10 does illustrate one thing. In that case the deaths at the time were running at five per year, but it was not known how high the epidemic would rise. Would the peak number of deaths per year be five, or five thousand, or even five million? This was a very low probability but potentially very high consequence risk. This apparent irrationality in the assessment of risk seems to be an inbuilt mistrust human beings have of low likelihood, high consequence risks, and the associated ambiguity.
Example 10.10 The irrational assessment of risk
A classic example of the irrational perception of risk was the reaction to mad cow disease in Britain. First, the public behaved irrationally, and sales of beef plummeted. The number of deaths from new form CJD, which may, just may, have been caused by bovine spongiform encephalopathy (BSE), was running at 5 per year, about the same number of people that die from allergic reaction to peanuts. But TV reporters would go down to the local supermarket to interview an average shopper, smoking a cigarette (100,000 deaths a year in the United Kingdom from smoking-related diseases), with a trolley load of beer (50,000 deaths a year in the United Kingdom from alcohol-related diseases), and a car in the car park with bald tyres (3000 deaths a year in the United Kingdom from road accidents). "Are you eating beef," asked the reporter. "No," said the shopper, "It's too dangerous."
The public seem to have come to their senses, but then the government began behaving irrationally. For several years they made the selling of a T-bone steak a crime as heinous as the selling of crack cocaine, because it is expected to kill one person every 20 years. The agriculture minister appeared on the TV saying he was concerned about public health!!! If he was concerned about public health he would ban peanuts before a T-bone steak.
Example 10.11 Public perception of risk
In the 1980s, a firm of British engineering design consultants put considerable effort into designing and testing railway wagons for transporting low-level nuclear waste around the country. There were some highly publicised experiments in which a locomotive was slammed into a wagon at 100 miles per hour. In this case, the likelihood of an accident which would result in a release of radiation was small, and the consequence was also small, no immediate deaths, perhaps one or two additional cancer cases resulting in early death several years later. However, this is a highly emotive public issue, and hence the need for indestructible wagons. On the other hand, quite lethal chemicals are transported around in relatively flimsy wagons. In the early 1980s, I worked close to a railway line, along which passed a train towing two wagons filled with cyanide gas twice a day. The consequence of a crash involving a leak in the centre of a city would be instant death to thousands of people, but this is not a public issue. A thousand instant deaths from cyanide gas seem to be more acceptable than two lingering deaths from radiation-induced cancer.
Example 10.12 The value of project opinion and the environment
In the early 1980s, the British government proposed storing medium-level nuclear waste in a redundant mine under the factory I worked near a town called Billingham in the North East England. It may have been one of the safest proposals for storing medium-level waste. The project would apparently cost the company I worked for, ICI, nothing but earn them an income; an attractive project with no risk attached. However, ICI would not allow the project to proceed because that was not the way the local community viewed it, and ICI was concerned about local opinion. The ironic thing was ICI used to operate one of the country's largest private nuclear sources on the Billingham site.
It is almost certainly incorrect to say that the project would have "cost ICI nothing." It was causing a loss of goodwill in the local community, and so the cost was whatever value the company put on that goodwill. Clearly they did not think that cost was worth the returns.
Local house prices were falling, so the people who were going to pay for the project were the local community. It was possible to put a price on the environmental impact of the project, and ICI was not willing to bear that, nor let the local community bear it.
As I have said, having identified the risks, it is necessary to prioritize the risks for further analysis and management attention. Drawing Fig. 10.1 and marking the risks on is one way of doing that. Risks that lie below the first line of tolerance are the insignificant many risks that can almost be allowed to manage themselves. Those between the first and the second line of tolerance are the significant few, for which an active risk-reduction strategy must be found and the risks must be managed using the processes described in Sec. 10.5. Those above the second line of tolerance must either be eliminated or the project not attempted.
Analytical Hierarchical Programming. People are also now recommending a technique known as analytical hierarchical programming6 (AHP) to prioritize risks. By that technique, pair-wise comparisons are made of the likelihood and consequence of each risk to assign each risk an individual score to be able to rank order their significance, and also determine their relative significance. That can be done with a two-parameter model of likelihood and consequence and a three-parameter model including public perception. The advantage of AHP is you don't need to decide whether each risk scores high, medium, or low against each parameter, just how each risk compares with all the others against that parameter. It is a powerful technique for prioritizing risks.
Table 10.3 shows a simple example, analyzed in Example 10.13. This is a very rough example. If you want to use AHP to prioritize risks, I suggest you read about it more fully.
Example 10.13 Risk prioritization using analytical hierarchical programming
The project in Table 10.3 has three risks, and we do pair-wise comparisons of likelihood and consequence of them, judging each on a scale of 1 to 7 (1 is the same, 7 is an order of magnitude different). We enter the comparisons in a matrix. The diagonal of the matrix is always 1 because we are comparing the risk to itself. In this case, we decide risk 1 is very much more likely than risk 3 and much more likely than risk 2, and risk 2 is much more likely than risk 3, hence the top-half of the matrix. The bottom-half of the matrix is always the reciprocal of the top-half because we are doing the comparison the other way. We add the rows and normalize by dividing by the sum. We repeat the process for consequence. We decide the consequence of risk 3 is much greater than risk 1 and very much greater than risk 2, but the consequence of risk 1 is just greater than risk 2. Thus we enter the comparison of risk 1 and 2 in the top row but the comparison of risk 3 with the other two in the bottom row. We fill in the other cells as the reciprocals
TABLE 10.3 Analytical Hierarchical Programming
| |||||
Likelihood | Risk 1 | Risk 2 | Risk 3 | Sum | Norm |
| |||||
Risk 1 | 1.00 | 3.00 | 6.00 | 10.00 | 0.63 |
Risk 2 | 0.33 | 1.00 | 3.00 | 4.33 | 0.27 |
Risk 3 | 0.17 | 0.33 | 1.00 | 1.50 | 0.10 |
|
|
|
| 15.83 | 1.00 |
| |||||
Consequence | Risk 1 | Risk 2 | Risk 3 | Sum | Norm |
| |||||
Risk 1 | 1.00 | 2.00 | 0.33 | 3.33 | 0.22 |
Risk 2 | 0.50 | 1.00 | 0.17 | 1.67 | 0.11 |
Risk 3 | 3.00 | 6.00 | 1.00 | 10.00 | 0.67 |
|
|
|
| 15.00 | 1.00 |
| |||||
of those we have estimated. We add the rows and normalize again, and then add the two normalized columns. The total for risk 1 is 0.85, risk 2 is 0.38, and risk 3 is 0.77. Thus risks 1 and 3 are almost equivalent and risk 2 half as significant.
Influence Diagrams. Influence diagrams are a tool derived from systems dynamics, which can assist in risk assessment. They show how risks influence one another; some risks reinforce others (+), and some reduce others (−). Figure 10.3 is an example of an influence diagram. The power of the technique is to identify loops of influence. Vicious cycles have an even (or zero) number of negative influences and so any disturbance is magnified around the loop. Virtuous cycles have an odd number of negative influences, and so a disturbance is attenuated around the loop. In Figure 10.3, loop ADEKLIBA is vicious, and loop ADEGHJIBA is virtuous. Drawing the loop can help with top-down, qualitative assessment, identifying how risks influence each other. However, if used with simulation software, they can be used as part of qualitative analysis as well.7
Combining Risks
Having identified and prioritized those risks for further analysis, we should consider how they impact on each other. There are two ways of doing that: a bottom-up approach, which is the subject of the next section; and a top-down approach which continues the qualitative assessment, and is discussed here. The top-down approach was first introduced when

FIGURE 10.3 Influence diagram.
I described the mechanistic approach to identifying risks. You consider how the risks impact on each other, and what you can do to minimize that impact. A word of caution: you do need to be careful with the prioritization above. There may be a risk that on its own appears to be low consequence so you decide not to take it forward for further investigation, but it is a trigger for a much bigger risk. If it is a trigger for a much bigger risk it is not low consequence, but that may not be obvious when looking at it on its own. But you do need to be aware of that when thinking about risks, what they trigger, and what are triggers for them.
The top-down approach can provide the manager with checklists of potential risk factors based on previous experience, and can help them to determine their relative importance. Furthermore, by identifying the controlling relationships at a high level, it enables the project manager to find ways of eliminating the most severe risks from their projects. The approach is to take a component breakdown for the project, and evolve it down to the integrative level with about 20 elements of the breakdown. The component breakdown chosen will depend on what it is that is expected to create risk. It can be the project breakdown structure (PBS), work breakdown structure (WBS), organization breakdown structure (OBS), cost breakdown structure (CBS), or bill of materials (BOM) for the new asset. You then identify the risk associated with each component, and critically the links between the risks. If one risk occurs, does it make another more or less likely. You then concentrate on either eliminating the risk associated with each component, or breaking the links between the risks. If you are successful in breaking the links, you can isolate each risk in the breakdown structure. The reason for limiting yourself to 20 components is if you have a sheet of paper describing each risk and each link, that is, 400 sheets of paper. If there are 30 components you have 900 sheets.
Two tools introduced previously which provide a clear representation of the PBS, WBS, and OBS to an appropriate level are the milestone plan (Sec. 5.3) and the responsibility chart (Sec. 6.4). The milestone plan shows the PBS at the integrative level. The responsibility chart shows the OBS, PBS, and WBS at the integrative level on one document. It also shows how these are influenced by one element of the CBS, the work content, and by the timescale. It is therefore a very powerful document for top-down risk analysis.
Figure 10.4 shows a simple four work-package project to illustrate the top-down approach. The analysis is in Example 10.14.
Example 10.14 Top-down analysis to combine risks in Fig. 10.4
The project in Fig. 10.4 consists of four work-packages to build a warehouse. The duration is seven months. We consider whether it is possible to fast track some of the work and conduct a risk analysis to decide if that is sensible. We decide it is not possible to fast track the lower path, A-C-D, but turn our attention to the top path, A-B-D. We

FIGURE 10.4 A four work-package project to construct a warehouse.
decide it is possible to overlap packages A and B; some of the design of the foundations will be finished one month into the design work, and so work on the foundations could start two months before the end of the design work. We show this potential overlap by putting a lead of −2 on the link from A to B. Is there any risk associated with starting the work on the foundations early? The answer is "Yes!" The design of the building may change the design of the foundations and so if we start early there may be potential rework. And we might ask if there is any value in starting early since the duration along the top path is seven months, the same as along the bottom path. Is there any risk in not starting early? The answer is "Yes!" The duration of the top path is much more at risk than the duration of the bottom path, being subject to inclement weather. If, for instance, the design starts on October 1, then without fast tracking the foundation work will be done in January and February, the worst time of the year to be doing it in Britain. Better to try and get it finished in November and December. Having recognized the previous risk, can we reduce the chance of rework? The answer is "Yes!" We could do the foundation work which is unaffected by the design of the building in month two, such as access roads and drains, and the foundation work which is more likely to be affected in month 3, when hopefully the design of the building is more stable (if not the project will be delayed anyway).
The bottom-up approach to combining risks is quantitative analysis. As I said in Sec. 6.2, this will only be conducted on larger, more complex projects, because considerable time and effort is required to do it, and so there must be sufficient potential benefits to repay the effort. There are several ways of doing quantitative risk analysis on projects:
Three-Point Estimating. Table 8.5 is an example of three-point estimating. It applies more to business risks than insurable risks, although it is sometimes possible to convert an insurable risk into a three-point estimate. What we do is for each activity or work package estimate the most likely outcome, most optimistic, and most pessimistic. We can do this for cost and time. We then work out the raw estimate, the worst possible outcome and the best possible outcome, though as I said in Sec. 8.3 the chance of actually achieving the best or worst case is small. Using the 1:4:1 formula given in Sec. 8.2, we also calculate the expected outturn for each activity or work package, and from that estimate the expected outturn for the project. Table 10.4 contains three-point estimates for the project in Fig. 10.4. Using the likely values, the critical path is A-C-D and the duration 7 months. Using the optimistic values the critical path is both A-C-D and A-B-D and the duration is 5 months. Using the pessimistic values the critical path is A-B-D and the duration is 12 months. Using the expected values the critical path is A-C-D and the duration is also 7.5 months. (In all calculations I have used the 2-month lead between A and B.) The same process can be applied to the cost of the project, as in Table 8.5.
TABLE 10.4 Three-Point Estimates for Fig. 10.4
| ||||
Work pack | Optimistic | Likely | Pessimistic | Expected |
| ||||
A | 2 | 3 | 4 | 3 |
B | 2 | 2 | 6 | 2.5 |
C | 1 | 2 | 3 | 2 |
D | 2 | 2 | 4 | 2.5 |
| ||||
Program Evaluation and Review Technique. The program evaluation and review technique (PERT) applies three-point estimating to critical path analysis (Sec. 9.3). This is effectively what I did above when discussing Table 10.4. You can calculate the schedule and the critical path using optimistic, pessimistic, most likely, and expected values of the duration of each activity. The expected values (calculated using the 1:4:1 formula) are taken as providing the best indication of the schedule.
Monte Carlo Analysis. What three-point estimating shows is there is a range of possible durations and costs for our projects. What we would like to know is what is the probability that the cost or duration will be less than a certain value. I was indicating that in Table 8.5 when I suggested that the sanction value of the project should have an 80 percent chance of being achieved. So how do we calculate these probabilities? With the network in Fig. 10.4 I assumed various probability distributions for the durations of the four packages of work, as follows. The design make take 2, 3, or 4 months with the following probabilities:
2 months: 25 percent
3 months: 50 percent
4 months: 25 percent
The delivery of the steelwork could take 1, 2, or 3 months with the following probabilities:
1 month: 25 percent
2 months: 50 percent
3 months: 25 percent
Because of the chance of snow during December through February, I assumed the duration of the site work could be between 2 and 6 months with the following probabilities:
2 months: 75 percent
3 months: 19 percent
4 months: 3 percent
5 months: 2 percent
6 months: 1 percent
Finally, because of the chance of wind in February, March, and April, the duration of the erection of the steel work could take 2, 3, or 4 months with the following probabilities:
2 months: 75 percent
3 months: 20 percent
4 months: 5 percent
I was then able to calculate the probability of achieving durations between 5 and 12 months. The pointwise and cumulative probability distributions are shown in Table 10.5. You see the most likely duration for the project is 9 months, but there is an even chance it will be finished within 8 months. But the chance of actually achieving the raw estimate, 7 months, is less than 1 in 5. So when this project that was estimated to take 7 months takes 8, because the snow fell in January and the wind blew in March, is the project manager at fault? I think he or she is at fault for not raising awareness of the possible impact of the weather. The project will never last the theoretical minimum or maximum value 5 or 12 months, and has only a small chance of lasting 6, 10, or 11 months. This is compatible with the assumptions I made in Table 8.5.
TABLE 10.5 Pointwise and Cumulative Probability Distributions for the Project in Fig. 10.4
| ||
Project | Pointwise | Cumulative |
| ||
5 | 0% | 0% |
6 | 5% | 5% |
7 | 13% | 18% |
8 | 32% | 50% |
9 | 40% | 90% |
10 | 8% | 98% |
11 | 2% | 100% |
12 | 0% | 100% |
| ||
Calculating these probabilities by hand took an hour for just a four-activity network. It becomes impossible for anything larger, and so we resort to using Monte Carlo analysis.
This is done using a proprietary add-on either to our network scheduling software, or Excel. For every time or cost estimate for which we have a three-point estimate, we choose a probability distribution from standard library. The Monte Carlo software then runs the project model a larger number of times, typically somewhere between 1,000 and 10,000 times. Every time it runs the model, it chooses a value for each estimate for which there is a three-point estimate based on the assigned distribution, and thereby works out the total cost and duration. Each time it runs it will achieve a value somewhere between the theoretical minimum and maximum. The program counts the number of times each duration or cost was calculated, and thereby works out an empirical probability distribution for the duration and cost of the project. These can be used to estimate the cumulative probability distribution for the outturn of the project, as suggested in Table 8.5. Figures 10.5 and 10.6 show pointwise and cumulative distributions respectively, for a project calculated using a standard package, Crystalball.
Another use of the results is they may help us identify risks causing the variability and so help us reduce or eliminate them. It is possible to work out several critical paths through

FIGURE 10.5 Pointwise probability distribution calculated using Monte Carlo analysis.

FIGURE 10.6 Cumulative probability distribution calculated using Monte Carlo analysis.
the network, determine what is causing them to be critical, and try to eliminate or reduce those risks. Likewise, you may be able to see several peaks in the costs estimate that again indicates particular risks causing the variability in cost. It is possible to see three or four peaks in Fig. 10.5, which may point to particular risks.
Having identified and assessed the risk, we now work out how we can reduce the risk and manage it through the project.
Reducing the Risk
There are three basic approaches to reducing the risk:
1. Avoid it: You plan to eliminate or substantially reduce the risk.
2. Deflect it: You try to pass the risk on to someone else.
3. Contingency: You draw up contingency plans should the risk occur.
Pym and Wideman8 use an analogy of a cowboy being shot at. He can take cover to avoid the bullets; he can get somebody else to stand between him and the bullets (though there is still a chance the bullets will carry on through and hit him); or he can allow them to hit him, hope he gets to hospital in time, and that the damage can be repaired. When you put it that way, plan to fail and hope we don't fail absolutely, it sounds better to use one of the other two approaches.
Avoidance. I showed above on the warehouse project, how to avoid the risk of snow holding up the preparation of the foundations by starting the work early enough, so that it is finished before the snow comes. Under avoidance, you change the plan to reduce the risk or eliminate it entirely.
Deflection. There are three ways of deflecting risk:
1. Insurance: by which it is passed on to a third party
2. Bonding: by which a security is held against the risk
3. The contract: by which it is passed between owner, contractor, and subcontractors
Insurance: A third party accepts an insurable risk (Sec. 10.1) for the payment of a premium. I showed above that this will only be used with risks of low likelihood and high impact. Because they are low likelihood it is not cost effective for the owner to take action, but occurrence of the risk can be devastating. The insurance company spreads the risk over a large number of similar risks, expecting just a small number to occur, but those that do occur will have high impact. Also don't assume what you will insure as an individual your company will insure. You will insure your car for damage and you house against fire, because for you those are low likelihood, high consequence risks. But for a company with a large fleet of cars, they are a medium likelihood medium consequence risk and they will allow a contingency. Likewise, the government doesn't insure buildings for fire damage. The government has so many buildings that it is a high likelihood, medium consequence risk and again it will allow a contingency.
Bonding: One or both parties to a contract deposit money into a secure account so that if they or either party defaults the aggrieved party can take the bond in compensation. This is a way of transferring the risk of one party defaulting to that organization.
Contract: Through contracts, the risk can be shared or passed between owner, contractor, and subcontractors:
a. A risk can be passed to the contractor under two circumstances. The first is where they are the best party to control it. They can then accept any type of risk and apply the techniques described here to control it. Where the contractor cannot control the risk, any risk passed to the contractor should be high likelihood, low consequence risk. Then the impact of the risk is predictable, the contractor can allow a contingency for it, and add a profit margin for accepting it. All the contractor can do is allow a contingency, and the client accepts paying that profit margin. If the contractor cannot control the risk, it would not be sensible to accept anything but a high likelihood, low consequence risk for which a predictable contingency can be made, and it would not be sensible of the client to give it to them because it increases the chance of failure of the project.
b. I said above (Sec. 10.1) that where there are multiple risks controlled by the client and several contractors, it is best to form an alliance and work together to try to reduce the risks. If coupled risks are assigned individually to separate parties they will be fighting each other as each tries to reduce the risk for which they are responsible, to the detriment of the project, and all concerned. Clients need to realize this. So the best arrangement is to form an alliance and work together in partnership to try to reduce the risks. But the client should only be in the alliance if there are risks within their control, and the contractors if there are risks within their control.9 I said in Sec. 3.3 that a necessary condition for project success is to view it as a partnership.
Contingency. The third response to risk is to make an allowance for the risk, to add a contingency. You can add an allowance to any one of the five functions, scope, organization, quality, cost, and time, but typically there are two main approaches:
1. Make an allowance by increasing the time and/or cost budgets.
2. Plan to change the scope, by drawing up contingency plans should the risks occur.
Time and/or cost: You can either add the allowance as a blanket figure, calculated through a bottom-up approach as above, or you can add it work element by work element. Either way, the project manager should maintain at least two estimates, as described in Secs. 8.2 and 9.1. These are the raw estimate without contingency, and the estimate with contingency. The former, called the baseline, is communicated to the project team for them to work to, and the latter to the owner, for them to provide money and resources. The project manager may also maintain two further estimates, the most likely outturn, the figure to which they are working, and the current estimate, which is the baseline with some contingency already consumed. The reason for giving the project team the baseline or current estimate as the figure to work to is they will seldom come in under the estimate, and will consume contingency if it is given to them. The reason for communicating the estimate with contingency to the owner is they want to budget for the maximum likely time and cost.
Contingency plans: These are alternative methods of achieving a milestone, to be used if a risk occurs. Contingency plans can be of three types:
a. Purely after the event: Contingency plans are drawn up to be enacted if the risk occurs.
b. After the event with essential prior action: Contingency plans are drawn up to be enacted if the risk occurs. However, some preparation work must be done, such as procurement of long lead items, to speed up the reaction time and so reduce the consequence of the risk. The cowboy above can pay to have an ambulance stood by, with paramedics able to treat him and get him to hospital quicker if he is shot.
c. After the event with essential mitigating action: Contingency plans are drawn up, but the design of the facility or work methods changed to reduce the cost of implementing the contingency plan. The upfront cost may be increased to reduce the likelihood of the risk. The cowboy above wears a bulletproof vest.
With (2) and (3) there is a cost associated with the essential or mitigating prior action to reduce the consequence or likelihood of the risk. You can apply the likelihood by consequence formula crudely to see if the action is worthwhile.
L × C > l × c + cost
If the likelihood (L) by consequence (C) without the action is greater than the likelihood (l) by consequence (c) with the action plus the cost of the action, the action is worthwhile. The comparison is usually clear one way or the other; if it is marginal, don't bother, or do further investigation. In Example 10.8, we drew up alternative plans should the valve shut tight, shut partially, and not shut at all. The latter plans each would have cost more than the first, which is the one we followed, although the second would have only been marginally more expensive.
Contingency plans are the least preferred option. It is better to plan to eliminate the risk than to plan how to overcome it, and it is better to plan how to overcome it than to increase the cost and extend the duration to pay for it.
Summary. Table 10.6 shows where the different response strategies are used in the likelihood by consequence plot of Fig. 10.1.
I have put "no action" against the insignificant many. They should be left on the risk register and watched, but no action taken. You should focus on the significant few, the 20 percent that have 80 percent of the impact.
TABLE 10.6 Risk Response Strategies
| |||
| Consequence | ||
|
| ||
Likelihood | Low | Medium | High |
| |||
High | Pass to a contractor | Contingency with mitigating prior action | Avoid the risk or don't do the project |
Medium | No action | Pure contingency | Contingency with essential prior action |
Low | No action | No action | Insure the risk |
| |||
Controlling Risk
As the project progresses you need to monitor and control the risks. I suggest two documents:
Risk Item–Tracking Form. This is a document prepared for all the identified risks, the significant few and the insignificant many (but not the chaff eliminated after the brainstorming process). It identifies the risk, whether it is a business risk or insurable risk, its likelihood and consequence, and political impact, and the risk-reduction strategy. Table 10.7 is a risk item–tracking form for a risk in the CRMO Rationalization Project.
Risk Regsiter. This is a list of all the risks on the project, with their impact and risk-reduction strategy. They are sorted according to their priority so that the significant few are at the top, where they can be focused on, and the insignificant many are at the bottom, where they can be remembered but they do not occupy too much attention. Table 10.8 is a risk register for the CRMO Rationalization Project.
As the project progresses, you can then monitor the risks as they occur and take action as necessary to recover the plan.
TABLE 10.7 Risk Item–Tracking Form for the CRMO Rationalization Project
| |
TriMagi | |
| |
Risk item | Loss of team leader of MIS development team |
Owner | Rodney Turner |
Likelihood | Medium—known to be dissatisfied |
Consequence | High—significant delay to work |
Rating | 1—top risk |
Milestones affected | T5 |
Impact | Loss of expertise Delay in coding |
Mitigation strategy | Identify replacements Put them on standby |
Progress | Alternative team leader identified |
| |
TABLE 10.8 Risk Register for the CRMO Rationalization Project

1. There are six steps in risk management:
![]() Identify sources of risk
Identify sources of risk
![]() Asses impact of individual risks
Asses impact of individual risks
![]() Prioritize risks for further analysis
Prioritize risks for further analysis
![]() Assess overall impact of risks
Assess overall impact of risks
![]() Develop risk-reduction plans
Develop risk-reduction plans
![]() Control the identified risks
Control the identified risks
2. Techniques for identifying risk include
![]() Brainstorming
Brainstorming
![]() A mechanistic process based on plan decomposition and expert judgement
A mechanistic process based on plan decomposition and expert judgement
3. There are two types of risk:
![]() Business risk
Business risk
![]() Insurable risk
Insurable risk
4. There are five sources of risk
![]() External—unpredictable
External—unpredictable
![]() External—predictable
External—predictable
![]() Internal—nontechnical
Internal—nontechnical
![]() Legal
Legal
5. The impact of individual risks is a product of the likelihood they will occur, the consequence if they do occur, and the public perception of that consequence.
6. In assessing the combined effect of several risks, you can use
![]() A top-down approach, based on plan decomposition
A top-down approach, based on plan decomposition
![]() A bottom-up approach and Monte Carlo analysis
A bottom-up approach and Monte Carlo analysis
![]() Influence diagrams
Influence diagrams
7. There are three ways of reducing risk:
![]() Avoidance
Avoidance
![]() Deflection, either by insurance or through the contract
Deflection, either by insurance or through the contract
![]() Contingency
Contingency
8. Risks passed from client to contractor should be high likelihood, low consequence risks. An alliance should be formed to control coupled risks.
9. There are three types of contingency:
![]() Pure contingency
Pure contingency
![]() Contingency with essential prior action
Contingency with essential prior action
![]() Contingency with mitigating prior action
Contingency with mitigating prior action
10. The strategy adopted depends on the type of risk.
11. There are four steps in controlling risk:
![]() Draw up a risk management plan consisting of risk item–tracking forms.
Draw up a risk management plan consisting of risk item–tracking forms.
![]() Monitor progress of the significant few using the risk register.
Monitor progress of the significant few using the risk register.
![]() Reassess risks at regular intervals, and at key milestones or stage transition.
Reassess risks at regular intervals, and at key milestones or stage transition.
![]() Take action to overcome any divergence from plan.
Take action to overcome any divergence from plan.
1. Chapman, C.B. and Ward, S.C., Project Risk Management: Processes, Techniques and Insights, 2d ed., Chichester, U.K.: Wiley, 2003.
2. Chapman, C.B. and Ward, S.C., Managing Risk, in Turner, J.R. (ed.), The Gower Handbook of Project Management, 4th ed., Aldershot, U.K.: Gower, 2007.
3. Association for Project Management, Project Risk Analysis and Management Guide, 2d. ed., High Wycombe, UK: Association for Project Management, 2004.
4. Project Management Institute, A Guide to the Project Management Body of Knowledge, 3rd ed., Newtown Square, Pa.: PMI, 2004.
5. Office of Government Commerce, Managing Successful Projects with PRINCE2, 4th ed., London: The Stationery Office, 2005.
6. Saaty, T.L., The Fundamentals of Decision Making and Priority Theory with the Analytic Hierarchy Process, Pittsburgh, Pa.: RWS Publications, 1994.
7. Williams, T., Modelling Complex Projects., Chichester, U.K: Wiley, 2002.
8. Pym, D.V. and Wideman, R.M., "Risk management," in The Revised Project Management Body of Knowledge, Newtown Square, Pa.: Project Management Institute, 1987.
9. Turner, J.R., "Farsighted project contract management," in Turner, J.R. (ed.), Contracting for Project Management, Aldershot, U.K.: Gower, 2003.