
Business and Economics
Charts
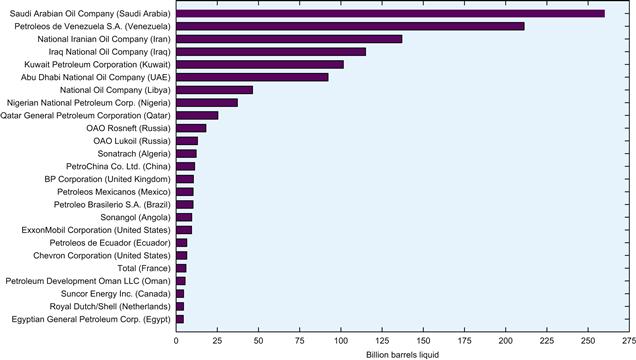
Chart 29.1 Companies holding the largest oil reserves, 2010. Source: Data from PetroStrategies, Inc., <http://www.petrostrategies.org>.
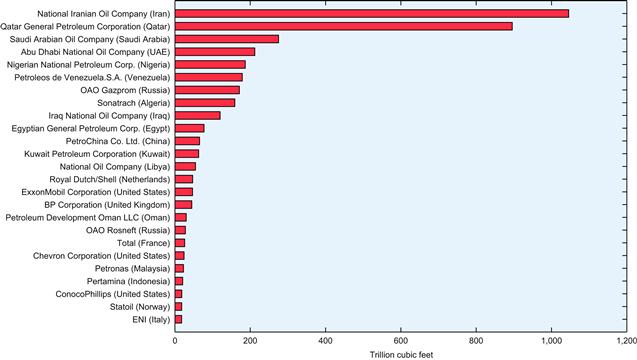
Chart 29.2 Companies holding the largest natural gas reserves, 2010. Source: Data from PetroStrategies, Inc., <http://www.petrostrategies.org>.
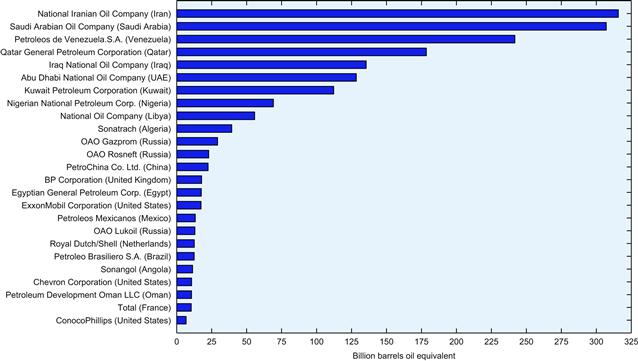
Chart 29.3 Companies holding the largest combined oil and natural gas reserves, measured in billion barrels oil equivalent, 2010. Source: Data from PetroStrategies, Inc., <http://www.petrostrategies.org>.
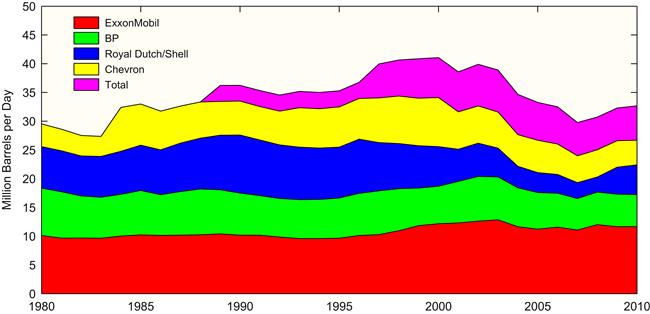
Chart 29.4 Oil reserves held by major oil companies, 1980–2010. Source: Data from Organization of Petroleum Exporting Countries, Statistical database, <http://www.opec.org/library/Annual%20Statistical%20Bulletin/interactive/current/FileZ/Main.htm>.
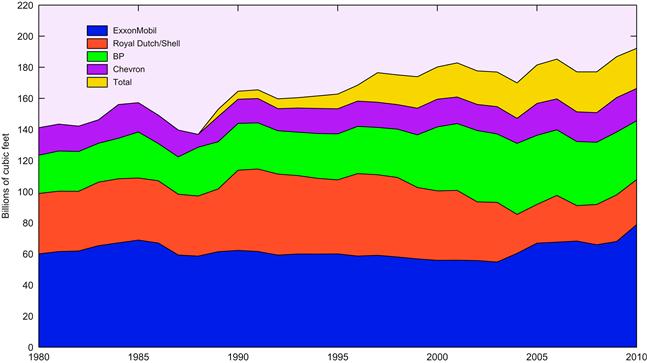
Chart 29.5 Natural gas reserves held by major oil and gas companies, 1980–2010. Source: Data from Organization of Petroleum Exporting Countries, Statistical database, <http://www.opec.org/library/Annual%20Statistical%20Bulletin/interactive/current/FileZ/Main.htm>.
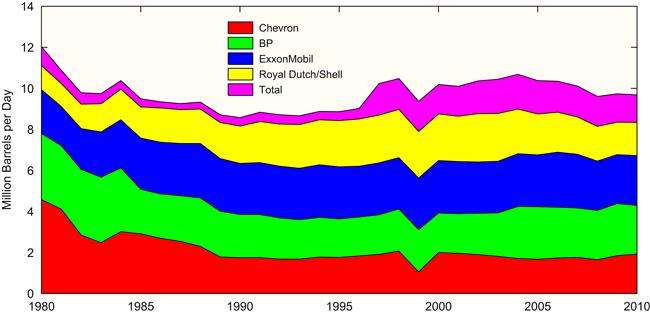
Chart 29.6 Crude oil produced by major oil companies, 1980–2010. Source: Organization of Petroleum Exporting Countries, Statistical database, <http://www.opec.org/library/Annual%20Statistical%20Bulletin/interactive/current/FileZ/Main.htm>.

Chart 29.7 Capital and exploratory expenditures of the major oil companies, 1980–2010. Source: Data from Organization of Petroleum Exporting Countries, Statistical database, <http://www.opec.org/library/Annual%20Statistical%20Bulletin/interactive/current/FileZ/Main.htm>.

Chart 29.8 Upstream and downstream expenditures of the major oil companies, 1980–2010 (constant 2005 US$). Source: Data from Organization of Petroleum Exporting Countries, Statistical database, <http://www.opec.org/library/Annual%20Statistical%20Bulletin/interactive/current/FileZ/Main.htm>.
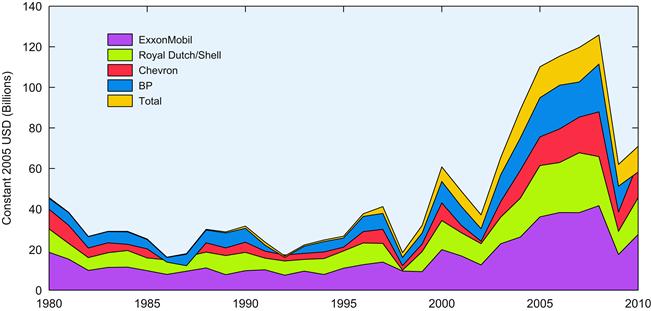
Chart 29.9 Net income of major oil companies, 1980–2010. Source: Data from Organization of Petroleum Exporting Countries, Statistical database, <http://www.opec.org/library/Annual%20Statistical%20Bulletin/interactive/current/FileZ/Main.htm>.
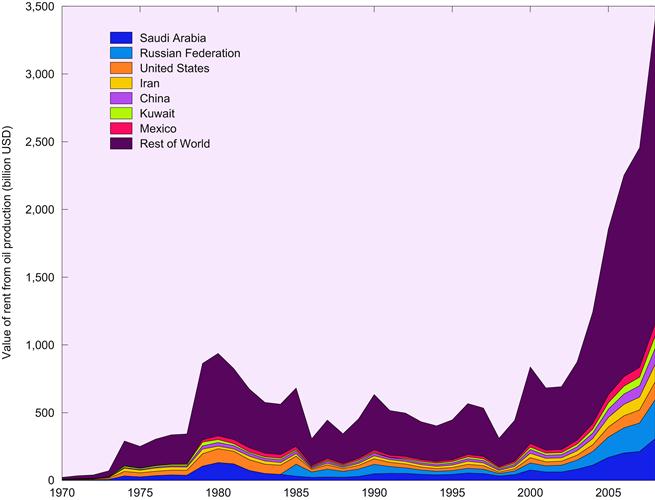
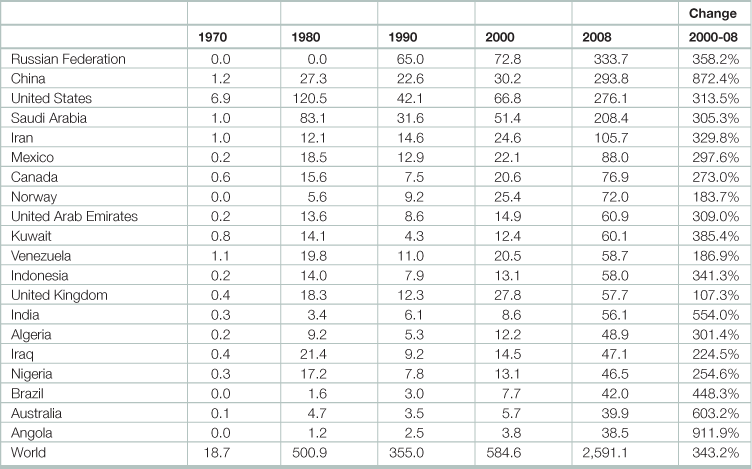
Chart 29.10 Rent earned from crude oil production, top nations, 1970–2008. Rents = Unit Rents ∗ Production. Unit Rents = Unit Price – Unit Cost. Source: Data from World Bank, Changing Wealth of Nations, 2010 update, <http://data.worldbank.org/data-catalog/wealth-of-nations>.
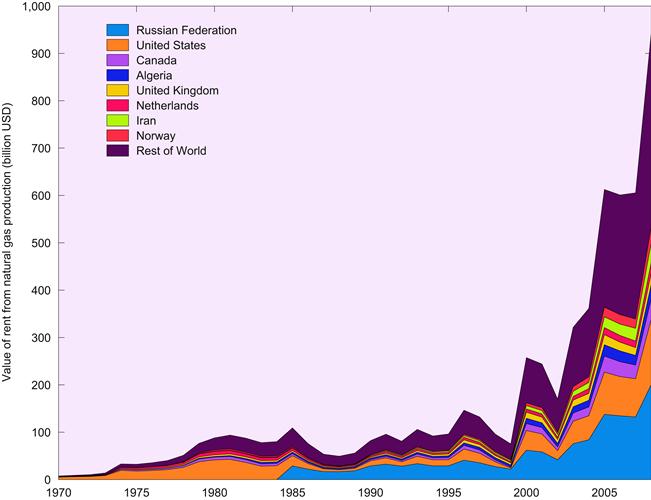
Chart 29.11 Rent earned from natural gas production, top nations, 1970–2008. Rents = Unit Rents ∗ Production. Unit Rents = Unit Price – Unit Cost. Source: Data from World Bank, Changing Wealth of Nations, 2010 update, <http://data.worldbank.org/data-catalog/wealth-of-nations>.
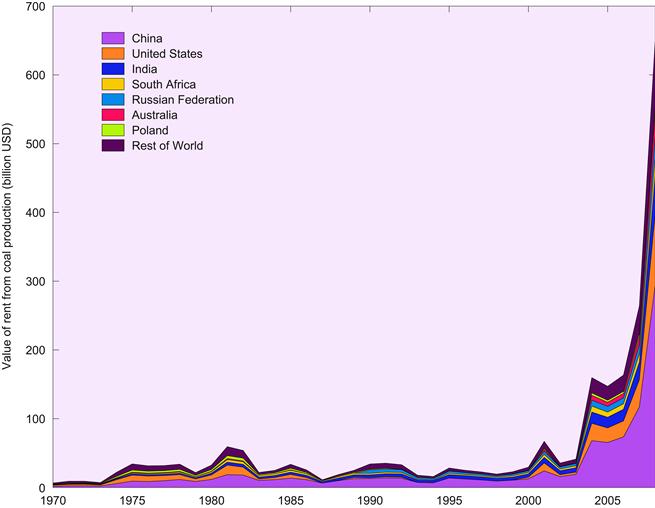
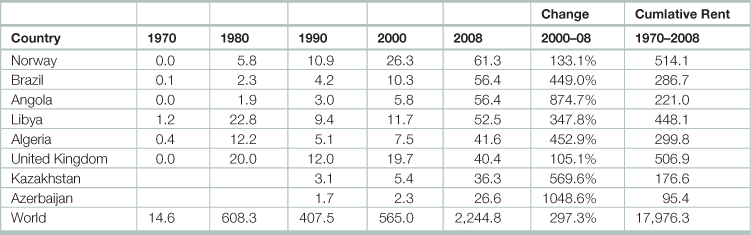
Chart 29.12 Rent earned from coal production, top nations, 1970–2008. Rents = Unit Rents ∗ Production. Unit Rents = Unit Price – Unit Cost. Source: Data from World Bank, Changing Wealth of Nations, 2010 update, <http://data.worldbank.org/data-catalog/wealth-of-nations>.
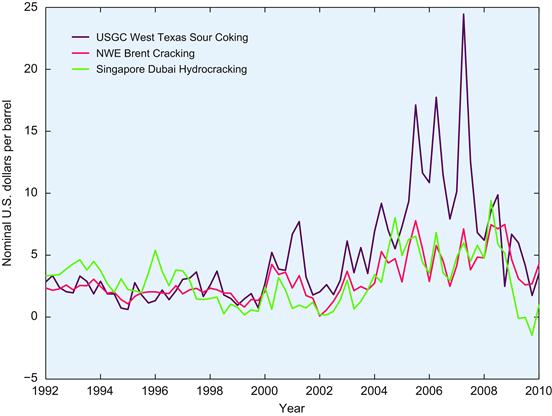
Chart 29.13 Oil refinery margins, 1992–2010. Refining margin is the difference in value between the products produced by a refinery and the value of the crude oil used to produce them. Source: Data from BP, Statistical Review of World Energy 2012, <http://www.bp.com/sectionbodycopy.do?categoryId=7500&contentId=7068481>.
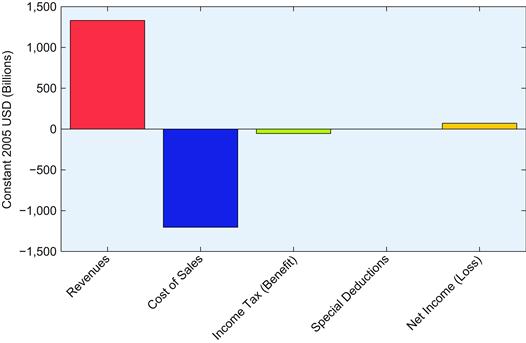
Chart 29.14 Revenue, operating costs, deductions, taxation and net income of the major oil companies, 2010. Source: Data from Organization of Petroleum Exporting Countries, Statistical database, <http://www.opec.org/library/Annual%20Statistical%20Bulletin/interactive/current/FileZ/Main.htm>.

Chart 29.15 Global energy subsides by fuel, 2007–2010. Source: International Energy Agency (IEA). 2011. IEA analysis of fossil-fuel subsidies, 4 October 2011 (Paris, IEA).
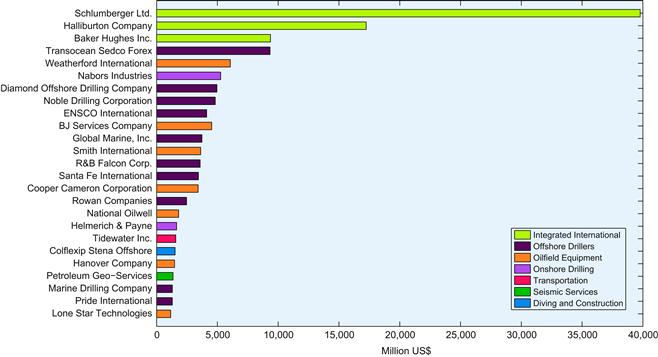
Chart 29.16 The world’s 25 largest oil and gas service companies based on market capitalization, 2011. Source: Data from PetroStrategies, Inc., <http://www.petrostrategies.org>.
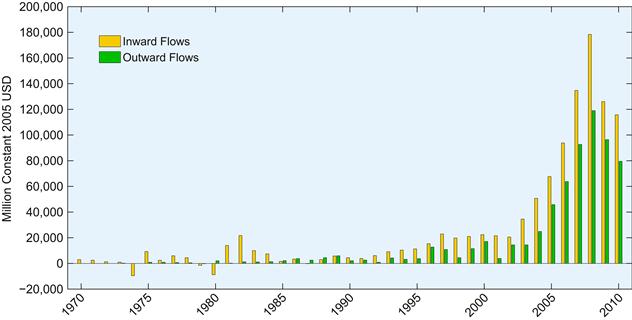
Chart 29.17 Foreign direct investment by the major petroleum exporting nations, 1970–2010. The group of major petroleum and gas exporters consists of countries whose share of petroleum and gas was not less than 50 per cent of their total exports, and whose exports of these products amounted to at least 1 per cent of petroleum and gas world share for the period 2004–2006. Source: Data from United Nations Conference on Trade and Development (UNCTAD), UNCTAD Statistics, <http://unctad.org/en/pages/Statistics.aspx>.

Chart 29.18 Energy research and development expenditures in IEA countries 1974–2010. Source: Data from International Energy Agency (IEA), Energy statistics database, <http://www.iea.org/stats/index.asp>.
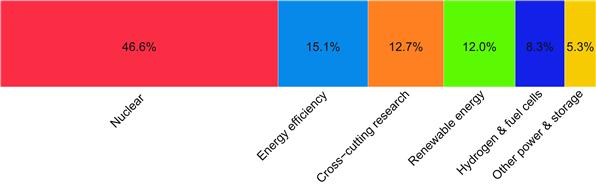
Chart 29.19 Energy research and development expenditures in IEA countries, 2006. Includes Australia, Austria, Belgium, Canada, Denmark, Finland, France, Germany, Greece, Hungary, Ireland, Italy, Japan, Korea, Luxembourg, the Netherlands, New Zealand, Norway, Portugal, Spain, Sweden, Switzerland, Turkey, the United Kingdom and the United States. Due to missing data, the Czech Republic, Poland and the Slovak Republic are not included. Source: Data from International Energy Agency (IEA), Energy statistics database, <http://www.iea.org/stats/index.asp>.
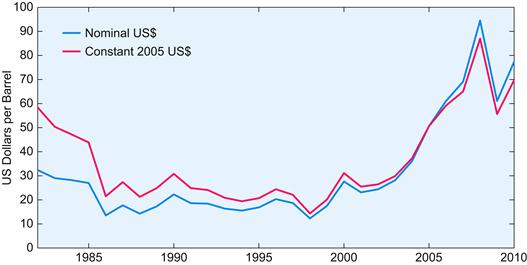
Chart 29.20 Spot OPEC reference basket prices, 1982–2010, a weighted average of prices for petroleum blends produced by the Organization of Petroleum Exporting Countries (OPEC) countries. It is used as an important benchmark for crude oil prices. As of June 2005, the basket is defined by: Saharan Blend (Algeria), Girassol (Angola), Oriente (Ecuador), Iran Heavy (Islamic Republic of Iran), Basra Light (Iraq), Kuwait Export (Kuwait), Es Sider (Libya), Bonny Light (Nigeria), Qatar Marine (Qatar), Arab Light (Saudi Arabia), Murban (UAE) and Merey (Venezuela). Source: Data from Organization of Petroleum Exporting Countries, Statistical database, <http://www.opec.org/library/Annual%20Statistical%20Bulletin/interactive/current/FileZ/Main.htm>.

Chart 29.21 Spot crude oil prices, for US WTI, UK Brent, Saudi Arabia Heavy, Indonesia Minas, and Venezuela TJL, 1982–2010. Source: Data from Organization of Petroleum Exporting Countries, Statistical database, <http://www.opec.org/library/Annual%20Statistical%20Bulletin/interactive/current/FileZ/Main.htm>.

Chart 29.22 Crude oil prices in the United States, 1859–2010. Source: Data from United States Department of Energy, Energy Information Administration.

Chart 29.23 Annual percent change in the real price of crude oil in the United States 1900–2010. Beginning in the 1930s, oil production was regulated by agencies in the major oil-producing states to dampen price fluctuations. By the 1970s, US production was declining and spare productive capacity was gone. Huge reserves among members of the Organization of Petroleum Exporting Countries (OPEC) gave OPEC more market control. One result was the return of more price volatility. Source: Data from United States Department of Energy, Energy Information Administration.
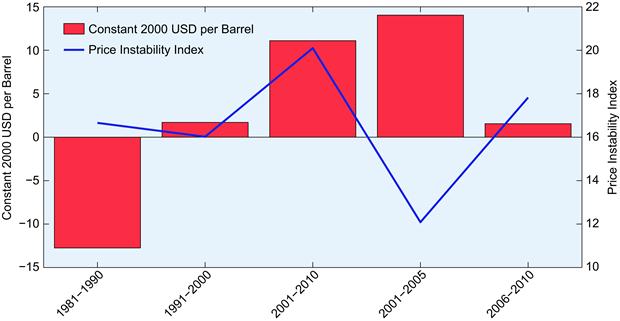
Chart 29.24 The price of crude oil and an index of oil price instability, 1981–2010. Instability is measured by the deviation of price from its long run trend. Source: Data from United Nations Conference on Trade and Development (UNCTAD), UNCTAD Statistics, <http://unctad.org/en/pages/Statistics.aspx>.
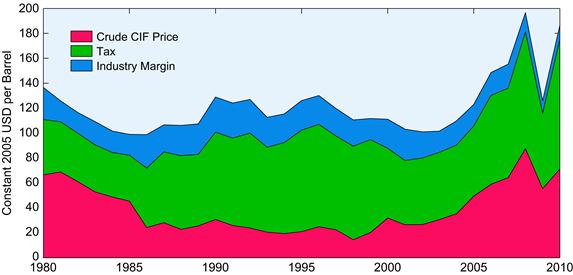
Chart 29.25 Composite barrel of oil and its components in G7 nations,1980–2010. The CIF price (i.e. cost, insurance and freight price) is the price of a barrel delivered at the frontier of the importing country, including any insurance and freight charges incurred to that point. Source: Data from Organization of Petroleum Exporting Countries, Statistical database, <http://www.opec.org/library/Annual%20Statistical%20Bulletin/interactive/current/FileZ/Main.htm>.
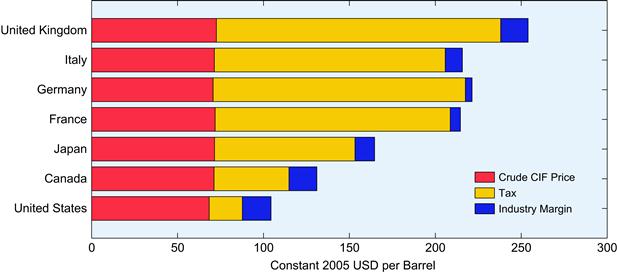
Chart 29.26 Composite barrel of oil and its components in major consuming nations, 2010. The CIF price (i.e. cost, insurance and freight price) is the price of a barrel delivered at the frontier of the importing country, including any insurance and freight charges incurred to that point. Source: Data from Organization of Petroleum Exporting Countries, Statistical database, <http://www.opec.org/library/Annual%20Statistical%20Bulletin/interactive/current/FileZ/Main.htm>.

Chart 29.27 Spot prices of premium gasoline in major markets, 1980–2010. Source: Data from Organization of Petroleum Exporting Countries, Statistical database, <http://www.opec.org/library/Annual%20Statistical%20Bulletin/interactive/current/FileZ/Main.htm>.
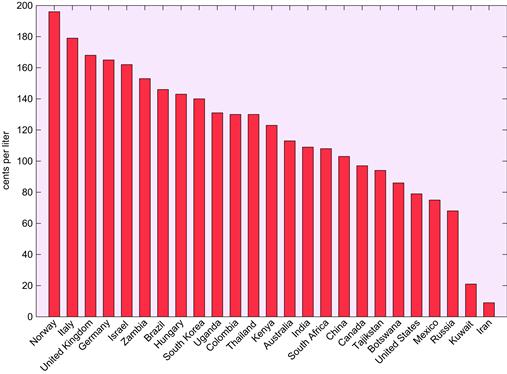
Chart 29.28 International gasoline prices, June 2012. Source: Data from http://www.mytravelcost.com/petrol-prices/.
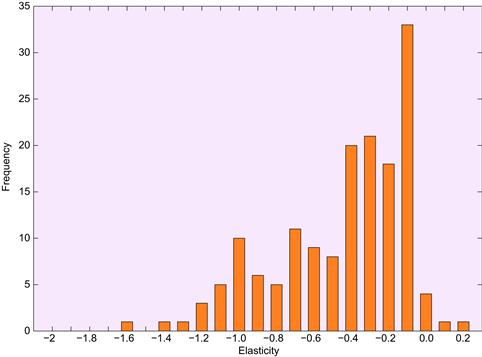
Chart 29.29 Price elasticity of demand for motor gasoline. The frequency distribution is generated from a meta-analysis of 312 elasticity observations from 43 primary studies. Source: Data from Brons, Martijn, Peter Nijkamp, Eric Pels, Piet Rietveld. 2008. A meta-analysis of the price elasticity of gasoline demand. A SUR approach, Energy Economics, Volume 30, Issue 5, Pages 2105-2122.
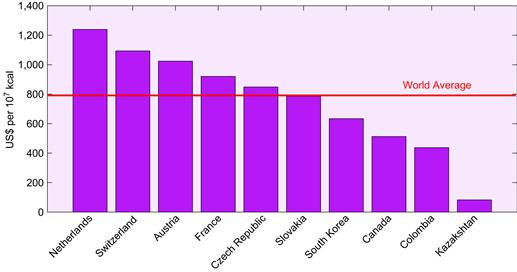
Chart 29.30 The price of natural gas to residential consumers in selected countries, 2009. Source: Data from United States Department of Energy, Energy Information Administration, International Energy Statistics, <http://www.eia.gov/countries/data.cfm>.
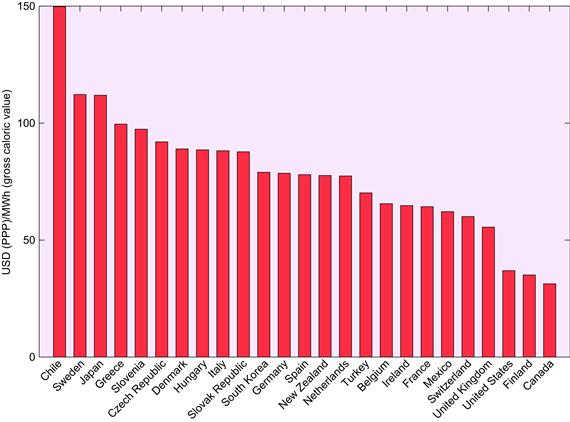
Chart 29.31 International prices paid by households for natural gas, 2010. Source: Data from United States Department of Energy, Energy Information Administration, International Energy Statistics, <http://www.eia.gov/coal/data.cfm#reserves>.
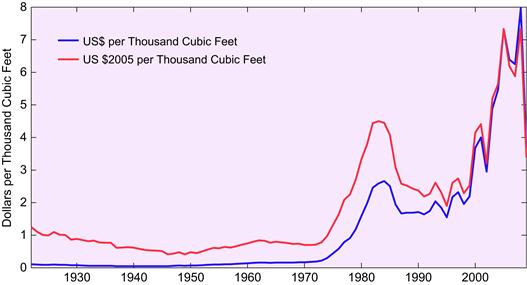
Chart 29.32 The wellhead price of natural gas in the United States, nominal and constant $2005 per thousand cubic feet. Source: Data from United States Department of Energy, Energy Information Administration, <http://www.eia.gov/naturalgas/>.

Chart 29.33 International prices for coal, 1987–2010. Coking coal is used in the smelting of iron ore; steam coal is that used by power plants and industrial steam boilers to produce electricity or process steam. Spot price is the price that is quoted for immediate (spot) settlement (payment and delivery). The CIF price (i.e. cost, insurance and freight price) is the price of a good delivered at the frontier of the importing country, including any insurance and freight charges incurred to that point. Source: Data from United States Department of Energy, Energy Information Administration, International Energy Statistics, <http://www.eia.gov/countries/data.cfm>.
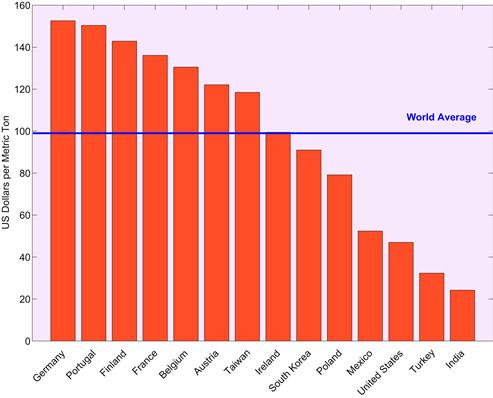
Chart 29.34 Coal prices in selected countries, 2010. Source: Data from United States Department of Energy, Energy Information Administration, International Energy Statistics, <http://www.eia.gov/countries/data.cfm>.
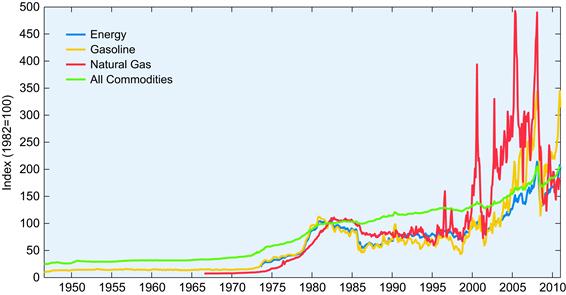
Chart 29.35 The Producer Price Index for natural gas, motor gasoline, all energy commodities, and all commodities in the United States, 1947–2011. Source: Data from United States Department of Labor Bureau of Labor Statistics, Producer Price Indexes, <http://www.bls.gov/ppi/>.
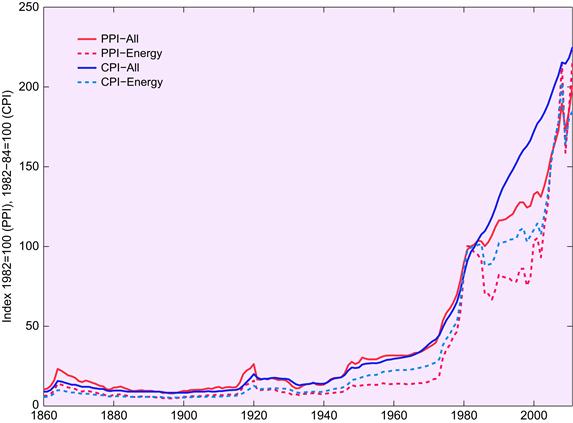
Chart 29.36 Consumer and Producer Indexes for energy and all commodities in the United States, 1860–2010. Source: Data from Carter, Susan B., Gartner, Scott Sigmund, Haines, Michael R., lmstead, Alan L., Sutch, Richard, Wright, Gavin. 2006. Historical Statistics of the United States: Millennial Edition, (New York, Cambridge University Press); United States Department of Labor Bureau of Labor Statistics, <http://www.bls.gov/ppi/>.
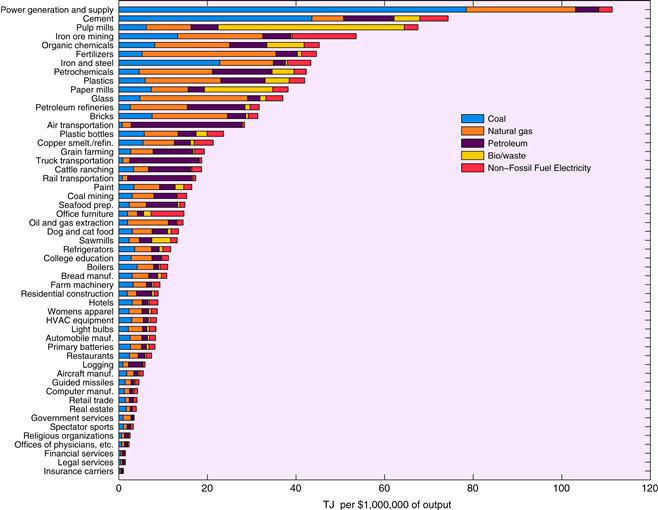
Chart 29.37 Energy cost of goods and services United States. Energy includes both direct and indirect energy use. Source: Data from Carnegie Mellon University Green Design Institute. 2012 Economic Input-Output Life Cycle Assessment (EIO-LCA) US 2002 (428) model [Internet], <http://www.eiolca.net/>.
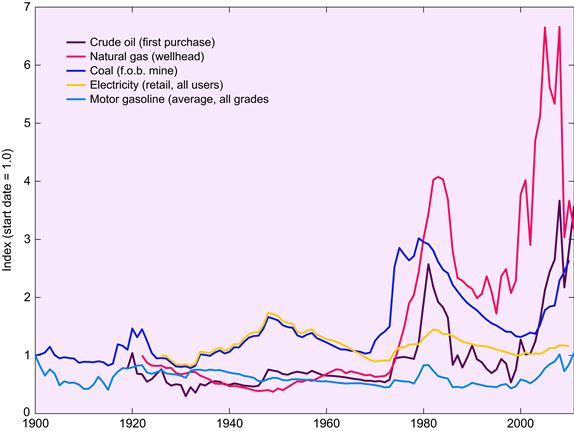
Chart 29.38 Index of real prices of energy in the United States, 1900–2011. Source: Data from Carter, Susan B., Gartner, Scott Sigmund, Haines, Michael R., lmstead, Alan L., Sutch, Richard, Wright, Gavin. 2006. Historical Statistics of the United States: Millennial Edition, (New York, Cambridge University Press); United States Department of Energy, Energy Information Admnistration.
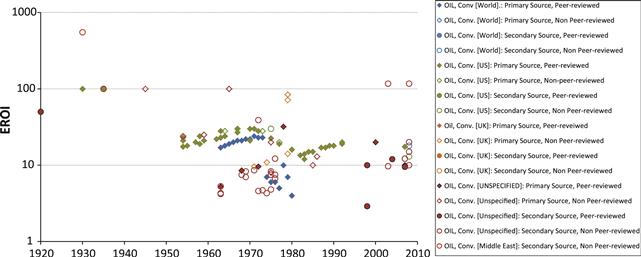
Chart 29.39 Estimates of the energy return on investment (EROI) for conventional oil production. EROI is the ratio of energy produced to the direct plus indirect energy used in the production process. Source: Data from Dale, M., S. Krumdieck, P. Bodger. 2012. Global energy modelling — A biophysical approach (GEMBA) Part 2: Methodology, Ecological Economics, Volume 73, Pages 158-167.
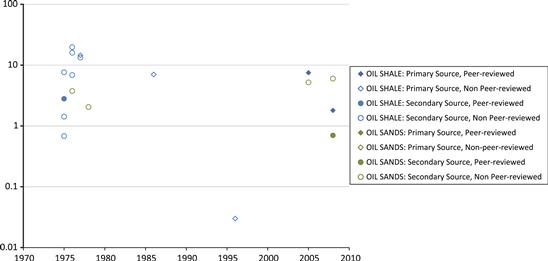
Chart 29.40 Estimates of the energy return on investment (EROI) for unconventional oil production. EROI is the ratio of energy produced to the direct plus indirect energy used in the production process. Source: Data from Dale, M., S. Krumdieck, P. Bodger. 2012. Global energy modelling — A biophysical approach (GEMBA) Part 2: Methodology, Ecological Economics, Volume 73, Pages 158-167.
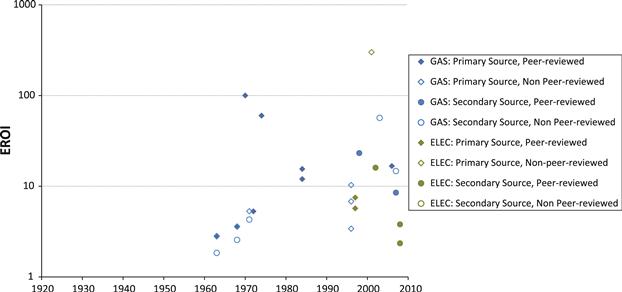
Chart 29.41 Estimates of the energy return on investment (EROI) for conventional natural gas production. EROI is the ratio of energy produced to the direct plus indirect energy used in the production process. CtX = clean coal technology. Source: Data from Dale, M., S. Krumdieck, P. Bodger. 2012. Global energy modelling — A biophysical approach (GEMBA) Part 2: Methodology, Ecological Economics, Volume 73, Pages 158-167.
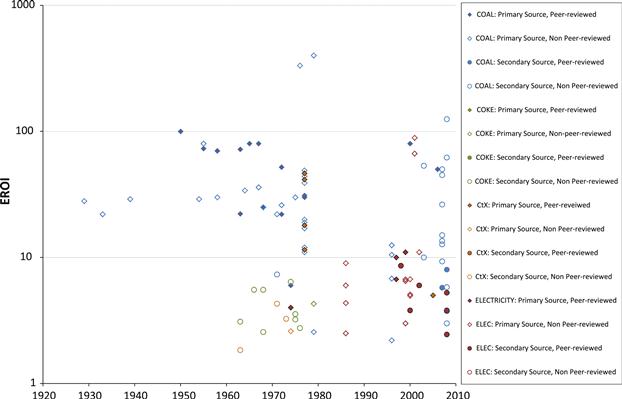
Chart 29.42 Estimates of the energy return on investment (EROI) for coal production. EROI is the ratio of energy produced to the direct plus indirect energy used in the production process. Source: Data from Dale, M., S. Krumdieck, P. Bodger. 2012. Global energy modelling — A biophysical approach (GEMBA) Part 2: Methodology, Ecological Economics, Volume 73, Pages 158-167.
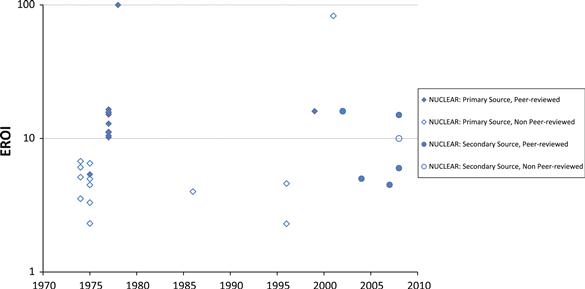
Chart 29.43 Estimates of the energy return on investment (EROI) for nuclear power. EROI is the ratio of energy produced to the direct plus indirect energy used in the production process. Source: Data from Dale, M., S. Krumdieck, P. Bodger. 2012. Global energy modelling — A biophysical approach (GEMBA) Part 2: Methodology, Ecological Economics, Volume 73, Pages 158-167.

Chart 29.44 Estimates of the energy return on investment (EROI) for hydropower. EROI is the ratio of energy produced to the direct plus indirect energy used in the production process. Source: Data from Dale, M., S. Krumdieck, P. Bodger. 2012. Global energy modelling — A biophysical approach (GEMBA) Part 2: Methodology, Ecological Economics, Volume 73, Pages 158-167.
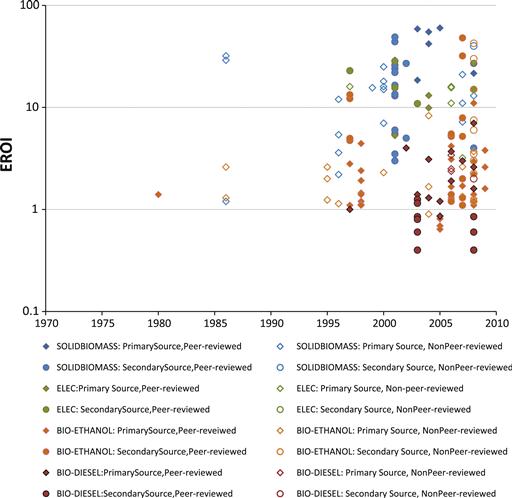
Chart 29.45 Estimates of the energy return on investment (EROI) for biomass. EROI is the ratio of energy produced to the direct plus indirect energy used in the production process. Source: Data from Dale, M., S. Krumdieck, P. Bodger. 2012. Global energy modelling — A biophysical approach (GEMBA) Part 2: Methodology, Ecological Economics, Volume 73, Pages 158-167.
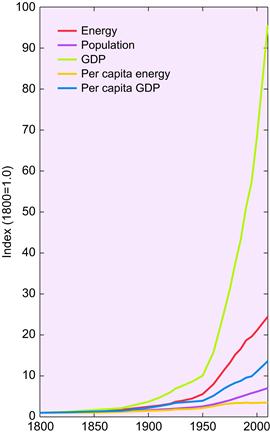
Chart 29.46 World energy use, population and GDP, 1800–2010. Source: Grubler, Arnulf, Energy transitions, Encyclopedia of Earth, <http://www.eoearth.org/article/Energy_transitions>, accessed 15 June 2012; World Bank, World Development Indicators and Global Development Finance, statistical database, <http://databank.worldbank.org/data/Home.aspx>, accessed 15 June 2012;BP, Statistical Review of World Energy 2012, <http://www.bp.com/sectionbodycopy.do?categoryId=7500&contentId=7068481>.
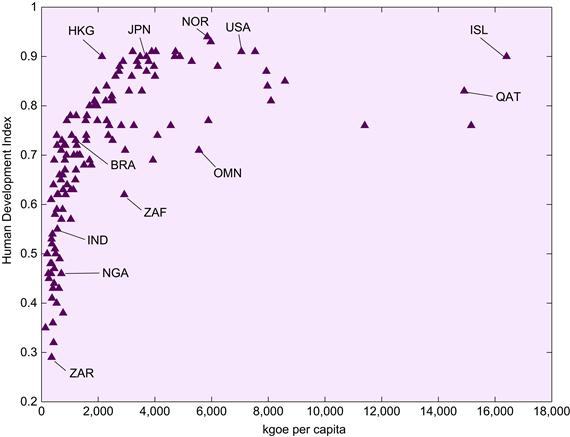
Chart 29.47 Energy use per capita and the Human Development Index, 2010. QAT=Qatar; CHN=China; IND=India; BRA=Brazil; ISL=Iceland; JPN=Japan; NGA=Nigeria; HKG=Hong Kong; OMN=Oman; ZAF=South Africa; ZAR=Congo, Dem. Rep. Source: Data from United Nations Development Programme, Human Development Report 2011, <http://hdr.undp.org/en/>; orld Bank, World Development Indicators and Global Development Finance, statistical database, <http://databank.worldbank.org/data/Home.aspx>.
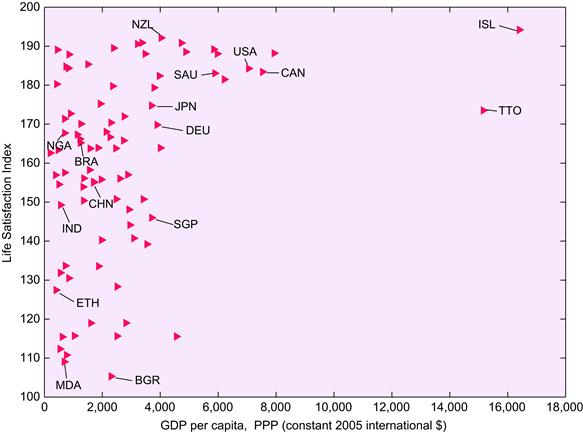
Chart 29.48 Energy use per capita and the Happy Index by nation. The Happy Index is dervied from the World Values Survey and the European Values Survey which asks individuals in various countries how happy they are. A higher value indicates a greater state of happiness. Source: Data from Helliwell, John, Richard Layard and Jeffrey Sachs, Editors. 2012. World Happiness Report, (New York, Earth Institute,Columbia University); World Bank, World Development Indicators and Global Development Finance, statistical database, <http://databank.worldbank.org/data/Home.aspx>.
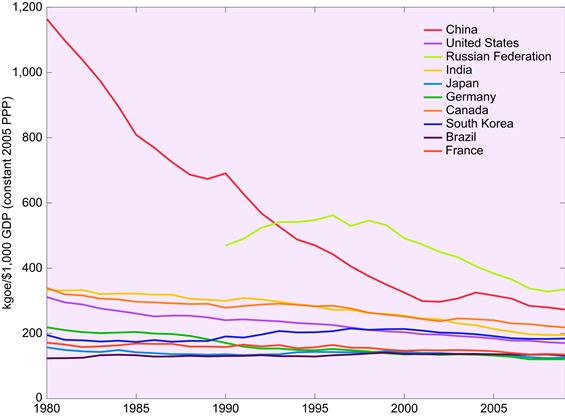
Chart 29.49 Energy/real GDP ratio for 10 largest energy using nations 1980–2009. Source: Data from World Bank, World Development Indicators and Global Development Finance, statistical database, <http://databank.worldbank.org/data/Home.aspx>.

Chart 29.50 Energy/real GDP ratio and energy use per capita for selected nations, 2009. ERI=Eritrea; BGD=Bangladesh; UZB=Uzbekistan; QAT=Qatar; DEU=Germany; CHN=China; IND=India; BRA=Brazil; ISL=Iceland; JPN=Japan; NOR=Norway; SAU=Saudi Arabia; NGA=Nigeria. Source: Data from World Bank, World Development Indicators and Global Development Finance, statistical database, <http://databank.worldbank.org/data/Home.aspx>.
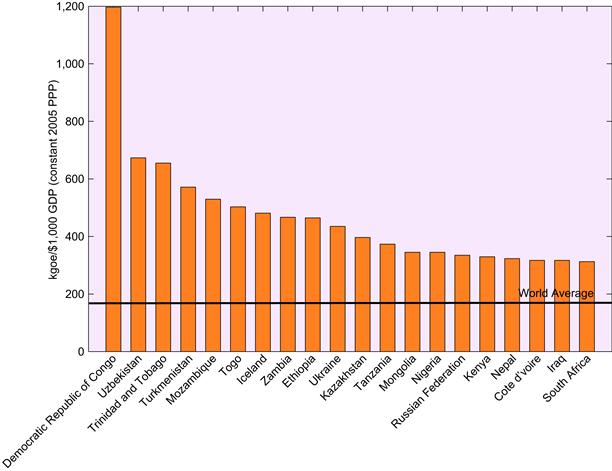
Chart 29.51 Energy/real GDP ratio for 20 most energy-intensive nations, 2009. Source: Data from World Bank, World Development Indicators and Global Development Finance, statistical database, <http://databank.worldbank.org/data/Home.aspx>.
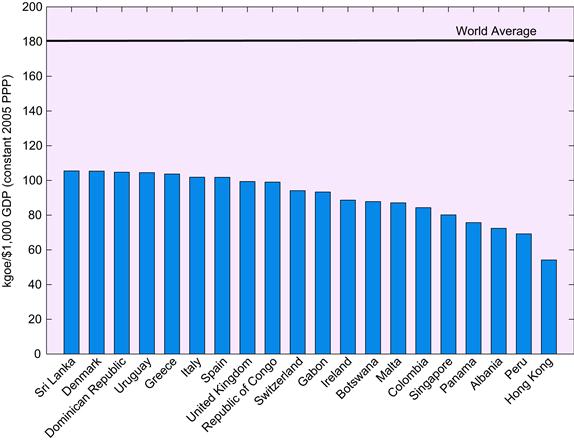
Chart 29.52 Energy/real GDP ratio for 20 least energy-intensive nations, 2009. Source: Data from World Bank, World Development Indicators and Global Development Finance, statistical database, <http://databank.worldbank.org/data/Home.aspx>.
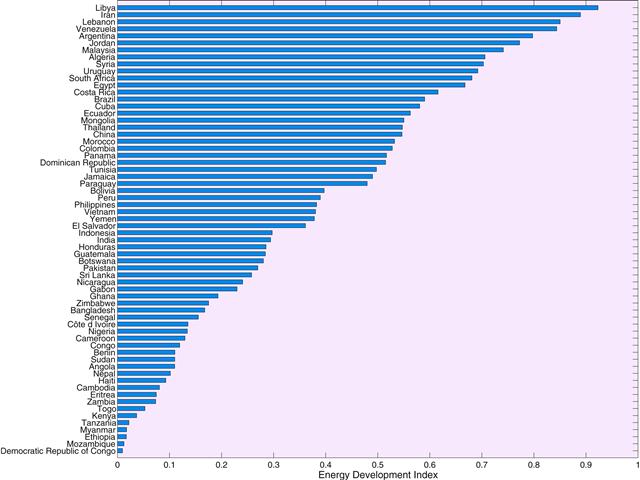
Chart 29.53 The Energy Development Index (EDI), 2011. The EDI is designed to track progress in a country’s or region’s transition to the use of modern fuels. The Index has four components: (1) per capita commercial energy consumption; (2) Per capita electricity consumption in the residential sector; (3) Share of modern fuels in total residential sector energy use, and (4) Share of population with access to electricity. A higher value indicates a greater degree of energy development. Source: Data from International Energy Agency (IEA). 2011. World Energy Outlook, (Paris, IEA).
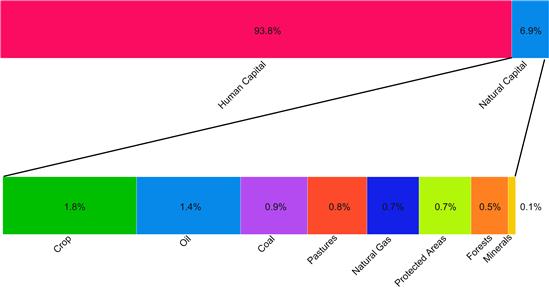
Chart 29.54 Value of human and natural capital for the world, 2005. Source: Data from World Bank, Changing Wealth of Nations, 2010 update, <http://data.worldbank.org/data-catalog/wealth-of-nations>.
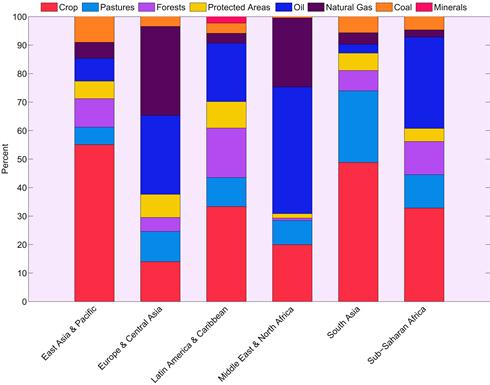
Chart 29.55 Value of the components of natural capital by region, 2005. Source: Data from World Bank, Changing Wealth of Nations, 2010 update, <http://data.worldbank.org/data-catalog/wealth-of-nations>.
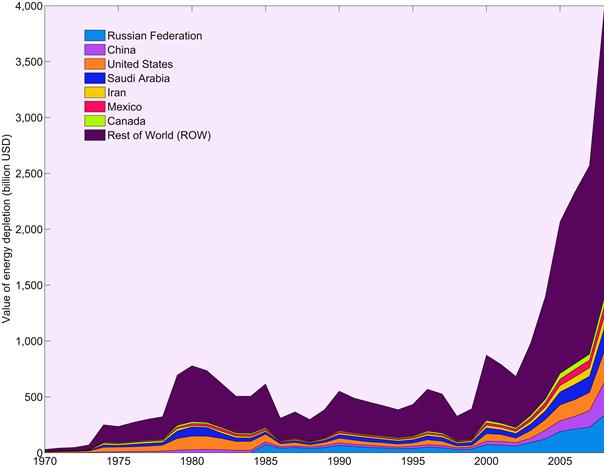
Chart 29.56 Value of energy depletion, top nations, 1970-2008. Energy depletion is equal to the ratio of present value of rents, discounted at 4%, to exhaustion time of the resource. It covers crude oil, natural gas, and coal. Exhaustion time = Min (25 years, Reserves/Production). Rents = Unit Rents ∗ Production. Unit Rents = Unit Price – Unit Cost. Source: Data from World Bank, Changing Wealth of Nations, 2010 update, <http://data.worldbank.org/data-catalog/wealth-of-nations>.

Chart 29.57 Value of the depletion of nonrenewable energy resources, top 20 nations, 2008. Energy depletion is equal to the ratio of present value of rents, discounted at 4%, to exhaustion time of the resource. It covers crude oil, natural gas, and coal. Exhaustion time = Min (25 years, Reserves/Production). Rents = Unit Rents ∗ Production. Unit Rents = Unit Price – Unit Cost. Source: Data from World Bank, Changing Wealth of Nations, 2010 update, <http://data.worldbank.org/data-catalog/wealth-of-nations>.
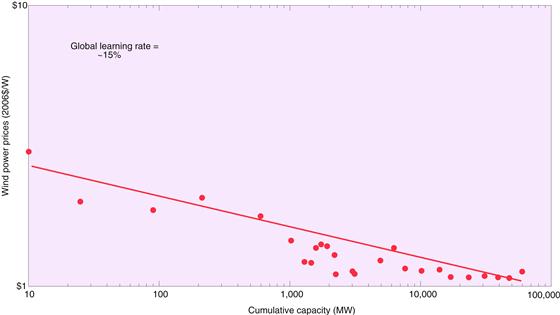
Chart 29.58 Learning curve for wind energy. The learning rate describes the cost reduction for every doubling of output. Source: Data from Nemet, Gregory F. 2009. Interim monitoring of cost dynamics for publicly supported energy technologies, Energy Policy, Volume 37, Issue 3, Pages 825-835.
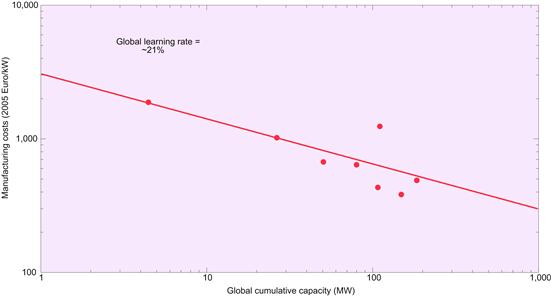
Chart 29.59 Learning curve for proton exchange membrane fuel cell (PEMFC) technology. The learning rate describes the cost reduction for every doubling of output. Source: Data from Schoots, K., Kramer, G.J., and van der Zwaan, B.C.C., 2010. Technology learning for fuel cells: An assessment of past and potential cost reductions, Energy Policy, vol. 38(6), pages 2887-2897.
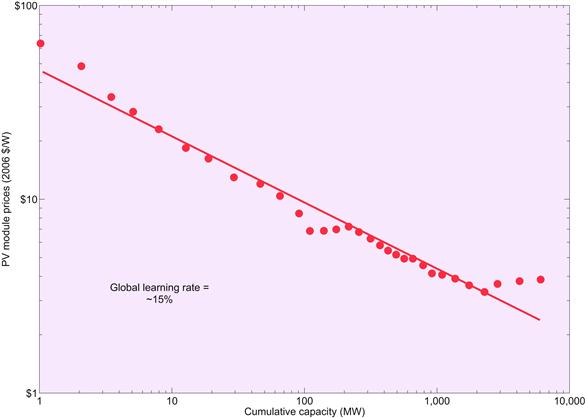
Chart 29.60 Learning curve for photovoltaic (PV) energy. The learning rate describes the cost reduction for every doubling of output. Source: Data from Nemet, Gregory F. 2009. Interim monitoring of cost dynamics for publicly supported energy technologies, Energy Policy, Volume 37, Issue 3, Pages 825-835.
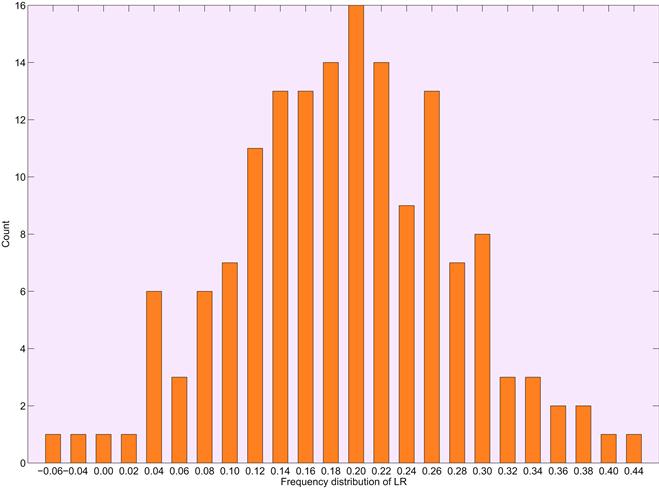
Chart 29.61 Frequency distribution of learning rates calculated in 156 learning curve studies for photovoltaics. The learning rate describes the cost reduction for every doubling of output. Source: Data from Nemet, G.F., D. Husmann. 2012. Historical and Future Cost Dynamics of Photovoltaic Technology, In: Ali Sayigh, Editor-in-Chief, Comprehensive Renewable Energy, (Oxford, Elsevier) Pages 47-72.

Chart 29.62 Learning curve for hydrated ethanol in Brazil, 1975-2004. The learning rate describes the cost reduction for every doubling of output. Source: Data from van den Wall Bake, J.D., M. Junginger, A. Faaij, T. Poot, A. Walter. 2009. Explaining the experience curve: Cost reductions of Brazilian ethanol from sugarcane, Biomass and Bioenergy, Volume 33, Issue 4, Pages 644-658.
Tables
Table 29.1
Fifty largest energy corporations in the world, 2011
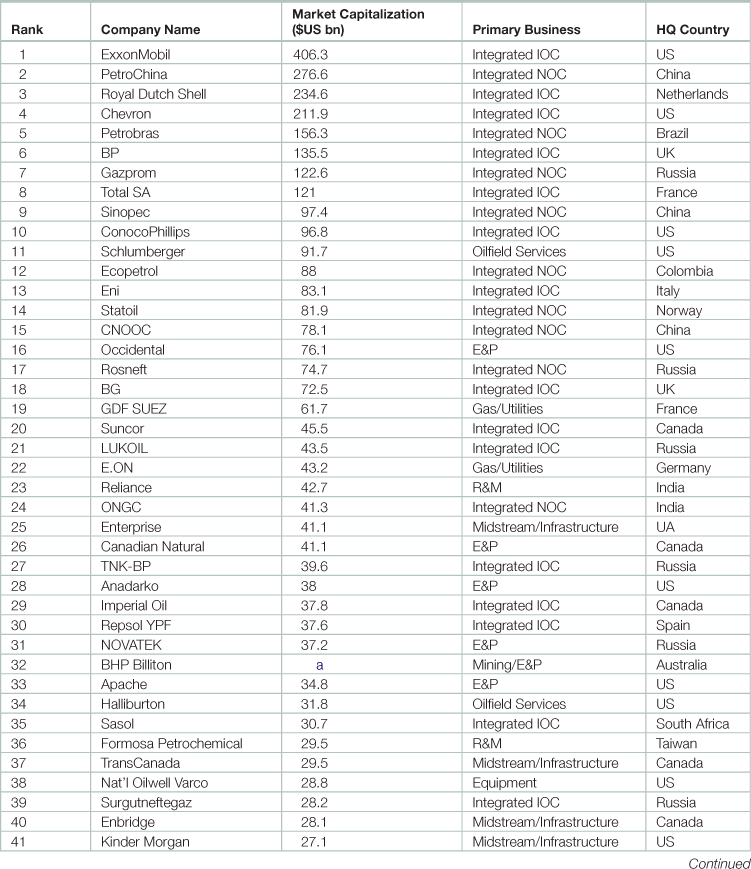
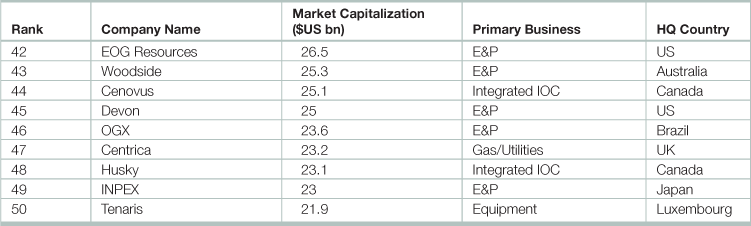
IOC = Integrated Oil Company NOC = National Oil Company; E&P = Exploration and Production: R&M = Refining and Marketing
aBHP Billiton is ranked using an estimated value for its E&P business based on reserves and production (#24). Prior listings ranked the company based on its total market capitalization.
Table 29.2
Principal operations of the major oil companies, 1980–2010 (Thousand barrels/day)
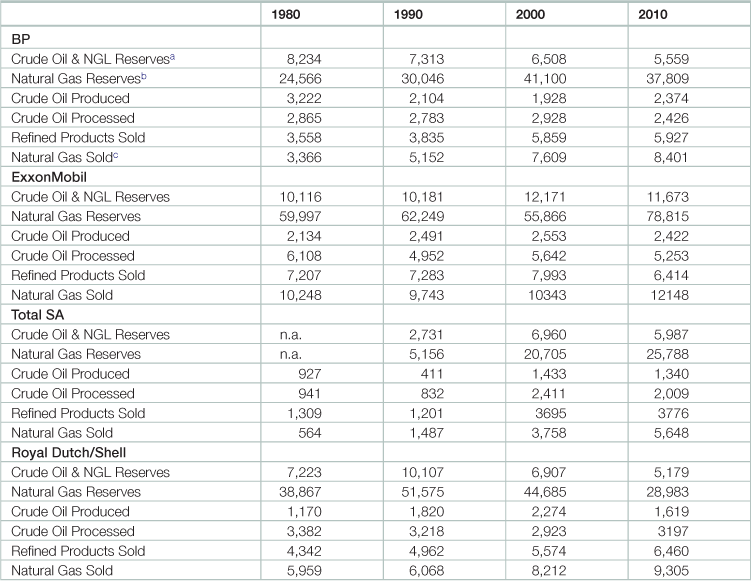
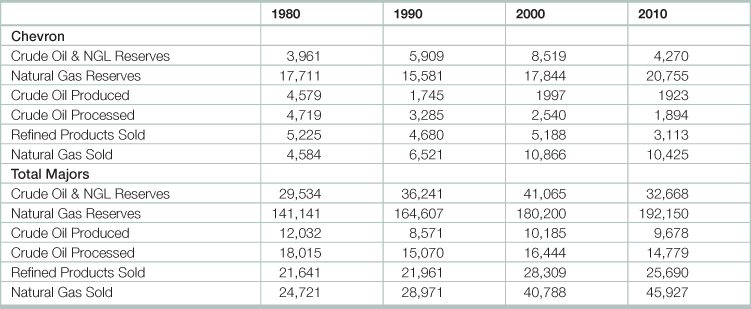
aMillion barrels, as at year end.
bBillions of cubic feet, as at year end.
Source: Organization of Petroleum Exporting Countries
Table 29.3
Gasoline pricesa in selected countries, 1990–2010
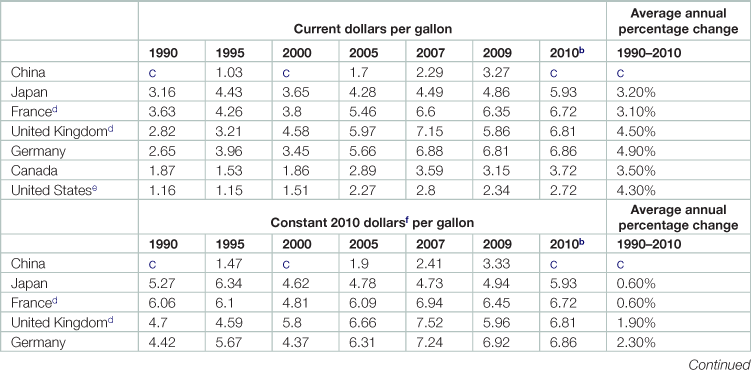

Comparisons between prices and price trends in different countries require care. They are of limited validity because of fluctuations in exchange rates; differences in product quality, marketing practices, and market structures; and the extent to which the standard categories of sales are representative of total national sales for a given period.
aPrices represent the retail prices (including taxes) for regular unleaded gasoline, except for France and the United Kingdom which are premium unleaded gasoline.
Table 29.4
Diesel fuel pricesa for selected countries, 1998–2010

Comparisons between prices and price trends in different countries require care. They are of limited validity because of fluctuations in exchange rates; differences in product quality, marketing practices, and market structures; and the extent to which the standard categories of sales are representative of total national sales for a given period.
aPrices represent the retail prices (including taxes) for automotive diesel fuel for non-commercial (household) use.
dThese estimates are for international comparisons only and do not necessarily correspond to gasoline price estimates in other sections of the book.
eAdjusted by the U.S. Consumer Price Inflation Index. Source: Oak Ridge National Laboratory, Transportation Energy Data Book: Edition 30, <http://cta.ornl.gov/data/index.shtml>.
Table 29.5
The price of compressed natural gas (CNG) compared to other fuels in selected nations
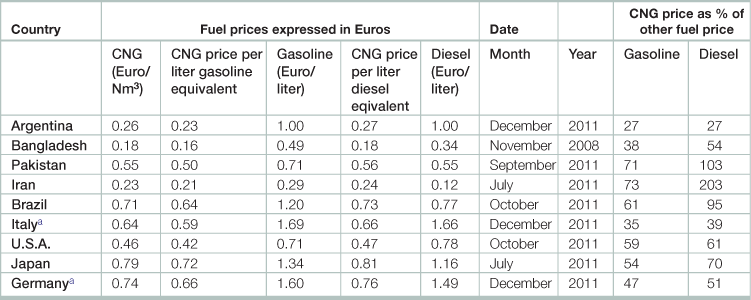
Default values used: CH4 content in natural gas is 97%. CNG energy content is 9.6 kWh/Nm3. Gasoline energy content is 8.8 kWh/litre. Diesel energy content is 9.85 kWh/litre. LPG energy content is 6.46 kWh/litre
aIn these countries sales are measured in kg. The conversion factor depends on the normal density of gaseous natural gas in each country. The default value used is 0.73 kg/Nm3.
Source: NGVA Europe, Worldwide NGV Statistics, <http://www.ngvaeurope.eu/worldwide-ngv-statistics>.
Table 29.6
Energy costs of selected goods and services in the United States per $1,000,000 of outputa
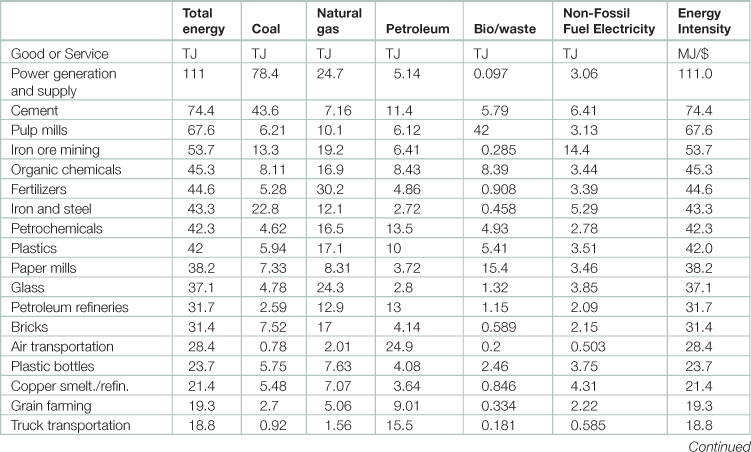
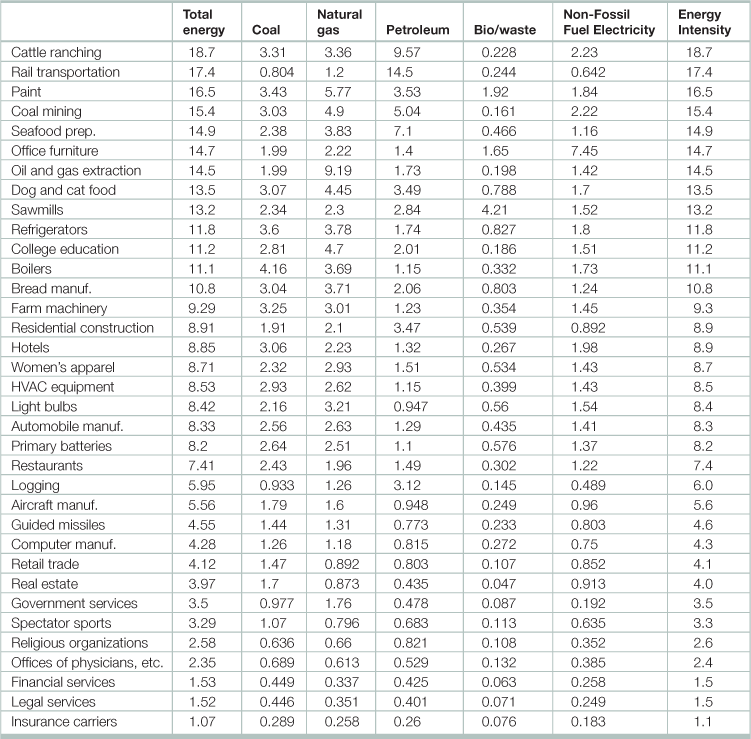
aThe direct plus indirect energy required to produce a good or service in 2002.
Source: Carnegie Mellon University Green Design Institute. 2012 Economic Input-Output Life Cycle Assessment (EIO-LCA) US 2002 (428) model [Internet], <http://www.eiolca.net/>.
Table 29.7
Estimates of the long-run direct rebound effecta for household energy services in the OECDb
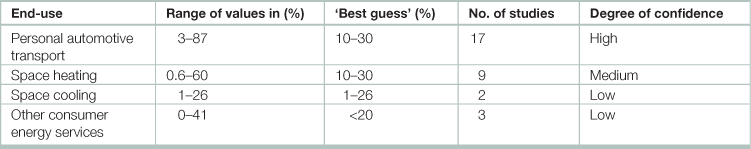
aAn increase in energy use caused directly or indirectly by improved energy efficiency.
bOrganisation for Economic Co-operation and Development
Source: Adapted from Sorrell, Steve, John Dimitropoulos, Matt Sommerville. 2009. Empirical estimates of the direct rebound effect: A review, Energy Policy, Volume 37, Issue 4, Pages 1356-1371.
Table 29.8
Estimates of the per unit external costs of energy activity in the U.Sa
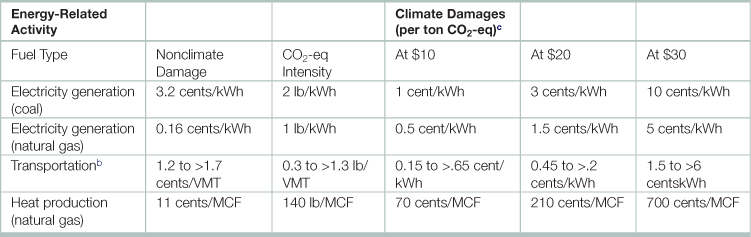
CO2-eq, carbon dioxide equivalent; VMT, vehicle miles traveled; MCF, thousand cubic feet; E85, ethanol 85% blend; HEV,
hybrid electric vehicle; CNG, compressed natural gas; RFG, reformulated gasoline.
Committee on Health, Environmental, and Other External Costs and Benefits of Energy Production and Consumption; National Research Council, Hidden Costs of Energy: Unpriced Consequences of Energy Production and Use, (Washington, National Academy Press).
aBased on emission estimates for 2005. Damages are expressed in 2007 U.S. dollars. Damages that have not been quantified and monetized are not included.
bTransportation fuels include E85 herbaceous, E85 corn stover, hydrogen gaseous, E85 corn, diesel with biodiesel, grid-independent HEV, griddependent HEV, electric vehicle, CNG, conventional gasoline and RFG, E10, low-sulfur diesel, tar sands.
cOften called the “social cost of carbon.”
Source: Adapted from Committee on Health, Environmental, and Other External Costs and Benefits of Energy Production and Consumption; National Research Council, Hidden Costs of Energy: Unpriced Consequences of Energy Production and Use, (Washington, National Academy Press).
Table 29.9
Value of rent earned from coal production top 20 nations, 1970–2008

Source: World Bank, Changing Wealth of Nations, 2010 update, <http://data.worldbank.org/data-catalog/wealth-of-nations>.
Table 29.10
Value of rent eaned from crude oil production top 20 nations, 1970–2008
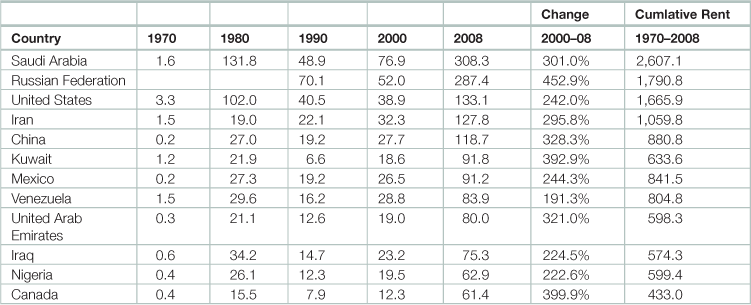
Source: World Bank, Changing Wealth of Nations, 2010 update, <http://data.worldbank.org/data-catalog/wealth-of-nations>.
Table 29.11
Value of rent eaned from natural gas production top 20 nations, 1970–2008.

Source: World Bank, Changing Wealth of Nations, 2010 update, <http://data.worldbank.org/data-catalog/wealth-of-nations>.
Table 29.12
Estimates of the external costs of electricity generated from fossil fuels
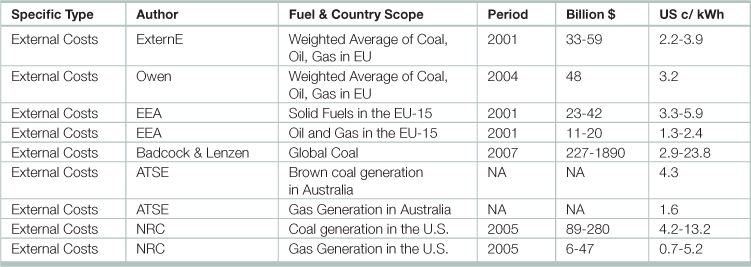
ATSE. (2009). The Hidden Costs of Electricity: Externalities of power generation in Australia. Parkville: Australian Academy
of Technological Sciences and Engineering; EEA: European Environment Agency; ; externE Project. 2003. External Costs: Research results on socio-environmental damages due to electricity and transport (Luxembourg, Office for Official Publications of the European Communities). ; Badcock, J., & Lenzen, M. (2010, September). Subsidies for Electricity-generating Technologies: A review. Energy Policy 38(9), 5038-5047; Owen, A. D. (2006). Renewable energy: Externality costs as market barriers. Energy Policy 34 (2006) 632-642; NRC: National Research Council. (2009). Hidden Costs of Energy: Unpriced consequences of energy production and use.
Washington: The National Academies Press.
Source: Adapted from Global Subsidies Initiative. 2011. Subsidies and External Costs in Electric Power Generation: A comparative review of estimates, <http://www.iisd.org/gsi/sites/default/files/power_gen_subsidies.pdf>.
Table 29.13
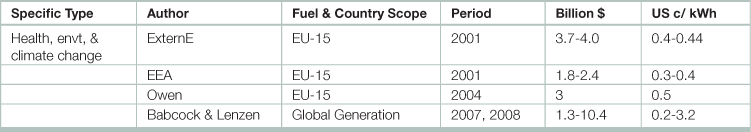
Estimates of the external cost of electricity generated from nuclear energy
EEA: European Environment Agency; ; externE Project. 2003. External Costs: Research results on socio-environmental damages due to electricity and transport (Luxembourg, Office for Official Publications of the European Communities). ; Badcock, J., & Lenzen, M. (2010, September). Subsidies for Electricity-generating Technologies: A review. Energy Policy 38(9), 5038-5047; Owen, A. D. (2006). Renewable energy: Externality costs as market barriers. Energy Policy 34 (2006) 632-642.
Source: Adapted from Global Subsidies Initiative. 2011. Subsidies and External Costs in Electric Power Generation: A comparative review of estimates, <http://www.iisd.org/gsi/sites/default/files/power_gen_subsidies.pdf>.
Table 29.14
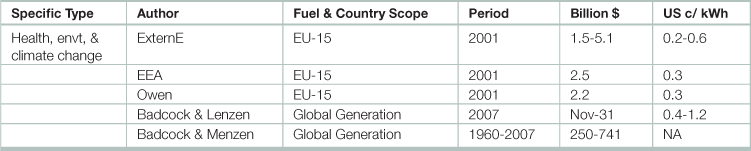
Estimates of the external costs of electricity generated from renewable energy.
EEA: European Environment Agency; ; externE Project. 2003. External Costs: Research results on socio-environmental damages due to electricity and transport (Luxembourg, Office for Official Publications of the European Communities). ; Badcock, J., & Lenzen, M. (2010, September). Subsidies for Electricity-generating Technologies: A review. Energy Policy 38(9), 5038-5047; Owen, A. D. (2006). Renewable energy: Externality costs as market barriers. Energy Policy 34 (2006) 632-642.
Source: Adapted from Global Subsidies Initiative. 2011. Subsidies and External Costs in Electric Power Generation: A comparative review of estimates, <http://www.iisd.org/gsi/sites/default/files/power_gen_subsidies.pdf>.
Table 29.15
Estimates of the external cost of electricity generation in European Union countries (€ cent per kWh)
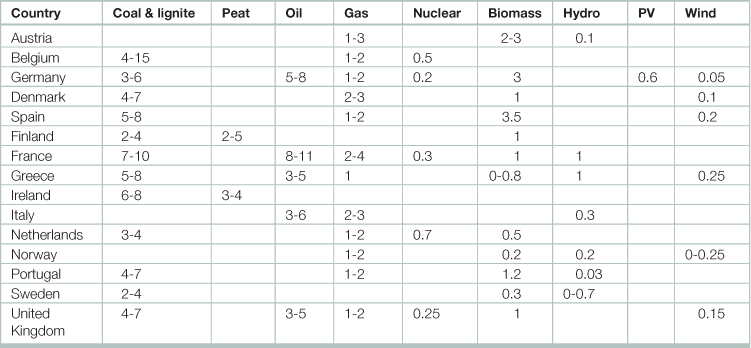
Source: Adapted from externE Project. 2003. External Costs: Research results on socio-environmental damages due to electricity and transport (Luxembourg, Office for Official Publications of the European Communities).
Table 29.16
Global levelized costs of electricity ($ MWh−1) by generating type
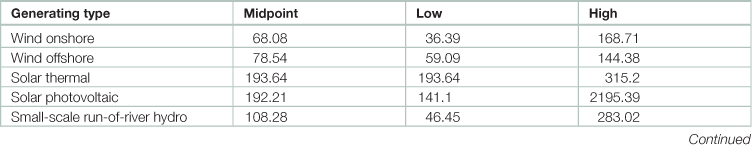
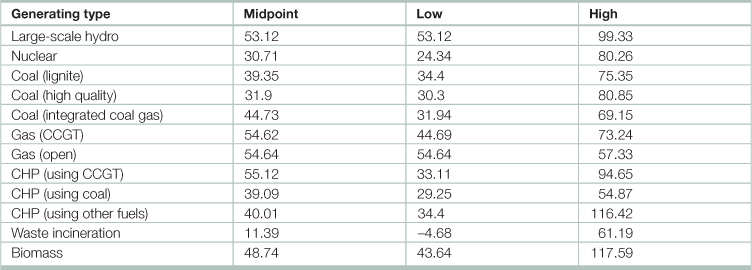
CCGT = combined cycle gas turbine; CHP = combined heat and power. The costs include capital, operation and maintenance, and fuel costs over the lifetime of a power plant, discounted to the present and ‘levelized’ over the expected output of the generating source over its lifetime. Values are in 2008 US dollars. The midpoint value is based on a 5% discount rate, as is the low value (except in the case of high-quality coal); the high value is derived using a 10% discount rate.
Source: Adapted from van Kooten GC and Timilsina GR. (2009. Wind Power Development: Economics and Policies, 32pp. Policy Research Working Paper 4868. Washington, DC: The World Bank, Development Research Group, Environment and Energy Team.
Table 29.17
Estimated Levelized Costa of new electricity generation in 2016
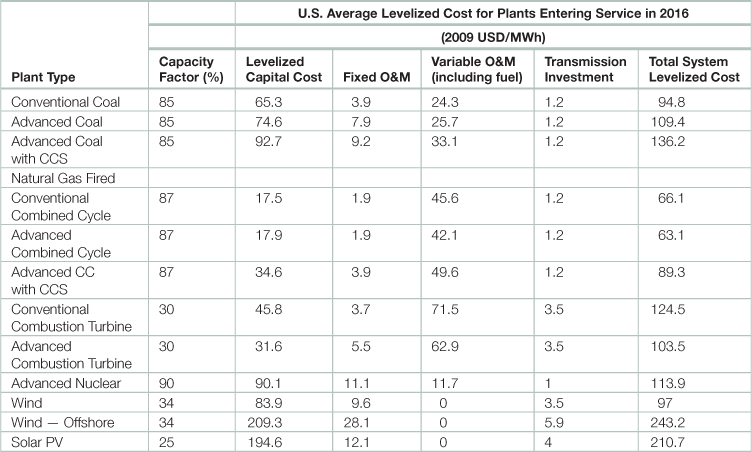
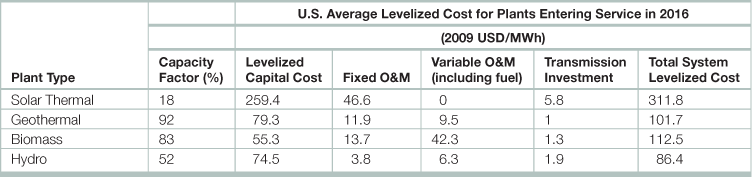
aLevelized cost represents the present value of the total cost of building and operating a generating plant over an assumed financial life and duty cycle, converted to equal annual payments and expressed in terms of real dollars to remove the impact of inflation. CC = combined cycle; CCS = carbon capture and storage; M&O = maintenance and operation.
Source: U.S. Energy Information Administration, Levelized Cost of New Generation Resources in the Annual Energy Outlook 2011, <http://205.254.135.7/oiaf/aeo/electricity_generation.html>.
Table 29.18
General objectives of subsidies to electricity generation and use
| Generation type | Objective of subsidies |
| Renewable | • Environmental improvement (reductions in CO2 and local pollution) |
| • Boost the national economy and create jobs in high technology and growth industries | |
| • Improve energy security through diversification and reduced dependence on imports | |
| • Widen access to energy and realize related social benefits, particularly in rural areas | |
| • Stimulate cost reductions in renewable energy technologies | |
| Fossil Fuel | • Welfare improvements through lower costs to consumers |
| • Widen access to energy and realize related social benefits, particularly in rural areas | |
| • Subsidies for switching across fossil fuels (e.g. from coal to gas) | |
| • Development of local fossil-fuel sources (particularly otherwise stranded assets) | |
| • Stimulate national economy (or segments thereof) through lower costs to business | |
| Nuclear Energy | • Reduce CO2 emissions from combustion of fossil-fuel emissions |
| • Support the creation of a strong nuclear industry and viable nuclear fuel cycle | |
| • Improve energy security through diversification and reduced dependence on imports | |
| Any or All Types | • Stimulate and support economic growth |
| • Meet growing consumer and industry demand | |
| • Generate employment and social benefits |
Source: Global Subsidies Initiative. 2011. Subsidies and External Costs in Electric Power Generation: A comparative review of estimates, <http://www.iisd.org/gsi/sites/default/files/power_gen_subsidies.pdf>.
Table 29.19
Examples of subsidies to electricity generation

Source: Global Subsidies Initiative. 2011. Subsidies and External Costs in Electric Power Generation: A comparative review of estimates, <http://www.iisd.org/gsi/sites/default/files/power_gen_subsidies.pdf>.
Table 29.20
Estimates of subsidies to electricity generated from fossil fuels

IEA: International Energy Agency; Badcock, J., & Lenzen, M. (2010, September). Subsidies for Electricity-generating Technologies: A review. Energy Policy 38(9), 5038-5047; Reidy, C. (2007). Energy and transport subsidies in Australia: 2007 update. Sydney: Institute for Sustainable Futures.
Source: Adapted from Global Subsidies Initiative. 2011. Subsidies and External Costs in Electric Power Generation: A comparative review of estimates, <http://www.iisd.org/gsi/sites/default/files/power_gen_subsidies.pdf>.
Table 29.21
Estimates of subsidies to electricity generated from nuclear energy
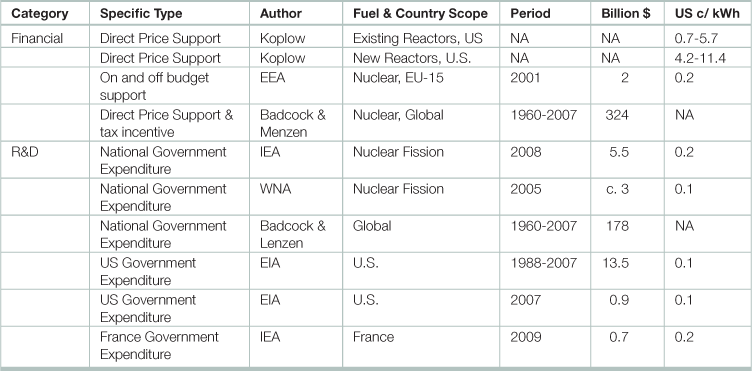
IEA: International Energy Agency; Badcock, J., & Lenzen, M. (2010, September). Subsidies for Electricity-generating Technologies: A review. Energy Policy 38(9), 5038-5047; WNA: World Nuclear Association; Koplow: Doug Koplow, Earthtarck, <http://www.earthtrack.net/.
Source: Adapted from Global Subsidies Initiative. 2011. Subsidies and External Costs in Electric Power Generation: A comparative review of estimates, <http://www.iisd.org/gsi/sites/default/files/power_gen_subsidies.pdf>.
Table 29.22
Estimates of subsidies to electricity generated from renewable sources
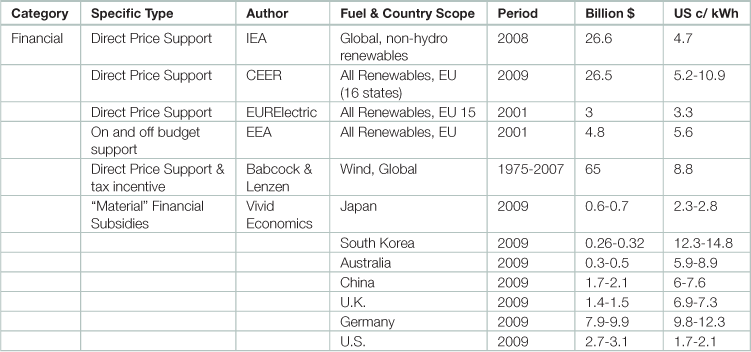
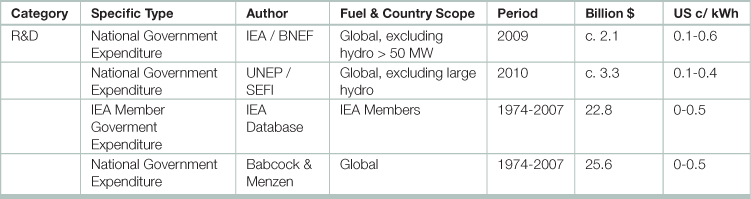
IEA: International Energy Agency; CEER: Council of European Energy Regulators; EEA: European Environment Agency; Badcock, J., & Lenzen, M. (2010, September). Subsidies for Electricity-generating Technologies: A review. Energy Policy 38(9), 5038-5047; UNEP: United Nations Environmental Programme; BNEF: Bloomberg New Energy Finance; SEFI: UNEP Sustainable Energy Finance Initiative
Source: Adapted from Global Subsidies Initiative. 2011. Subsidies and External Costs in Electric Power Generation: A comparative review of estimates, <http://www.iisd.org/gsi/sites/default/files/power_gen_subsidies.pdf>.
Table 29.23
Common forms of government interventions in energy markets
| Intervention type | Description |
| Accessa | Policies governing the terms of access to domestic onshore and offshore resources (e.g., leasing) |
| Cross-subsidya,b | Policies that reduce costs to particular types of customers or regions by increasing charges to other customers or regions |
| Direct spendingb | Direct budgetary outlays for an energy-related purpose |
| Government ownershipb | Government ownership of all or a significant part of an energy enterprise or a supporting service organization |
| Import/Export restrictiona | Restrictions on the free market flow of energy products and services between countries |
| Informationb | Provision of market-related information that would otherwise have to be purchased by private market participants |
| Lendingb | Below-market provision of loans or loan guarantees for energy-related activities |
| Price controlsa | Direct regulation of wholesale or retail energy prices |
| Purchase requirementsa | Required purchase of particular energy commodities, such as domestic coal, regardless of whether other choices are more economically attractive |
| Research and Developmentb | Partial or full government funding for energy-related research and development |
| Regulationa | Government regulatory efforts that substantially alter the rights and resposibilities of various parties in energy markets or that exempt certain parties from those changes |
| Riskb | Government-provided insurance or indemnification at below-market prices |
| Taxa,b | Special tax levies or exemptions for energy-related activities |
aCan act either as a subsidy or a tax depending on program specifics and one’s position in the marketplace.
bInterventions included within the realm of fiscal subsidies.
Source: Adapted from Koplow, Doug. 2004. Subsidies to Energy Industries, In: Cutler J. Cleveland, Editor-in-Chief, Encyclopedia of Energy, (New York, Elsevier), Pages 749-764.
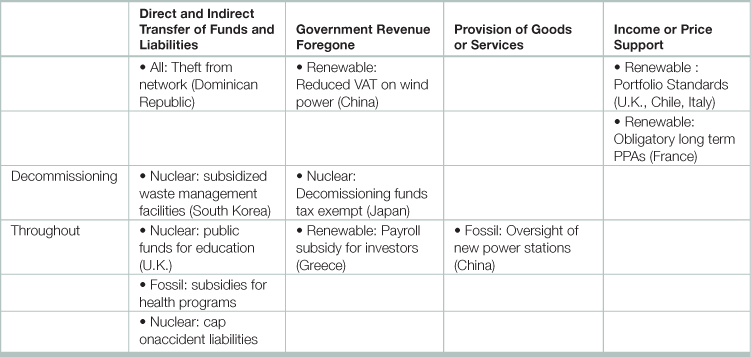
Table 29.24
Matrix of transfers associated with subsidies to the energy industries, with examples of specific support policies
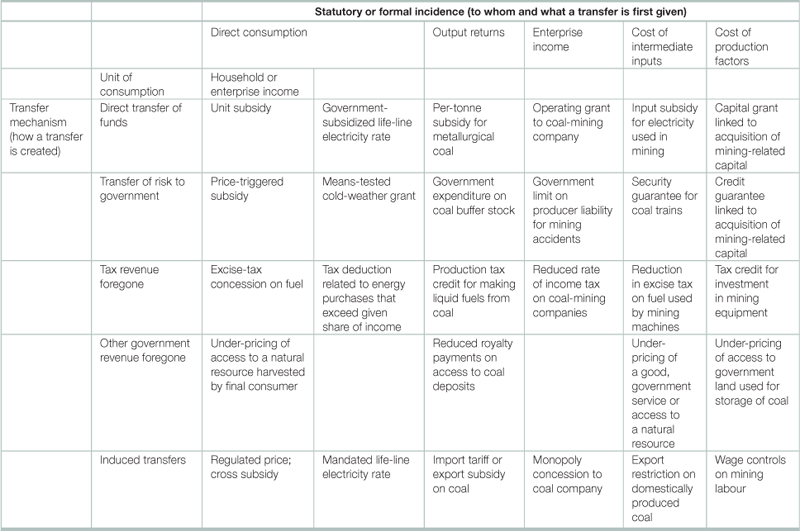
Source: Adapted from IEA, OPEC, OECD, WORLD BANK, Analysis of the Scope of Energy Subsidies and Suggestions for the G-20 Initiative, Prepared for submission to the G-20 Summit Meeting, Toronto (Canada), 26-27 June 2010.
Table 29.25
Selected energy funds, June 2012
| Fund | Net assets | Top holdings |
| Dow Jones U.S. Energy Sector Index Fund | 770M | Exxon Mobil, Chevron, Schlumberger NV |
| S&P Global Energy Sector Index Fund | 1075M | Exxon Mobil, Chevron,BP |
| Putnam Global Natural Resources A | 307M | Exxon Mobil,Royal Dutch Shell PLC, Rio Tinto PLC |
| Dow Jones U.S. Oil Equipment & Services Index Fund | 770M | Schlumberger NV, National Oilwell Drilling, Halliburton |
| Dow Jones U.S. Oil & Gas Exploration & Production Index Fund | 286M | Occidental Petroleum Corporation, Apache Corp, Andarko Petroleum Corp. |
| S&P Global Clean Energy Index Fund | 28M | China Everbright International, LTD, Covanta Energy, CEMIG SA -SPONS ADR |
| U.S. Global Investors Global Res | 595M | SM Energy Company , EQT Corporation, Hess Corporation |
| S&P Global Nuclear Energy Index Fund | 10M | Exelon. Corp, Cameco Corp., Mitsubishi Electric Corp. |
| Ivy Energy A | 108M | National Oilwell Varco, Inc., Continental Resources Inc, Schlumberger NV |
| “Clean Energy” Mutual Funds | ||
| Fidelity Select Envir Alt Energy | 69.4M | Danaher Corporation, Emerson Electric Co., |
| Republic Services Inc Class A | ||
| New Alternatives | 148.8M | American Water Works Co Inc, Koninklijke Philips Electronics, Johnson Controls Inc |
| Winslow Green Growth Inv | 172.2M | Trimble Navigation Ltd., United Natural Foods, Inc.,Clean Harbors, Inc. |
| Gabelli SRI Green AAA | 51.94M | Mead Johnson Nutrition Company, Danone, Dialight PLC |
| Leuthold Global Clean Tech Retail | 11.7M | World Energy Solutions, Inc.,Pentair, Inc., DA-ES, Inc. |
| DWS Clean Technology S | 18.23M | Danaher Corporation, BG Group PLC, ABB, Ltd. |
Source: Morningstar
Table 29.26
Energy research and development expenditures in selected nationsa, 1975-2010 (million USD, 2010 prices and exchange rates)

aAustralia, Austria, Belgium, Canada, Denmark, Finland, France, Germany, Greece, Hungary, Ireland, Italy, Japan, Korea, Luxembourg, the Netherlands, New Zealand, Norway, Portugal, Spain, Sweden, Switzerland, Turkey, the United Kingdom and the United States.
Source: International Energy Agency, Statistics database, <http://www.iea.org/stats/>.
Table 29.27
Experience curve studies for energy demand technologies

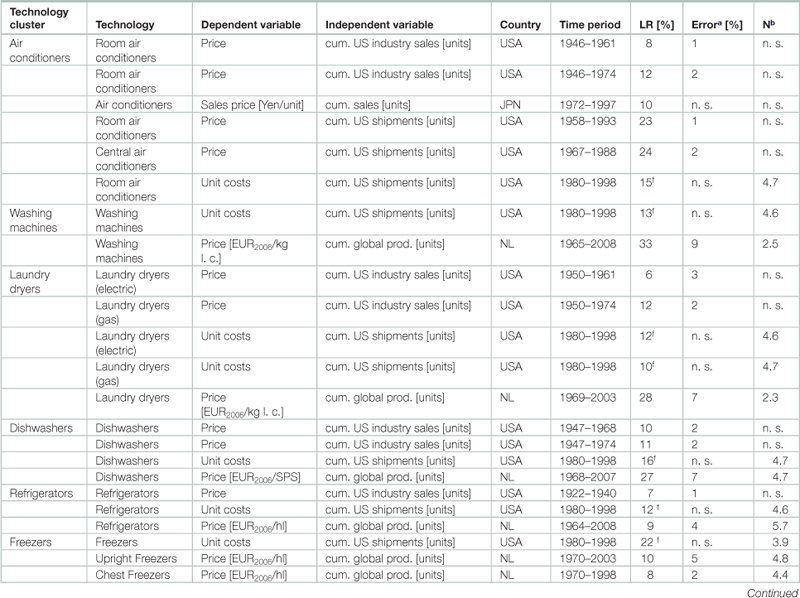

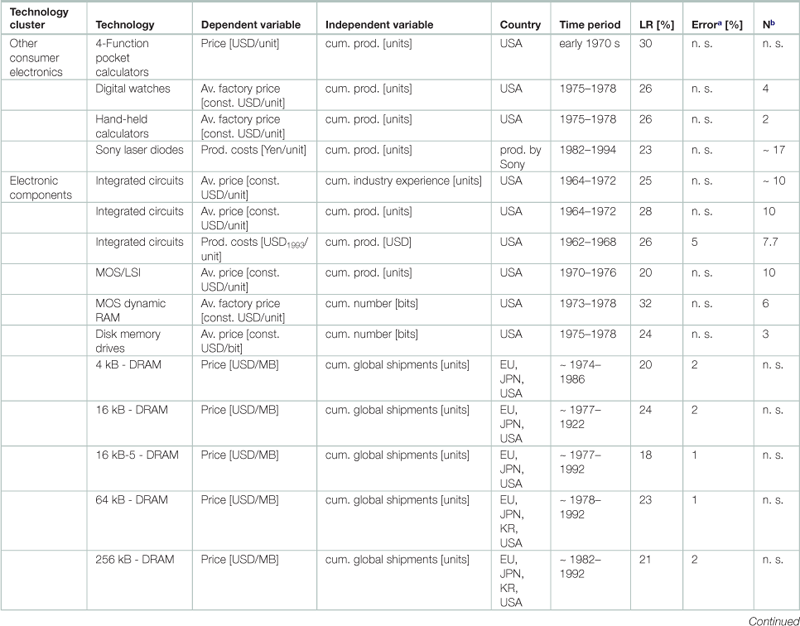
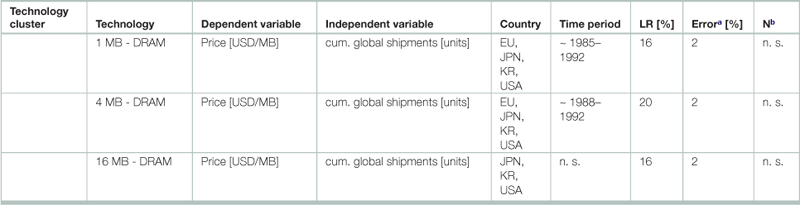
Abbreviations, units, and symbols: LR: learning rate, the percentage decrease in wind power cost for each doubling of cumulative capacity or production.av. — average; CFLs — compact fluorescent light bulbs; const. — constant; cum. — cumulative; CH — Switzerland; DRAM — dynamic random access memory; EPROM — erasable programmable read only memory; EU — Europe; EUR — Euro (subscript numbers indicate the base year of currency deflation); FL — fluorescent light bulbs; GER — Germany; Glm — gigalumen; GWh — gigawatt hours; hl — hectolitre; inst.—installed; INT—international data; inv.—investment; JPN—Japan; kB—kilobyte; klm—kilolumen; KR—South Korea; kWhth—kilowatt hour thermal; LSI—large-scale integration; MB—megabyte; MOS— metal oxide semiconductor; MWe—gigawatt electric; NL—the Netherlands; n.s.—not specified; prod.—production, RAM—random access memory; SPS—standard place setting; TV—television, USD—United States dollars (subscript numbers indicate the base year of currency deflation).
aRepresenting the 95% confidence interval of learning rates.
bN — number of doublings of cumulative production.
cBuilding facades insulation of 1.0 W/m2K (Watt per square meter and degree Kelvin).
dBuilding facades insulation of 1.25 W/m2K.
eWeighted average of modular and integral CFLs.
fLearning rate refers to the cost difference between base year and final year of analysis.
Table 29.28
Demand and price elasticity of demanda for crude oil, selected nations,1971-2000b
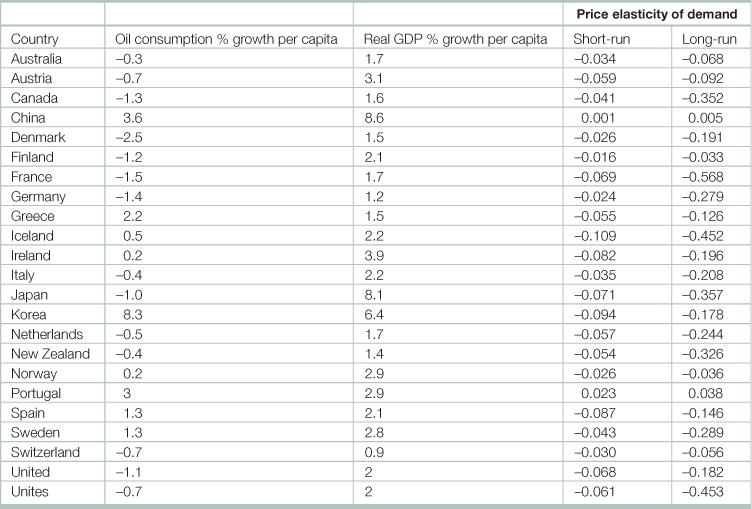
aThe percentage change in the quantity demanded relative to a percentage change in its own price.
bThe calculations for China and South Korea are based on the period 1979–2000.
Source: Adapted from Cooper, John C.B. 2003. Price elasticity of demand for crude oil: estimates for 23 countries, Volume 27, Issue 1, pages 1–8.
Table 29.29
Estimates of the pricea and incomeb elasticity of demand for oil and motor gasoline
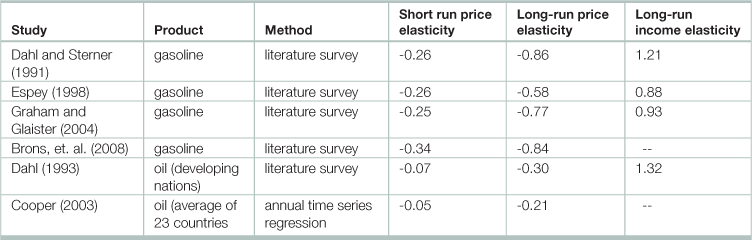
Brons, Martijn, Peter Nijkamp, Eric Pels, and Piet Rietveld. 2008. “A Meta- Analysis of the Price Elasticity of Gasoline Demand: A SUR Approach,” Energy Economics 30, pp. 2105—2122.
Cooper, John C.B. 2003. “Price Elasticity of Demand for Crude Oil: Estimates for 23 Countries,” OPEC Review 27(1), pp. 1-8.
Dahl, Carol A. 1993. “A Survey of Oil Demand Elasticities for Developing Countries,” OPEC Review 17(Winter), pp. 399-419.
Dahl, Carol A. and Thomas Sterner. 1991. “Analysing Gasoline Demand Elasticities: A Survey,” Energy Economics 13, pp. 203-210.
Espey, Molly. 1998. “Gasoline Demand Revisited: An International Meta-Analysis of Elasticities,” Energy Economics 20, pp. 273-295.
Graham, Daniel J., and Stephen Glaister. 2004. “Road Traffic Demand Elasticity Estimates: A Review,” Transport Reviews 24(3), pp. 261—274.
aThe percentage change in the quantity demanded relative to a percentage change in its own price.
bThe percentage change in the quantity demanded relative to a percentage change in income by consumers.
Source: Adapted from Hamilton, James D., 2008. Understanding crude oil prices, National Bureau of Economic Research, Working Paper 14492, <http://www.nber.org/papers/w14492>.
Table 29.30
Estimates of the long and short run price elasticity of demand for electricitya
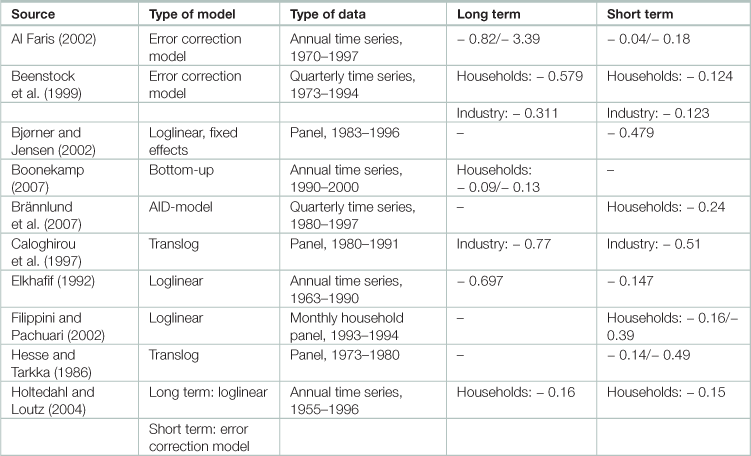

Al Faris, A.R.F., 2002. The demand for electricity in the GCC countries. Energy Policy 30, 117–124.
Beenstock, M., Goldin, E., Nabot, D., 1999. The demand for electricity in Israel. Energy Economics 21, 168–183.
Bjørner, T.B., Jensen, H.H., 2002. Interfuel substitution within industrial companies: an analysis based on panel data at
company level. The Energy Journal 23 (2), 27–50.
Boisvert, R., Cappers, P., Neenan, B., Scott, B., 2004. Industrial and Commercial Customer Response to Real Time
Electricity Prices. Neenan Associates.
Boonekamp, P.G.M., 2007. Price elasticities, policy measures and actual developments in household energy
consumption—a bottom up analysis for the Netherlands. Energy Economics 29, 133–157.
Brännlund, R., Ghalwash T., Nordström, J., Increased energy efficiency and the rebound effect: effects on
consumption and emissions. Energy Economics, Volume 29, Issue 1, January 2007.
Caloghirou, Y.D., Mourelatos, A.G., Thompson, H., 1997. Industrial energy substitution during the 1980s in the Greek
economy. Energy Economics 19, 476–491.
Doorman, G., 2003. Capacity subscription and security of supply in deregulated electricity markets. Paper Presented at
Research Symposium on European Electricity Markets. The Hague. http://www.electricitymarkets.info/symp03/doc/
b1_1-paper.pdf.
Elkhafif, M.A.T., 1992. Estimating disaggregated price elasticities in industrial energy demand. The Energy Journal 13 (4), 209–217.
Filippini, M., Pachuari, S., 2002. Elasticities of electricity demand in urban Indian households. CEPE Working Paper,
vol. 16. Centre for Energy Policy and Economics, Swiss Federal Institutes of Technology.
Hesse, D.M., Tarkka, H., 1986. The demand for capital, labor and energy in European manufacturing industry before and
after the oil price shocks. Scandinavian Journal of Economics 88 (3), 529–546.
Holtedahl, P., Loutz, F.J., 2004. Residential electricity demand in Taiwan. Energy Economics 26, 201–224.
Ilmakunnas, P., Törmä, H., 1989. Structural change in factor substitution in Finnish manufacturing. Scandinavian Journal of Economics 91 (4), 705–721.
Jones, C.T., 1995. A dynamic analysis of interfuel substitution in U.S. industrial energy demand. Journal of Business and
Economic Statistics 13 (4), 459–465.
Roy, J., Sanstad, A.H., Sathaye J.A., Khaddaria, R., in press. Substitution and price elasticity estimates using inter-country
pooled data in a translog cost model. Energy Economics, vol. 28(5-6), pages 706-719,.
Taheri, A.A., 1994. Oil Shocks and the dynamics of substitution adjustments of industrial fuels in the US. Applied
Economics 26 (8), 751–756.
Taylor, L.D., 1975. The demand for electricity: a survey. The Bell Journal of Economics 6 (1), 74–110.
Urga, G.,Walters, C., 2003. Dynamic translog and linear logit models: a factor demand analysis of interfuel substitution in
US industrial energy demand. Energy Economics 25, 1–21.
Woodland, A.D., 1993. A micro-econometric analysis of the industrial demand for energy in NSW. The Energy Journal 14 (2), 57–89.
Zachariadis, T., Pashourtidou, N., 2007. An empirical analysis of electricity consumption in Cyprus. Energy Economics 29, 183–198.
aThe percentage change in the quantity demanded relative to a percentage change in its own price.
bNot significantly different from zero.
Source: Adapted from Lijesen, Mark G. 2007. The real-time price elasticity of electricity, Energy Economics, Volume 29, Issue 2, Pages 249-258.
Table 29.31
Impacts assessed in the ExternE project of the European Union
| Impact Category | Pollutant/Burden | Effects |
| Human Health mortality | PM10 | Reduction in life expectancy due to short and long time exposure |
| SO2, O3 | Reduction in life expectancy due to short time exposure | |
| Benzene, BaP, 1,3-butad., Diesel part. | Reduction in life expectancy due to long time exposure | |
| Noise | Reduction in life expectancy due to long time exposure | |
| Accident risk | Fatality risk from traffic and workplace accidents | |
| Human Health morbidity | PM10, SO2, O3 | Respiratory hospital admissions |
| PM10, O3 | Restricted activity days | |
| PM10, CO | Congestive heart failure | |
| Benzene, BaP, 1,3-butad., Diesel part. | Cancer risk (non-fatal) | |
| PM10 | Cerebrovascular hospital admissions, cases of chronic bronchitis, cases of chronic cough in children, cough in asthmatics, lower respiratory symptoms | |
| O3 | Asthma attacks, symptom days | |
| Noise | Myocardial infarction, angina pectoris, hypertension, sleep disturbance | |
| Accident risk | Risk of injuries from traffic and workplace accidents | |
| Building Material | SO2, Acid deposition | Ageing of galvanised steel, limestone, mortar, sandstone, paint, rendering, and zinc for utilitarian buildings |
| Combustion particles | Soiling of buildings | |
| Crops | SO2 | Yield change for wheat, barley, rye, oats, potato, sugar beet |
| O3 | Yield change for wheat, barley, rye, oats, potato, rice, tobacco, sunflower seed | |
| Acid deposition | Increased need for liming | |
| N, S | Fertilising effects | |
| Global warming | CO2, CH4, N2O | World-wide effects on mortality, morbidity, coastal impacts, agriculture, energy demand, and economic impacts due to temperature change and sea level rise |
| Amenity lossess | Noise | Amenity losses due to noise exposure |
| Ecosystems | SO2, NOx, NH3 | Eutrophication, Acidification |
Source: Bickel, Peter and Rainer Friedrich (Editors). 2005. ExternE: Externalities of Energy, Methodology 2005 Update (Luxembourg, Office for Official Publications of the European Communities).
Table 29.32
Value of energy depletion, top 20 nations, 1970-2008 (billion USD)
Energy depletion is equal to the ratio of present value of rents, discounted at 4%, to exhaustion time of the resource. It covers crude oil, natural gas, and coal. Exhaustion time = Min (25 years, Reserves/Production). Rents = Unit Rents ∗ Production. Unit Rents = Unit Price – Unit Cost.
Source: World Bank, Changing Wealth of Nations, 2010 update, <http://data.worldbank.org/data-catalog/wealth-of-nations>.
Table 29.33
Value of human and natural capital by region, 2005 (billions of 2005 USD)
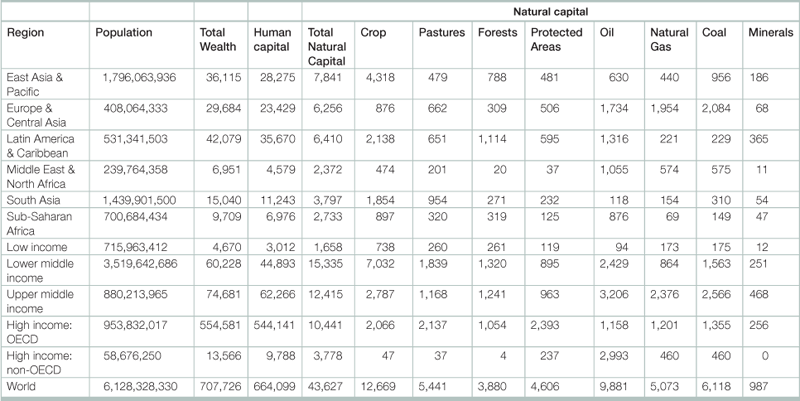
Source: World Bank, Changing Wealth of Nations, 2010 update, <http://data.worldbank.org/data-catalog/wealth-of-nations.
Table 29.34
Monetary values used in the ExternE project of the European Uniona
| Health end-point | Recommended central unit values in q price year 2000 |
| Value of a prevented Fatality | 1,000,000 |
| Year of Life Lost | 50,000 / year lost |
| Hospital admissions | 2,000 / admission |
| Emergency Room Visit for respiratory illness | 670 / visit |
| General Practitioner visits: | |
| Asthma | 53 / consultation |
| Lower respiratory symptoms | 75 / consultation |
| Respiratory symptoms in asthmatics: | |
| Adults | 130 / event |
| Children | 280 / event |
| Respiratory medication use – adults and children | 1 / day |
| Restricted activity days | 130 / day |
| Cough day | 38 / day |
| Symptom day | 38 / day |
| Work loss day | 82 / day |
| Minor restricted activity day | 38 / day |
| Chronic bronchitis | 190,000/ case |
Source: Friedrich, Rainer, ExternE: Methodologyand Results, paper presented at the meeting “External costs of energy and their internalisation in Europe,” 9 December 2005 at the European Commission, <http://www.externe.info/externe_d7/?q=node/60>
Table 29.35
Estimates of the marginal abatement costs (MAC) of greenhouse gas emissions
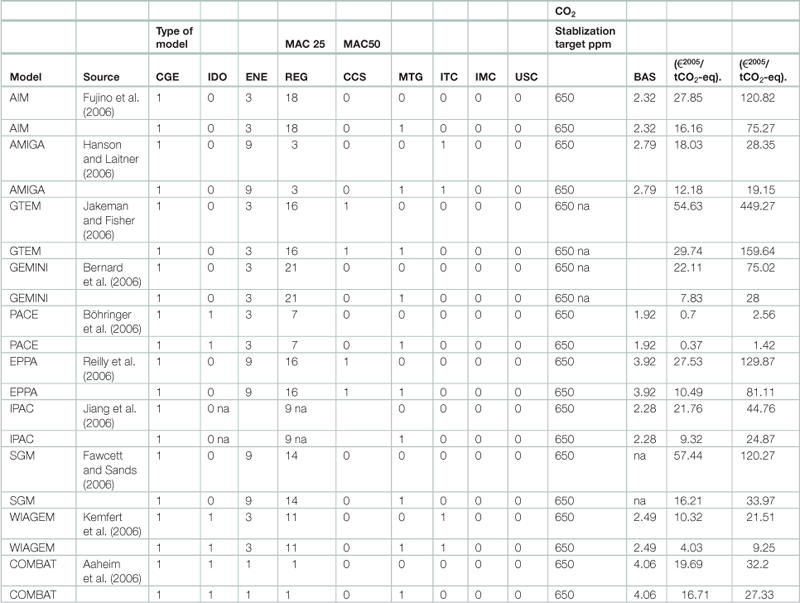
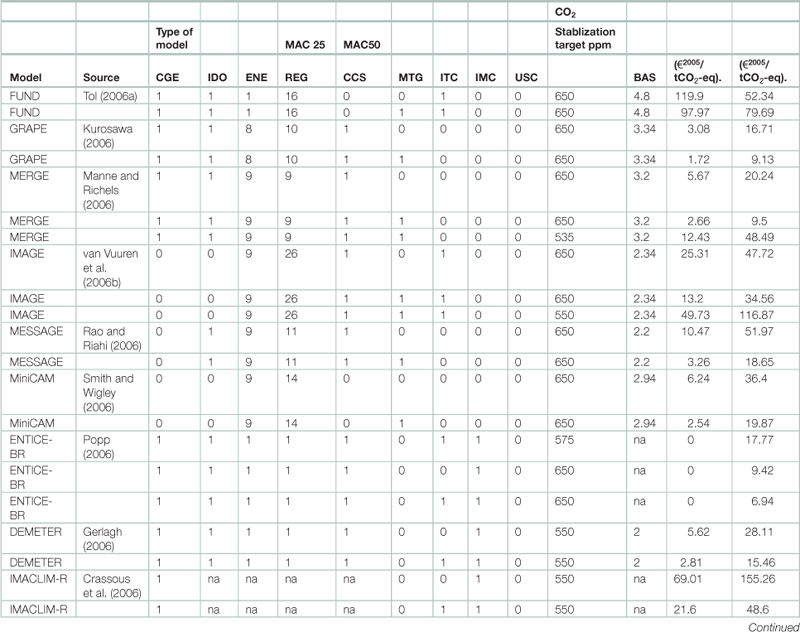
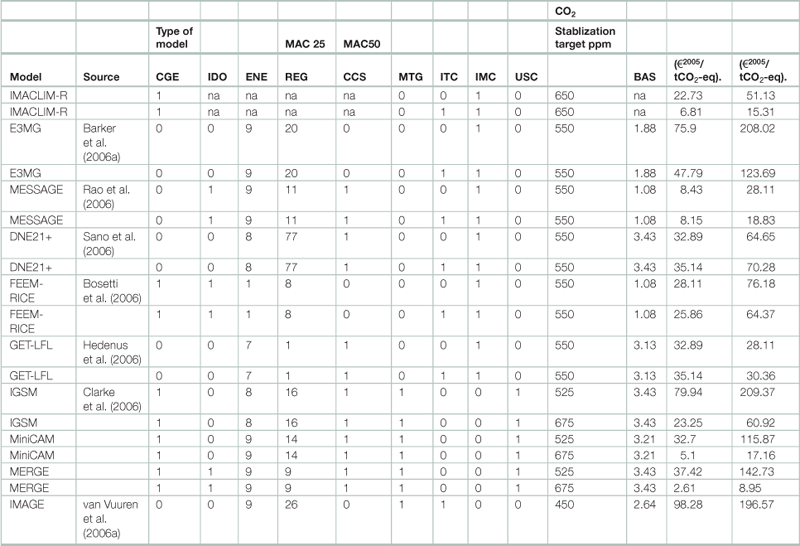
CGE=computable general equilibrium (model); IDO=Intertemporal Dynamic Optimisation; ENE=Energy sources; REG=Regions; CCS=Carbon Capture and Storage; MTG=Multigas; ITC=Induced Technical Change; IMC=IMCP; USC=to USC=USCCCP; United States Climate Change Science Program; TAR=Target; BAS=Baseline; MAC25=Marginal abatement cost in 2025; MAC50=Marginal abatement cost in 2050.na=not available.
J. Fujino, R. Nair, M. Kainuma, T. Masui, Y. Matsuoka, Multi-gas mitigation analysis on stabilization scenarios using aim global model, The Energy Journal Special Issue on Multi-Greenhouse Gas Mitigation and Climate Policy (2006), pp. 343–353D.
A. Hanson, J.A. Laitner, Technology policy and world greenhouse gas emissions in the Amiga modeling system, The Energy Journal Special Issue on Multi-Greenhouse Gas Mitigation and Climate Policy (2006)
G. Jakeman, B.S. Fisher, Benefits of multi-gas mitigation: an application of the global trade and environment model (GTEM), The Energy Journal Special Issue on Multi-Greenhouse Gas Mitigation and Climate Policy (2006), pp. 323–342
A. Bernard, M. Vielle, L. Viguer, Burden sharing within a multi-gas strategy, The Energy Journal Special Issue on Multi-Greenhouse Gas Mitigation and Climate Policy (2006), pp. 289–304
C. Böhringer, A. Löschel, T.F. Rutherford, Efficiency gains from “what”-flexibility in climate policy, An Integrated CGE Assessment. The Energy Journal Special Issue on Multi-Greenhouse Gas Mitigation and Climate Policy (2006), pp. 405–424
D. Popp, Comparison of climate policies in the ENTICE-BR model, The Energy Journal Special Issue on Endogenous Technological Change and the Economics of Atmospheric Stabilisation (2006), pp. 163–174S. Rao, K. Riahi, The role of Non-CO2 greenhouse gases in climate change mitigation: long-term scenarios for the 21st century, The Energy Journal Special Issue on Multi-Greenhouse Gas Mitigation and Climate Policy (2006), pp. 177–200J. Reilly, M. Sarofim, S. Paltsev, R. Prinn, The role of non-CO2 GHGs in climate policy: analysis using the MIT IGSM, The Energy Journal Special Issue on Multi-Greenhouse Gas Mitigation and Climate Policy (2006), pp. 503–520
K. Jiang, X. Hu, Z. Songli, Multi-gas mitigation analysis by IPAC, The Energy Journal Special Issue on Multi-Greenhouse Gas Mitigation and Climate Policy (2006), pp. 425–440
A.A. Fawcett, R.D. Sands, Non-CO2 greenhouse gases in the second generation model, The Energy Journal Special Issue on Multi-Greenhouse Gas Mitigation and Climate Policy (2006), pp. 305–322
C. Kemfert, T.P. Truong, T. Bruckner, Economic impact assessment of climate change-a multi-gas investigation with WIAGEM-GTAPEL-ICM, The Energy Journal Special Issue on Multi-Greenhouse Gas Mitigation and Climate Policy (2006), pp. 441–460
A. Aaheim, J.S. Fuglestvedt, O. Godal, Costs savings of a flexible multi-gas climate policy, The Energy Journal Special Issue on Multi-Greenhouse Gas Mitigation and Climate Policy (2006), pp. 485–501
R.S.J. Tol, Multi-gas emission reduction for climate change policy: an application of FUND, The Energy Journal (2006), pp. 235–250
A. Kurosawa, Multigas mitigation: an economic analysis using GRAPE model, The Energy Journal Special Issue on Multi-Greenhouse Gas Mitigation and Climate Policy (2006), pp. 275–288
A. Manne, R.G. Richels, The role of Non-CO2 greenhouse gases and carbon sinks in meeting climate objectives, The Energy Journal Special Issue on Multi-Greenhouse Gas Mitigation and Climate Policy (2006), pp. 393–404
van Vuuren, M.G.J. den Elzen, P.L. Lucas, B. Eickhout, B.J. Strengers, B. van Ruijven, S. Wonink, R. van Houdt, Stabilizing greenhouse gas concentrations at low levels: an assessment of reduction strategies and costs, Climatic Change, 81 (2007), pp. 119–159
S.J. Smith, T.M.L. Wigley, Multi-gas forcing stabilization with minicam, The Energy Journal Special Issue on Multi-Greenhouse Gas Mitigation and Climate Policy (2006), pp. 373–392R.
Gerlagh, ITC in a global growth-climate model with CCS: the value of induced technical change for climate stabilization, The Energy Journal Special Issue on Endogenous Technological Change and the Economics of Atmospheric Stabilisation (2006), pp. 223–240
R. Crassous, J.-C. Hourcade, O. Sassi, Endogenous structural change and climate targets modeling experiments with Imaclim-R, The Energy Journal Special Issue on Endogenous Technological Change and the Economics of Atmospheric Stabilisation (2006), pp. 259–276
T. Barker, H. Pan, J. Köhler, R. Warren, S. Winne, Decarbonizing the global economy with induced technological change: scenarios to 2100 using E3MG, The Energy Journal Special Issue on Endogenous Technological Change and the Economics of Atmospheric Stabilisation (2006)
S. Rao, I. Keppo, K. Riahi, Importance of technological change and spillovers in long-term climate policy, The Energy Journal Special Issue on Endogenous Technological Change and the Economics of Atmospheric Stabilisation (2006), pp. 123–139
F. Sano, K. Akimoto, T. Homma, T. Tomoda, Analysis of technological portfolios for CO2 stabilization and effects on technological changes, The Energy Journal Special Issue on Endogenous Technological Change and the Economics of Atmospheric Stabilisation (2006), pp. 141–161
V. Bosetti, C. Carraro, M. Galeotti, The dynamics of carbon and energy intensity in a model of endogenous technical change, The Energy Journal Special Issue on Endogenous Technological Change and the Economics of Atmospheric Stabilisation (2006), pp. 191–205
F. Hedenus, C. Azar, K. Lindgren, Induced technical change in a limited foresight optimization model, The Energy Journal Special Issue on Endogenous Technological Change and the Economics of Atmospheric Stabilisation (2006), pp. 109–122
L.E. Clarke, J.P. Weyant, J.A. Edmonds, On the sources of technological change: what do the models assume?, Energy Economics, 30 (2008), pp. 409–424
D. van Vuuren, M.G.J. Den Elzen, P. Lucas, B. Eickhout, B.J. Strengers, V.R. B., M.M. Berk, H.J.M. De Vries, M. Hoogwijk, M. Meinshausen, S.J. Wonink, R. Van den Houdt, R. Oostenrijk, Stabilising Greenhouse Gas Concentrations at Low Levels: An Assessment of Options and Costs, Netherlands Environmental Assessment Agency, Bilthoven (2006) p. 273
Source: Adapted from: Kuik, Onno, Luke Brander, Richard S.J. Tol. 2009. Marginal abatement costs of greenhouse gas emissions: A meta-analysis, Energy Policy, Volume 37, Issue 4, Pages 1395-1403.
Table 29.36
Global trends in renewable energy investment, by region 2004-2011 (billion USD)

Source; Adapted from Frankfurt School of Finance and Management gGmbH. 2012. Global trends in renewable energy investment 2012, (Frankfurt, Frankfurt School of Finance and Management gGmbH).
Table 29.37
Global trends in renewable energy investment, by sector, 2004-2011 (billion USD)
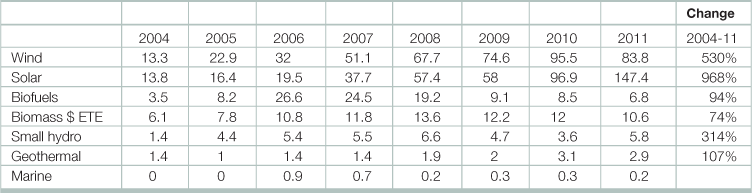
Source; Adapted from Frankfurt School of Finance and Management gGmbH. 2012. Global trends in renewable energy investment 2012, (Frankfurt, Frankfurt School of Finance and Management gGmbH).
Table 29.38
The Energy Development Index (EDI) for selected developing nationsa

aThe EDI is composed of four indicators, each of which captures a specific aspect of potential energy poverty: (1) per capita commercial energy consumption: which serves as an indicator of the overall economic development of a country; (2) Per capita electricity consumption in the residential sector: which serves as an indicator of the reliability of, and consumer’s ability to pay for, electricity services; (3) Share of modern fuels in total residential sector energy use: which serves as an indicator of the level of access to clean cooking facilities, and (4) Share of population with access to electricity. A separate index is created for each indicator, using the actual maximum and minimum values for the developing countries covered. Performance in each indicator is expressed as a value between 0 and 1, and the EDI is then calculated as the arithmetic mean of the four values for each country.
Source: International Energy Agency (IEA). 2011. World Energy Outlook, (Paris, IEA).
Table 29.39
Access to electricity to electricity and reliance on biomass for various regions and nations
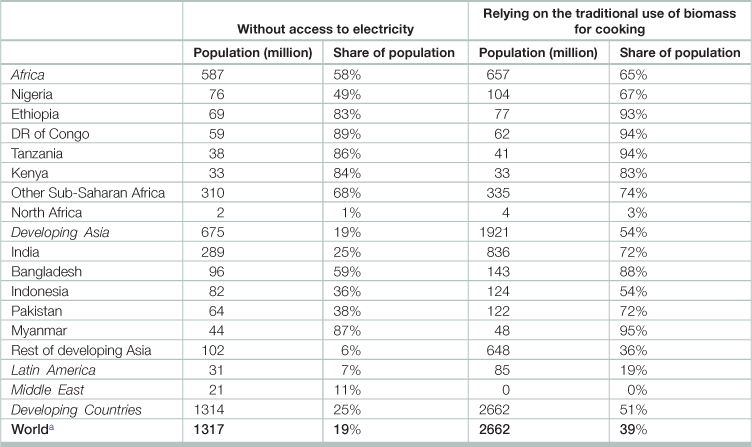
aWorld total includes OECD and Eastern Europe/Eurasia.
Source: Adapted from International Energy Agency. 2011. Energy for All: financing access for the poor, (Paris, IEA)
Table 29.40
Important environmental aspects of materials: the case of aluminum alloys
| Stage | Quantity |
| Raw material | |
| Global production, main component | 37 x 106 metric ton/yr |
| Reserves | 2.03 x 10⁹ metric ton |
| Embodied energy, primary production | 200-220 MJ/kg |
| CO2 footprint, primary production | 11-13 kg/kg |
| Water usage | 495-1490 l/kg |
| Processing | |
| Casting energy | 11 - 12.2 MJ/kg |
| Casting CO2 footprint | 0.82 - 0.91 kg/kg |
| Deformation processing energy | 3.3 - 6.8 MJ/kg |
| Deformation processing CO2 footprint | 0.19 - 0.23 kg/kg |
| End of life | |
| Embodied energy, recycling | 22 - 39 MJ/kg |
| CO2 footprint, recycling | 1.9 - 2.3 kg/kg |
| Recycle fraction in current supply | 41-45% |
Source: Adapted from Ashby, Michael F. 2013. Materials and the Environment (Second Edition), (Boston, Butterworth-Heinemann).