
Wind
Figures
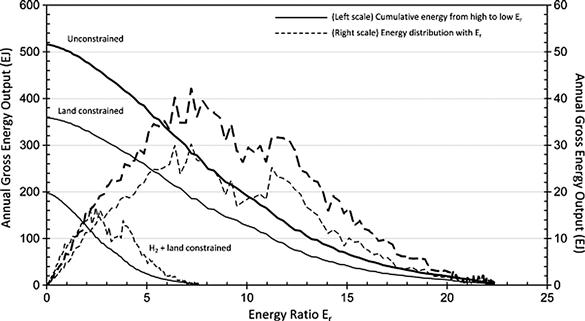
Figure 4.1 Global annual gross wind energy output against energy ratio (Er). Er is the ratio of energy produced to the direct and indirect input energy. Energy is shown as both a cumulative sum for the marginal Er (left axis) and distribution in Er (right axis). In the unconstrained case, all land area is considered; in the land constrained case, sensitive areas such as forests and wetlands, as well as urban areas, irrigated cropland and pasture are removed. Removing these areas has the effect of reducing the gross amount of energy produced. Source: Moriarty, Patrick and Damon Honnery. 2012. What is the global potential for renewable energy?, Renewable and Sustainable Energy Reviews, Volume 16, Issue 1, Pages 244-252.
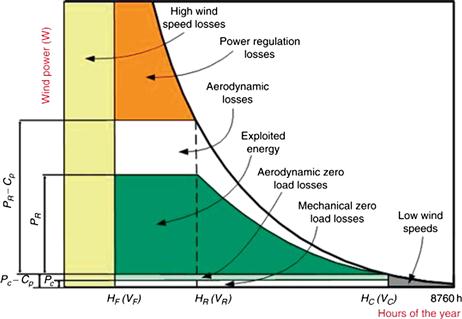
Figure 4.2 Distribution of energy losses through the process of conversion from available wind power to useful electrical over the course of one year. P=power (Watts); PR=nominal power (Watts); V=velocity (meters/sec); Cp=power coefficient (dimensionless); Cp represents the energy generated by the turbine relative to the energy available from the wind. Source: Zafirakis, D.P., A.G. Paliatsos, J.K. Kaldellis. 2012. 2.06 - Energy Yield of Contemporary Wind Turbines, In: Editor-in-Chief: Ali Sayigh, Editor(s)-in-Chief, Comprehensive Renewable Energy, (Oxford, Elsevier), Pages 113-168.
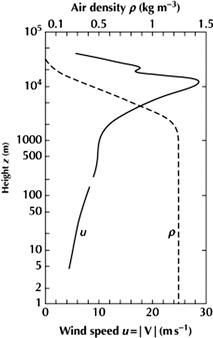
Figure 4.3 Annual average height profile of the kinetic energy density of wind at latitudes 50°–56° N. Source: Sørensen, Bent. 2011. Renewable Energy (Fourth Edition), (Boston, Academic Press).
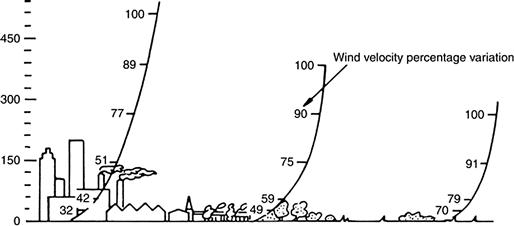
Figure 4.4 The effect of ground roughness on the atmospheric boundary layer development, showing how wind speed varies with altitude. The vertical axis is height (meters). Source: Katsaprakakis, D. Al and D.G. Christakis. 2012. 2.07 - Wind Parks Design, Including Representative Case Studies, In: Editor-in-Chief: Ali Sayigh, Editor(s)-in-Chief, Comprehensive Renewable Energy, (Oxford, Elsevier), Pages 169-223.
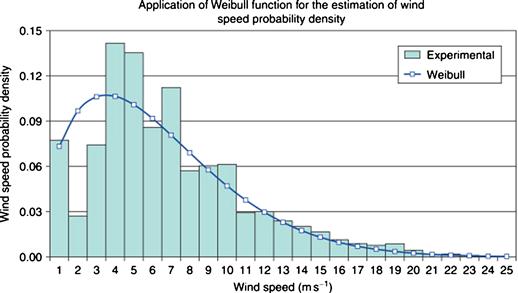
Figure 4.5 Use of Weibull distribution (a continuous probability distribution) to describe wind speed probability density. Source: Zafirakis, D.P., A.G. Paliatsos, J.K. Kaldellis. 2012. 2.06 - Energy Yield of Contemporary Wind Turbines, In: Editor-in-Chief: Ali Sayigh, Editor(s)-in-Chief, Comprehensive Renewable Energy, (Oxford, Elsevier), Pages 113-168.
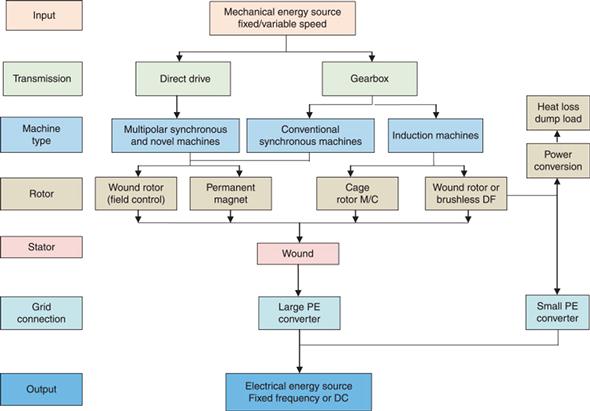
Figure 4.6 Wind turbine classification system. Source: Stavrakakis,G.S. 2012. 2.10 - Electrical Parts of Wind Turbines, In: Editor-in-Chief: Ali Sayigh, Editor(s)-in-Chief, Comprehensive Renewable Energy, (Oxford, Elsevier), Pages 269-328.
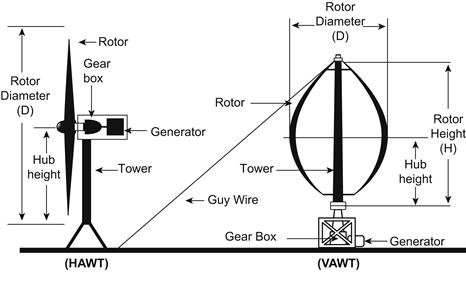
Figure 4.7 Horizontal (HAWT) and vertical axis (VAWT) wind turbines. Source: Adapted from United Sates Department of Energy, National Renewable Energy Laboratory.
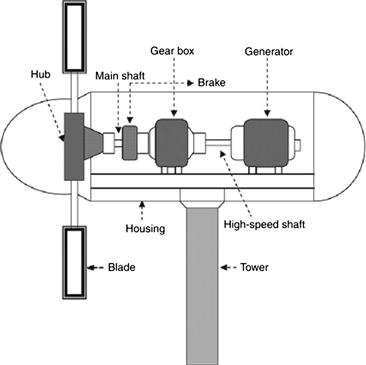
Figure 4.8 Cross-sectional view of a horizontal axis wind turbine. Source: Mathew, S. and G.S. Philip. 2012. 2.05 - Wind Turbines: Evolution, Basic Principles, and Classifications, In: Editor-in-Chief: Ali Sayigh, Editor(s)-in-Chief, Comprehensive Renewable Energy,(Oxford, Elsevier), Pages 93-111.
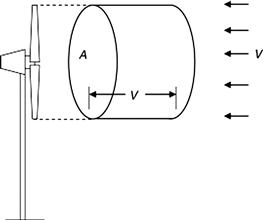
Figure 4.9 A wind turbine interacting with wind stream. The power of the wind (P) is given by P=1/2 ρAV3, where V is velocity, A is the swept area exposed to the wind stream of velocity V normal to the rotor plane, and ρ is the density of air. The condition for maximum power extraction (P) from the wind is given by Pmax = (16/27) x 1/2 ρAV3; the factor 16/27 is called the Betz coefficient which represents the maximum fraction that an ideal wind rotor under the given conditions can extract from the flow. The fraction of extracted power is frequently the power coefficient Cp, which in practice seldom exceeds 40% if measured as the mechanical power of a real wind rotor. Source: Mathew, S. and G.S. Philip. 2012. 2.05 - Wind Turbines: Evolution, Basic Principles, and Classifications, In: Editor-in-Chief: Ali Sayigh, Editor(s)-in-Chief, Comprehensive Renewable Energy,(Oxford, Elsevier), Pages 93-111.
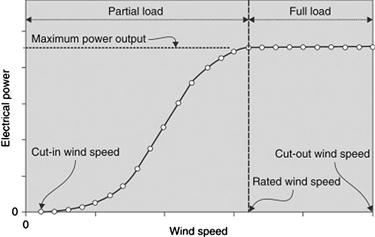
Figure 4.10 Typical power curve for a wind turbine. Source: Carta, J.A. 2012. 2.18 - Wind Power Integration, In: Editor-in-Chief: Ali Sayigh, Editor(s)-in-Chief, Comprehensive Renewable Energy, (Oxford, Elsevier), Pages 569-622.
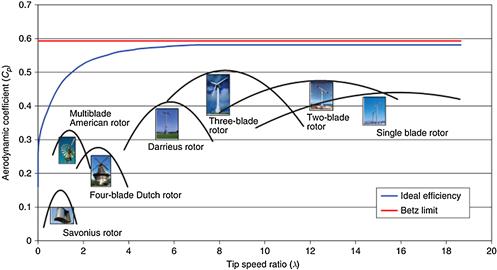
Figure 4.11 The relation between power coefficient (CP) with the tip speed ratio (λ) for a wind turbine. Cp represents the energy generated by the turbine relative to the energy available in the wind. λ is the ratio between the rotational speed of the tip of a blade and the actual velocity of the wind. Both CP and λ are dimensionless parameters. Hence, the CP–λ relationship for a particular rotor is valid for dimensionally similar rotors of any size. Source: Zafirakis, D.P., A.G. Paliatsos, J.K. Kaldellis. 2012. 2.06 - Energy Yield of Contemporary Wind Turbines, In: Editor-in-Chief: Ali Sayigh, Editor(s)-in-Chief, Comprehensive Renewable Energy, (Oxford, Elsevier), Pages 113-168.
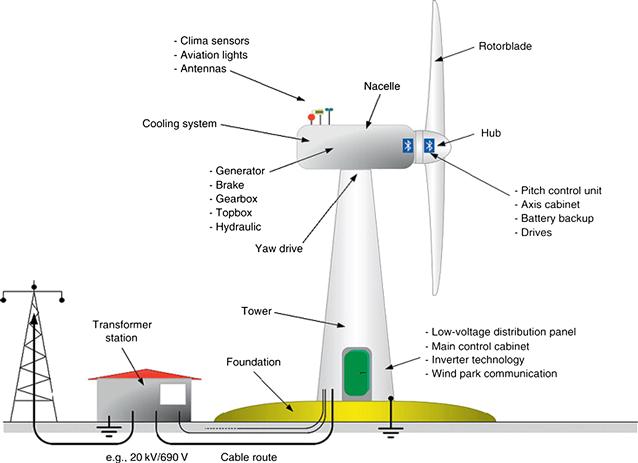
Figure 4.12 A grid-connected onshore wind turbine Source: Stavrakakis,G.S. 2012. 2.10 - Electrical Parts of Wind Turbines, In: Editor-in-Chief: Ali Sayigh, Editor(s)-in-Chief, Comprehensive Renewable Energy, (Oxford, Elsevier), Pages 269-328.
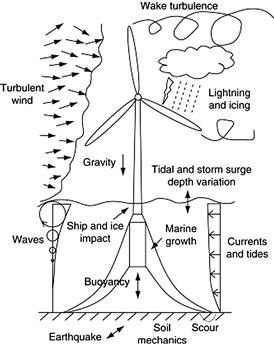
Figure 4.13 Loading sources for an offshore wind turbine. Source: Kapsali, M. and J.K. Kaldellis. 2012. 2.14 - Offshore Wind Power Basics, In: Editor-in-Chief: Ali Sayigh, Editor(s)-in-Chief, Comprehensive Renewable Energy, (Oxford, Elsevier), Pages 431-468.
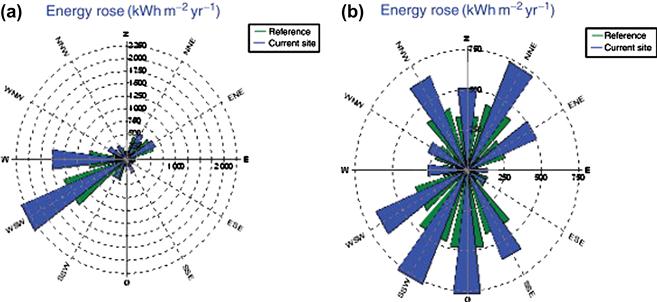
Figure 4.14 A wind energy rose for the west coast of Sweden, summarizing the strength, direction, and frequency of wind. Source: Wizelius, T. 2012. 2.13 - Design and Implementation of a Wind Power Project, In: Editor-in-Chief: Ali Sayigh, Editor(s)-in-Chief, Comprehensive Renewable Energy, (Oxford, Elsevier), Pages 391-430.
Charts
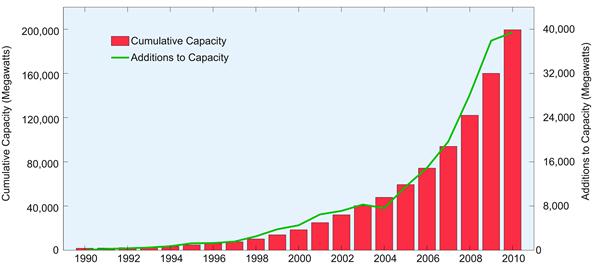
Chart 4.1 World installed annual and cumulative wind generation capacity, 1990-2010. Source: Data from European Wind Energy Association.
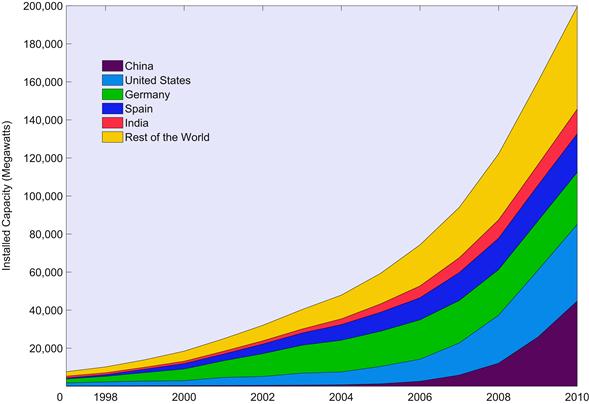
Chart 4.2 Installed cumulative wind generation capacity, top 5 nations and the rest of the world, 1997-2010. Source: Data from Global Wind Energy Council, <http://www.gwec.net/>, accessed 2 February 2012. European Wind Energy Association, <http://www.ewea.org/>.
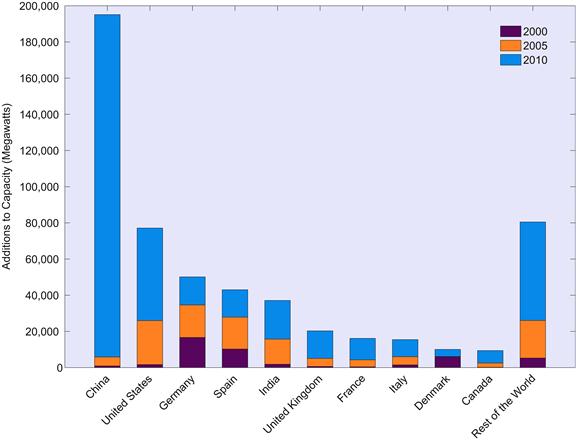
Chart 4.3 Additions to wind generating capacity for top nations and the rest of the world, 2000, 2005 and 2010. Source: Data from Global Wind Energy Council, <http://www.gwec.net/>.
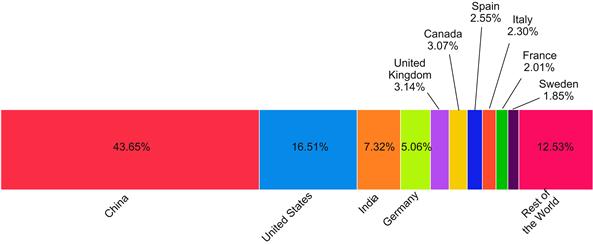
Chart 4.4 Top 10 nations share of new installed wind generating capacity, 2011. Source: Data from Global Wind Energy Council, <http://www.gwec.net/>.
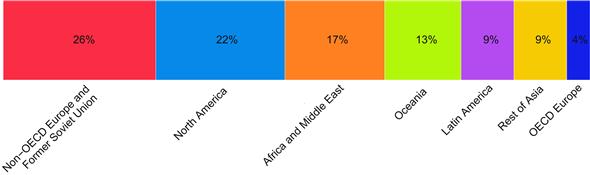
Chart 4.5 Global potential for wind-generated electricity by region. Source: Data from Lu, Xi, Michael B. McElroy and Juha Kiviluoma. 2009. Global potential for wind-generated electricity, Proceedings of the National Academy of Sciences, 106 (27), pp. 10933–10938.
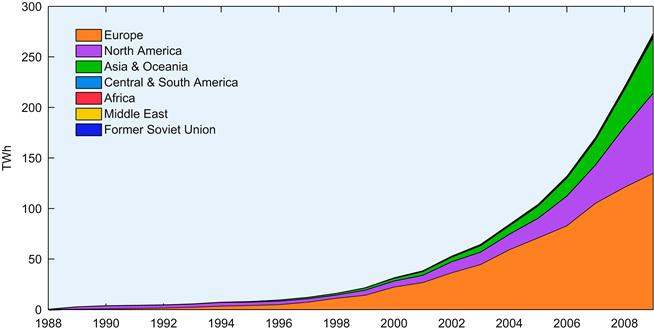
Chart 4.6 Electricity generation from wind energy, by region, 1988-2009. Source: Data from International Energy Agency (IEA), Energy statistics database, <http://www.iea.org/stats/index.asp>.
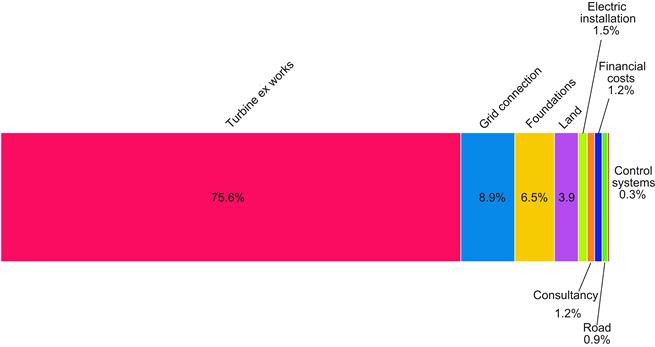
Chart 4.7 Typical investment costs for an onshore wind farm. Source: Data from Kaldellis, J.K., D.P. Zafirakis. 2012. Trends, Prospects, and R&D Directions in Wind Turbine Technology, In: Ali Sayigh, Editor-in-Chief, Comprehensive Renewable Energy, (Oxford, Elsevier), Pages 671-724.
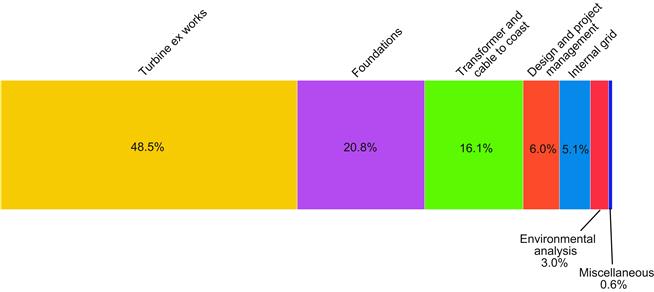
Chart 4.8 Typical investment costs for an offshore wind farm. Source: Data from Kaldellis, J.K., D.P. Zafirakis. 2012. Trends, Prospects, and R&D Directions in Wind Turbine Technology, In: Ali Sayigh, Editor-in-Chief, Comprehensive Renewable Energy, (Oxford, Elsevier), Pages 671-724.
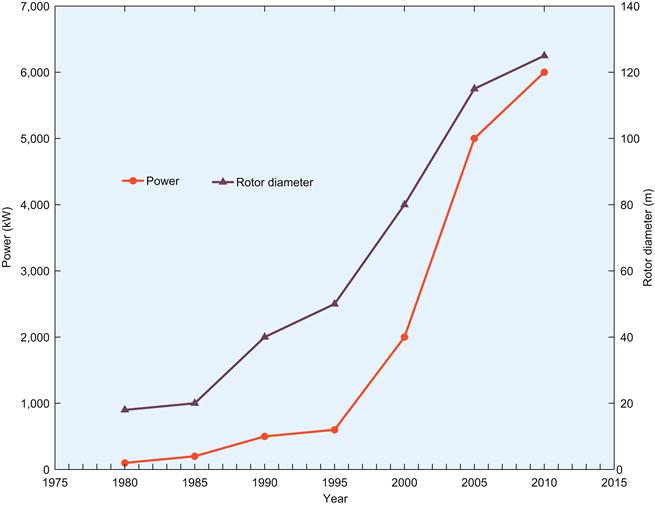
Chart 4.9 Average size and power of wind turbines, 1980-2010. Source: Data from United States Department of Energy, National Renewable Energy Laboratory, National Wind Technology Center, <http://www.nrel.gov/wind/>.
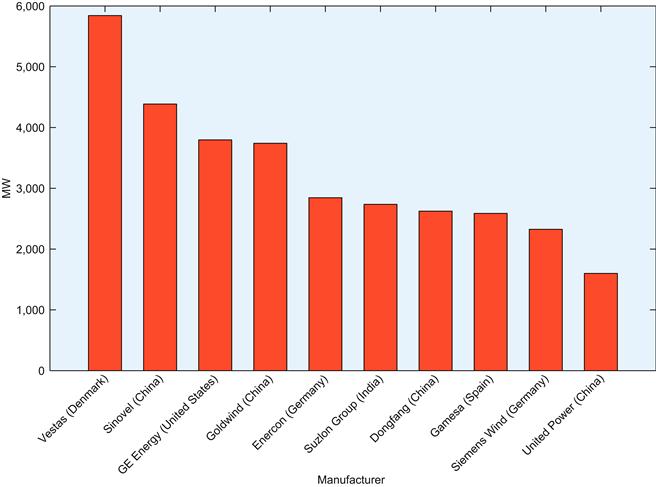
Chart 4.10 Top 10 wind turbine manufacturers by installed capacity, 2010. Source: Data from Global Wind Energy Council, <http://www.gwec.net/>.
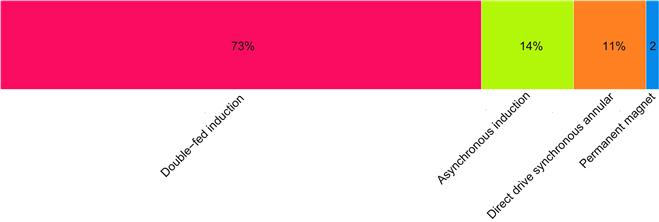
Chart 4.11 Generator/converter pairs in wind turbines. Source: Data from Stavrakakis,G.S. 2012. 2.10 - Electrical Parts of Wind Turbines, In: Editor-in-Chief: Ali Sayigh, Editor(s)-in-Chief, Comprehensive Renewable Energy, (Oxford, Elsevier), Pages 269-328.

Chart 4.12 Market shares of variable speed, two speed, and fixed speed wind turbines. Source: Data from Mathew, S. and G.S. Philip. 2012. 2.05 - Wind Turbines: Evolution, Basic Principles, and Classifications, In: Editor-in-Chief: Ali Sayigh, Editor(s)-in-Chief, Comprehensive Renewable Energy,(Oxford, Elsevier), Pages 93-111.
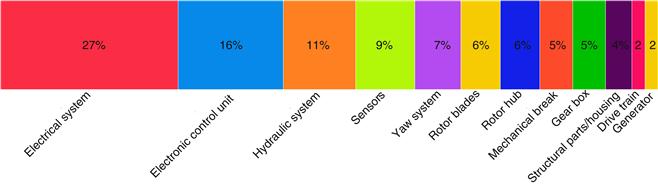
Chart 4.13 Frequency and types of repairs on wind turbines from 2.5 kW to 1.5 MW. Source: Data from United States Department of Energy, National Renewable Energy Laboratory, National Wind Technology Center, <http://www.nrel.gov/wind/>.
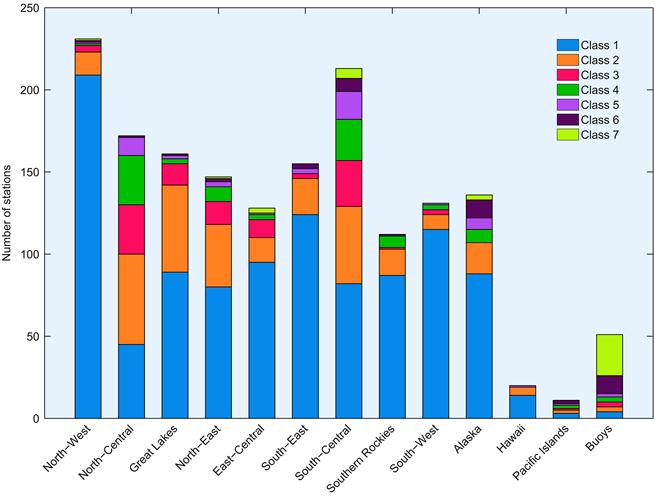
Chart 4.14 Number of United States stations falling into each wind power class at 80 meters height. Speed <5.9 m/s (class 1 at 80 m); 5.9<=speed<6.9 m/s (class 2 at 80 m); 6.9<=speed<7.5 m/s (class 3 at 80 m); 7.5<=speed<8.1 m/s (class 4 at 80 m); 8.1<=speed<8.6 m/s (class 5 at 80 m); 8.6<=speed<9.4 m/s (class 6 at 80 m); speed>=9.4 m/s (class 7 at 80 m). Source: Data from Archer, Cristina L. and Mark Z. Jacobson, The Spatial and Temporal Distributions of U.S. Winds and Windpower at 80 m Derived from Measurements, <http://www.stanford.edu/group/efmh/winds/us_winds.html>, accessed 23 May 2012; this is an update of Archer, C.L., and M.Z. Jacobson, Journal of Geophysical Research, Vol. 108, No. D9, 4289, May 16, 2003.
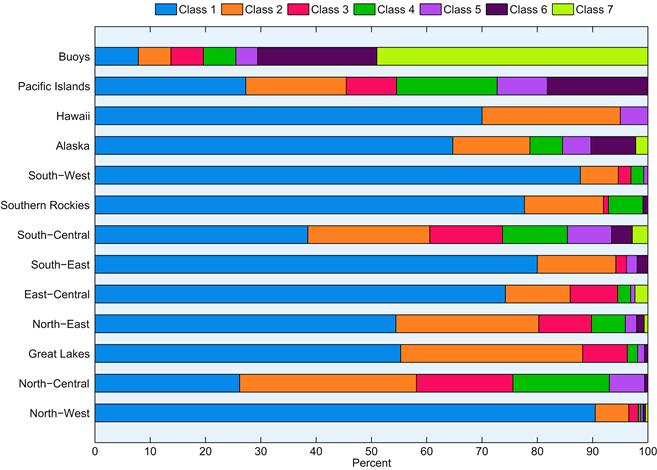
Chart 4.15 Regional distribution of wind resource at 80 meters height by wind speed class in the United States. Speed <5.9 m/s (class 1 at 80 m); 5.9<=speed<6.9 m/s (class 2 at 80 m); 6.9<=speed<7.5 m/s (class 3 at 80 m); 7.5<=speed<8.1 m/s (class 4 at 80 m); 8.1<=speed<8.6 m/s (class 5 at 80 m); 8.6<=speed<9.4 m/s (class 6 at 80 m); speed>=9.4 m/s (class 7 at 80 m). Source: Data from Archer, Cristina L. and Mark Z. Jacobson, The Spatial and Temporal Distributions of U.S. Winds and Windpower at 80 m Derived from Measurements, <http://www.stanford.edu/group/efmh/winds/us_winds.html>, accessed 23 May 2012; this is an update of Archer, C.L., and M.Z. Jacobson, Journal of Geophysical Research, Vol. 108, No. D9, 4289, May 16, 2003.
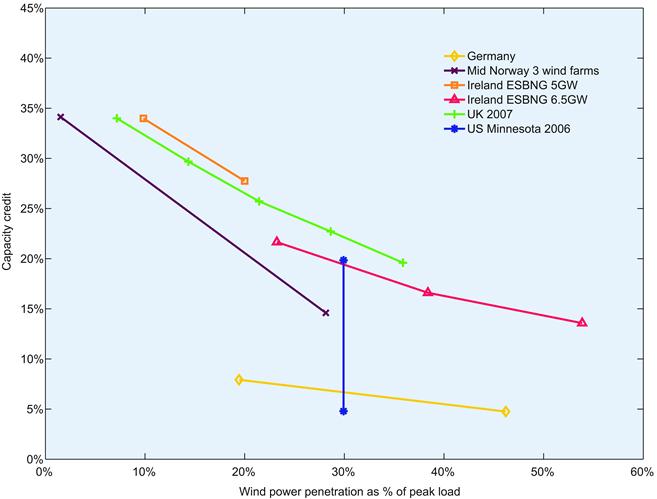
Chart 4.16 Estimates of the capacity credit (capacity value) for wind power. The capacity value of a generator is the amount of additional load that can be served at the target reliability level with the addition of the generator in question. Source: Data from Holttinen, H. Meibom, P. Orths, A. van Hulle, F. Lange, B. O’Malley, M. Pierik, J. Ummels, B. Tande, J.O. Estanqueiro, A. Matos, M. Gomez, E. Söder, L. Strbac, G. Shakoor, A. Ricardo, J. Smith, J.C. Milligan, M. Ela, E. 2009. Design and Operation of Power Systems with Large Amounts of Wind Power. IEA WIND Task 25, Phase One 2006–2008. (Vuorimiehentie, Finland, VTT).
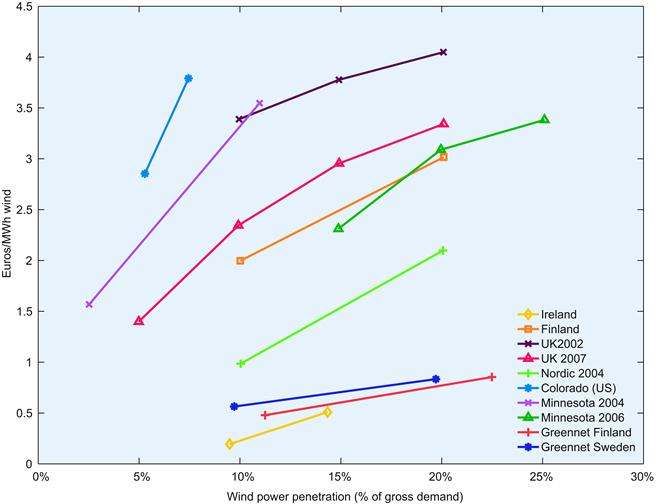
Chart 4.17 Estimates of balancing costs for wind power. Balancing cost is the additional cost associated with adding a generator to the system in order to maintain the target reliability level. Source: Data from Holttinen, H. Meibom, P. Orths, A. van Hulle, F. Lange, B. O’Malley, M. Pierik, J. Ummels, B. Tande, J.O. Estanqueiro, A. Matos, M. Gomez, E. Söder, L. Strbac, G. Shakoor, A. Ricardo, J. Smith, J.C. Milligan, M. Ela, E. 2009. Design and Operation of Power Systems with Large Amounts of Wind Power. IEA WIND Task 25, Phase One 2006–2008. (Vuorimiehentie, Finland, VTT).
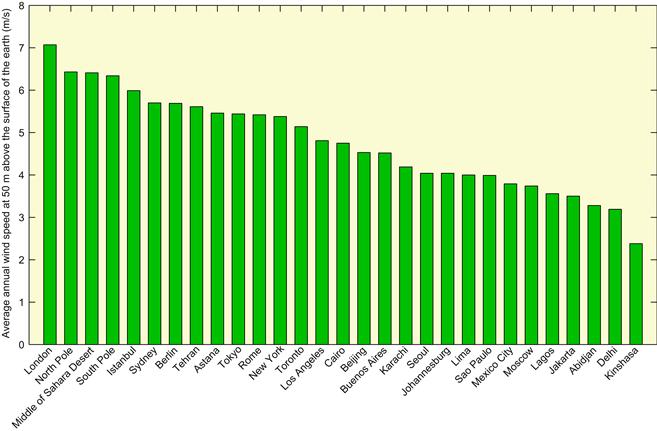
Chart 4.18 Annual average wind speed at 50 meters above the surface of the earth for selected cities and locations (10-year annual average, July 1983 - June 1993). Source: Data from United States National Aeronautics and Space Administration (NASA), Surface meteorology and Solar Energy database, <http://eosweb.larc.nasa.gov/sse/>.
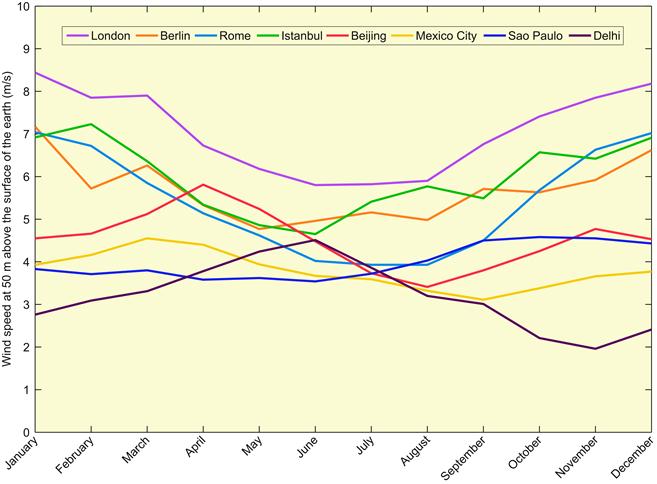
Chart 4.19 Monthly average wind speed at 50 m above the surface of the earth for selected cities (10-year annual average, July 1983 - June 1993). Source: Data from United States National Aeronautics and Space Administration (NASA), Surface meteorology and Solar Energy database, <http://eosweb.larc.nasa.gov/sse/>.
Tables
Table 4.1
Net generation of electricity by wind, top 20 nations, 1990-2010 (billion kWh)
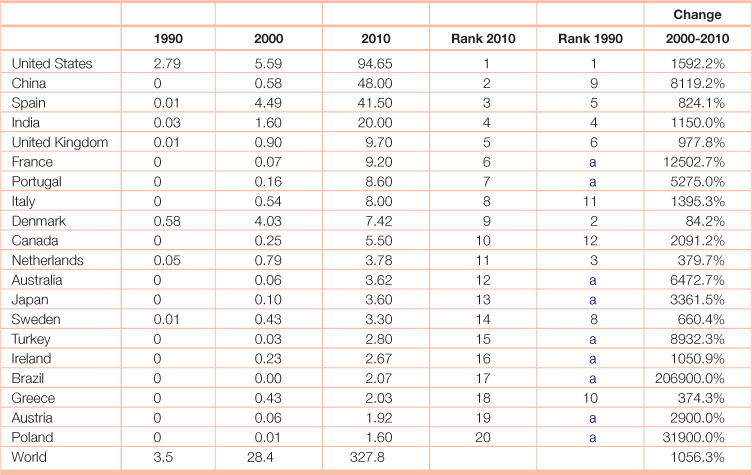
aNo gneration reported in 1990.
Source: United States Department of Energy, Energy Information Administration, International Energy Statistics, <http://www.eia.gov/countries/data.cfm>.
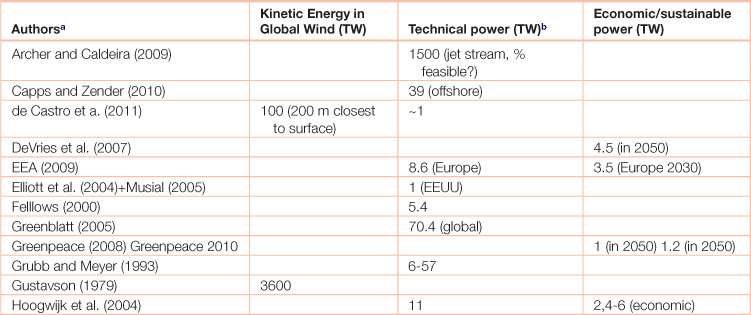
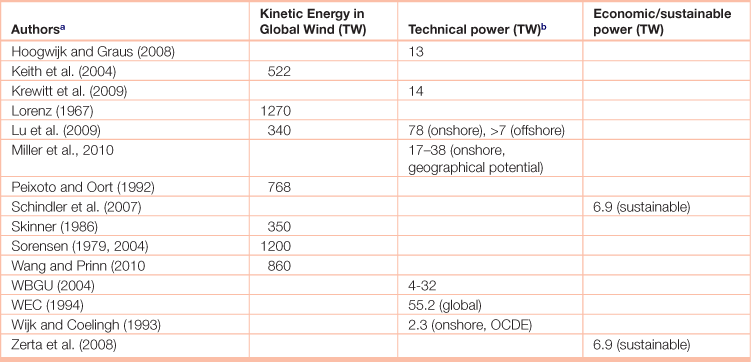
Table 4.2
Estimates of global wind power
C.L. Archer, K. Caldeira, Global assessment of high-altitude wind power, Energies, 2 (2009), pp. 307–319.
S.B. Capps, C.S. Zender, The estimated global ocean wind power potential from QuickScat observations, accounting for turbine characteristics and sitting, Journal of Geophysical Research, 115 (D01101) (2010), p. 13.
Carlos de Castro, Margarita Mediavilla, Luis Javier Miguel, Fernando Frechoso, Global wind power potential: Physical and technological limits, Energy Policy, Volume 39, Issue 10, October 2011, Pages 6677-6682.
B.J.M. DeVries et al., Renewable energy sources: their global potential for the first-half of the 21st century at a global level: an integrated approach, Energy Policy, 35 (2007), pp. 2590–2610.
EEA, 2009. Europe’s Onshore and Offshore Wind Energy Potential. An Assessment of Environmental and Economic Constraints. European Environment Agency. EEA Technical Report No. 6/2009.
D. Elliott et al., Wind Resource Base. Encyclopedia of Energy, Elsevier, NY (2004) pp. 465–479.
Fellows, A. (2000). The Potential of Wind Energy to Reduce Carbon Dioxide Emissions. Garrad Hassan and Partners Ltd, Glasgow, Scotland, 146 pp.
Greenblatt J.B., 2005. Wind as a source of energy, now and in the future. InterAcademy Council, Amsterdam, Netherlands October 1, 2005.
Greenpeace, Global Wind Energy Outlook 2008, GWEC, Greenpeace International, DLR and Ecofys (2008).
Greenpeace, Energy revolution: a sustainable world energy outlook, European Renewable Energy Council, Greenpeace (2010).
Grubb, M.J., and N.I. Meyer (1993). Wind energy: Resources, systems and regional strategies. In: Renewable Energy: Sources for Fuels and Electricity. T.B. Johansson, H. Kelly, A.K. Reddy, and R.H. Williams (eds.), Island Press, Washington, DC, USA, pp. 157-212.
M.R. Gustavson, Limits to wind power utilization, Science, 203 (4388) (1979), pp. 13–17.
M. Hoogwijk et al., Assessment of the global and regional geographical, technical and economic potential of onshore wind energy, Energy Economics, 26 (2004), pp. 889–919X.
Hoogwijk, M., and W. Graus (2008). Global Potential of Renewable Energy Sources: A Literature Assessment. Ecofys, Utrecht, The Netherlands, 45 pp.
D.W. Keith et al., The influence of large-scale wind power on global climate, Proceedings of the National Academy of Sciences USA, 101 (16115–16120) (2004), p. 2004.
Krewitt, W., K. Nienhaus, C. Kleßmann, C. Capone, E. Stricker, W. Graus, M. Hoogwijk, N. Supersberger, U. von Winterfeld, and S. Samadi (2009). Role and Potential of Renewable Energy and Energy Efficiency for Global Energy Supply. Climate Change 18/2009, ISSN 1862-4359, Federal Environment Agency, Dessau-Roßlau, Germany, 336 pp.
E. Lorenz, The Nature and Theory of the General Circulation of the Atmosphere, World Meteorological Organization, Geneva (1967)
Lu et al., Global potential for wind-generated electricity, Proceedings of the National Academy of Sciences, 106 (27) (2009), pp. 10933–10938.
L.M. Miller et al., Estimating maximum global land surface wind power extractability and associated climatic consequences, Earth System Dynam. Discussion, 1 (169–189) (2010), p. 2010.
W. Musial, Offshore wind energy potential for the United States, B. Ruth (Ed.), Wind Powering America: Annual State Summit, Evergreen, CO (2005).
J.P. Peixoto, A.H. Oort, Physics of climate, American Institute of Physics, 1 (379–385) (1992), p. 109 1992
J. Schindler et al., Where will the Energy for Hydrogen Production Come From? Status and Alternatives, European Hydrogen Association (2007).
B. Sorensen, Renewable Energy; Academic Press, London, UK (1979); Renewable Energy: Its Physics, Engineering Use, Environment Impacts, Economy and Planning Aspects, Elsevier Academic Press (2004).
C. Wang, R.G. Prinn, Potential climatic impacts and reliability of very large-scale wind farms, Atmospheric Chemistry and Physics, 10 (2010), pp. 2053–2061.
WBGU, H. Graßl, J. Kokott, M. Kulessa, J. Luther, F. Nuscheler, R. Sauerborn, H.J. Schellnhuber, R. Schubert, E.D. Schulze (2004). World in Transition: Towards Sustainable Energy Systems. German Advisory Council on Global Change (WBGU), Earthscan, London, UK and Sterling, VA, USA, 352 pp.
WEC, New Renewable Energy Resources: A Guide to the Future. World Energy Council, Kogan Page Limited, London, UK (1994) 1994
van Wijk, A.J.M., Coelingh, J.P., 1993. Wind Power Potential in the OECD Countries. December 1993. Report commissioned by the Energy Research Center, The Netherlands (ECN).
M. Zerta et al., Alternative world energy outlook (AWEO) and the role of hydrogen in a changing energy landscape, International Journal of Hydrogen Energy, 33 (12) (2008), pp. 3021–3025.
bMost technical powers are primary, not electrical.
Source: Adapted from Carlos de Castro, Margarita Mediavilla, Luis Javier Miguel, Fernando Frechoso, Global wind power potential: Physical and technological limits, Energy Policy, Volume 39, Issue 10, October 2011, Pages 6677-6682; Moomaw, W., F. Yamba, M. Kamimoto, L. Maurice, J. Nyboer, K. Urama, T. Weir, 2011: Introduction. In IPCC Special Report on Renewable Energy Sources and Climate Change Mitigation [O. Edenhofer, R. Pichs-Madruga, Y. Sokona, K. Seyboth, P. Matschoss, S. Kadner, T. Zwickel, P. Eickemeier, G. Hansen, S. Schlömer, C.von Stechow (eds)], Cambridge University Press, Cambridge, United Kingdom and New York, NY, USA.
Table 4.3
Largest wind farms in the world, 2012
| Wind farm name | Capacity (MW) | Country |
| ONSHORE | ||
| Roscoe Wind Farm | 781.5 | USA |
| Horse Hollow Wind Energy Center | 735.5 | USA |
| Capricorn Ridge Wind Farm | 662.5 | USA |
| Fowler Ridge Wind Farm | 599.8 | USA |
| Sweetwater Wind Farm | 585.3 | USA |
| Buffalo Gap Wind Farm | 523.3 | USA |
| Dabancheng Wind Farm | 500 | China |
| Meadow Lake Wind Farm | 500 | USA |
| Panther Creek Wind Farm | 458 | USA |
| Biglow Canyon Wind Farm | 450 | USA |
| OFFSHORE | ||
| Wanley | 367 | UK |
| Thanet | 300 | UK |
| Horns Rev II | 209 | Denmark |
| Rϕdsand II | 207 | Denmark |
| Lynn and Inner Dowsing | 194 | UK |
| Robin Rigg (Solway Firth) | 180 | UK |
| Gunfleet Sands | 172 | UK |
| Nysted (Rϕdsand I) | 166 | Denmark |
| Bligh Bank (Belwind) | 165 | Belgium |
| Horns Rev I | 16 | Denmark |
Source: Adapted from Leung, Dennis Y.C., Yuan Yang. 2012. Wind energy development and its environmental impact: A review, Renewable and Sustainable Energy Reviews, Volume 16, Issue 1, Pages 1031-1039.
Table 4.4
Cumulative installed wind turbine capacity (MW)
Source: BP, Statistical Review of World Energy 2011; European Wind Energy Association.
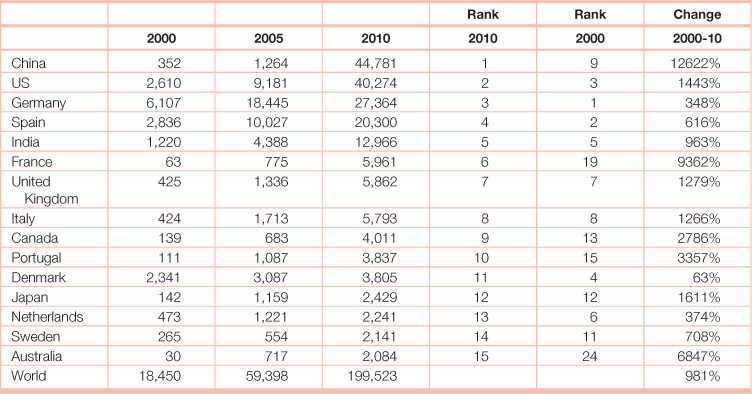
Table 4.5
Annual additions to installed wind turbine capacity (MW)
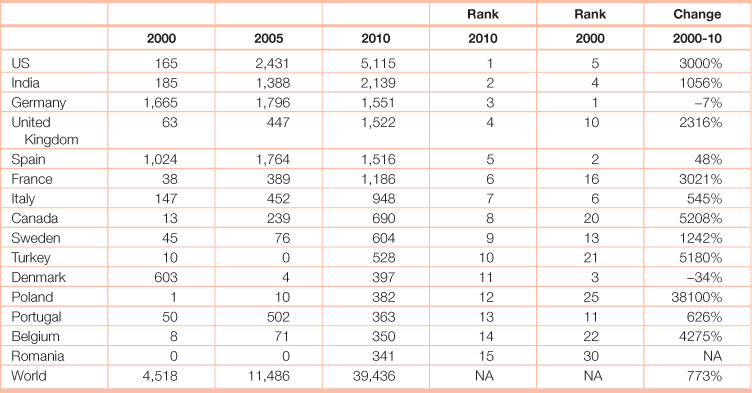
Source: BP, Statistical Review of World Energy 2011; European Wind Energy Association.
Table 4.6
Annual electricity production from a wind turbine based on the Weibull probability distribution
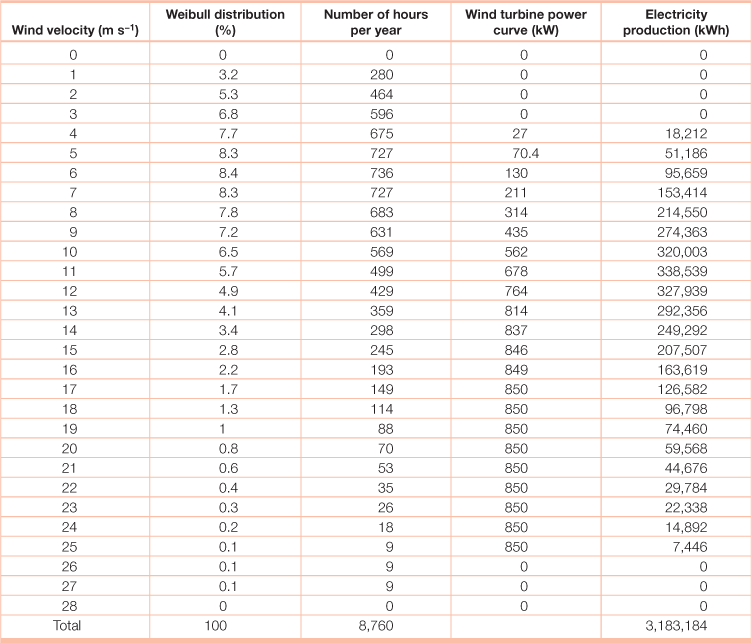
Source: Adapted from Katsaprakakis, D. Al and D.G. Christakis, 2.07 - Wind Parks Design, Including Representative Case Studies, In: Editor-in-Chief: Ali Sayigh, Editor(s)-in-Chief, Comprehensive Renewable Energy, (Oxford, Elsevier), Pages 169-223.
Table 4.7
Global technical potential for onshore wind energy by region
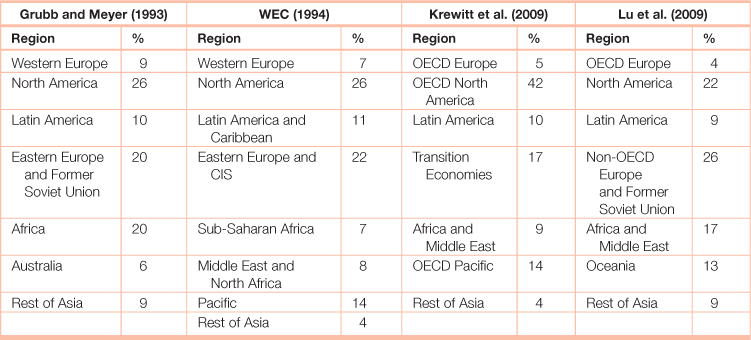
Regions shown in the table are defined by each individual study. Some regions have been combined to improve comparability among the four studies.
aCited work:
Grubb, M.J., and N.I. Meyer (1993). Wind energy: Resources, systems and regional strategies. In: Renewable Energy: Sources for Fuels and Electricity. T.B. Johansson, H. Kelly, A.K. Reddy, and R.H. Williams (eds.), Island Press, Washington, DC, USA, pp. 157-212.
Krewitt, W., K. Nienhaus, C. Kleßmann, C. Capone, E. Stricker, W. Graus, M. Hoogwijk, N. Supersberger, U. von Winterfeld, and S. Samadi (2009). Role and Potential of Renewable Energy and Energy Effi ciency for Global Energy Supply. Climate Change 18/2009, ISSN 1862-4359, Federal Environment Agency, Dessau-Roßlau, Germany, 336 pp.
Lu et al., Global potential for wind-generated electricity, Proceedings of the National Academy of Sciences, 106 (27) (2009), pp. 10933–10938.
WEC, New Renewable Energy Resources: A Guide to the Future. World Energy Council, Kogan Page Limited, London, UK (1994) 1994
Source: Adapted from Moomaw, W., F. Yamba, M. Kamimoto, L. Maurice, J. Nyboer, K. Urama, T. Weir, 2011: Introduction. In IPCC Special Report on Renewable Energy Sources and Climate Change Mitigation [O. Edenhofer, R. Pichs-Madruga, Y. Sokona, K. Seyboth, P. Matschoss, S. Kadner, T. Zwickel, P. Eickemeier, G. Hansen, S. Schlömer, C.von Stechow (eds)], Cambridge University Press, Cambridge, United Kingdom and New York, NY, USA.
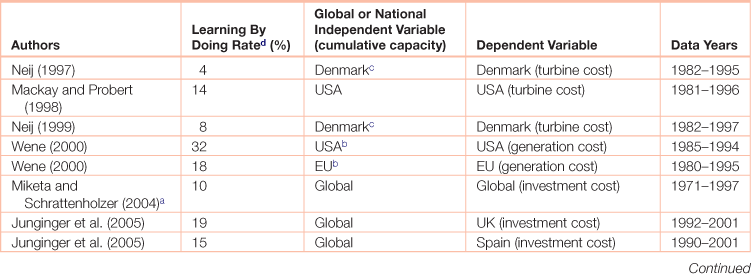
Table 4.8
Learning curve data for onshore wind energy
Cited work:
Neij, L. (1997). Use of experience curves to analyse the prospects for diffusion and adoption of renewable energy technology. Energy Policy, 25, pp. 1099-1107.
Neij, L. (1999). Cost dynamics of wind power. Energy, 24, pp. 375-389.
Neij, L. (2008). Cost development of future technologies for power generation – A study based on experience curves and complementary bottom-up assessments. Energy Policy, 36, pp. 2200-2211.
Mackay, R.M., and S.D. Probert (1998). Likely market-penetrations of renewable energy technologies. Applied Energy, 59, pp. 1-38.
Wene, C.O. (2000). Experience curves for energy technology policy. International Energy Agency and Organisation for Economic Co-operation and Development, Paris, France, 127 pp.
Miketa, A., and L. Schrattenholzer (2004). Experiments with a methodology to model the role of R&D expenditures in energy technology learning processes; first results. Energy Policy, 32, pp. 1679-1692.
Junginger, M., A. Faaij, and W.C. Turkenburg (2005). Global experience curves for wind farms. Energy Policy, 33, pp. 133-150.
Klaassen, G., A. Miketa, K. Larsen, and T. Sundqvist (2005). The impact of R&D on innovation for wind energy in Denmark, Germany and the United Kingdom. Ecological Economics, 54, pp. 227-240.
Kobos, P.H., J.D. Erickson, and T.E. Drennen (2006). Technological learning and renewable energy costs: implications for US renewable energy policy. Energy Policy, 34, pp. 1645-1658.
Jamasb, T. (2007). Technical change theory and learning curves: patterns of progress in electricity generation technologies. The Energy Journal, 28, pp. 51–71.
Söderholm, P., and T. Sundqvist (2007). Empirical challenges in the use of learning curves for assessing the economic prospects of renewable energy technologies. Renewable Energy, 32, pp. 2559-2578.
Kahouli-Brahmi, S. (2009). Testing for the presence of some features of increasing returns to adoption factors in energy system dynamics: An analysis via the learning curve approach. Ecological Economics, 68, pp. 1195-1212.
Nemet, G.F. (2009). Interim monitoring of cost dynamics for publicly supported energy technologies. Energy Policy, 37, pp. 825-835.
Wiser, R., and M. Bolinger (2010). 2009 Wind Technologies Market Report. US Department of Energy, Washington, DC, USA, 88 pp.
aTwo-factor learning curve that also includes R&;D; others are one-factor learning curves.
bIndependent variable is cumulative production of electricity.
cCumulative turbine production used as independent variable; others use cumulative installations.
dThe rate at which unit cost declines with each doubling of cumulative output.
Source: Adapted from Moomaw, W., F. Yamba, M. Kamimoto, L. Maurice, J. Nyboer, K. Urama, T. Weir, 2011: Introduction. In IPCC Special Report on Renewable Energy Sources and Climate Change Mitigation [O. Edenhofer, R. Pichs-Madruga, Y. Sokona, K. Seyboth, P. Matschoss, S. Kadner, T. Zwickel, P. Eickemeier, G. Hansen, S. Schlömer, C.von Stechow (eds)], Cambridge University Press, Cambridge, United Kingdom and New York, NY, USA.
Table 4.9
Twenty five largest offshore wind farms in 2011, rated by nameplate capacity
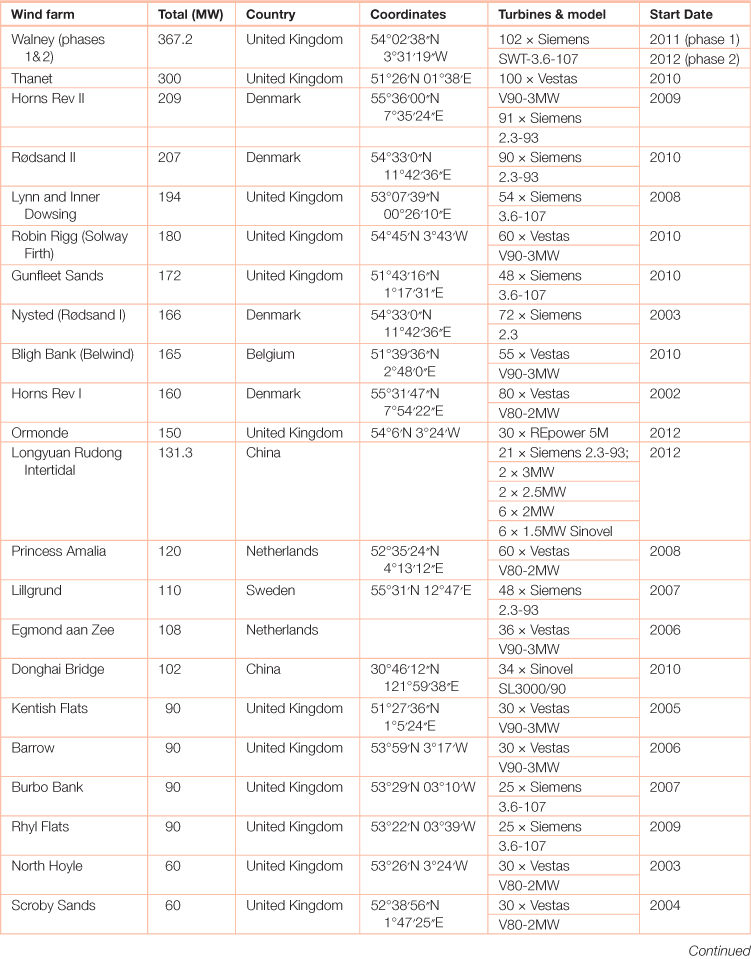
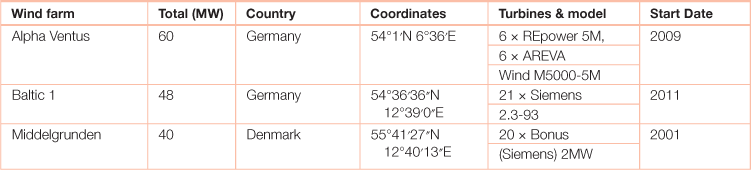
Source: European Wind Energy Association (EWEA), Wind in power: 2011 European statistics; Wikipedia, List of offshore wind farms, <http://en.wikipedia.org/wiki/List_of_offshore_wind_farms>, accessed 15 May 2012.
Table 4.10
Characteristics of offshore wind farms (OWF) with a rated power above 25 MW
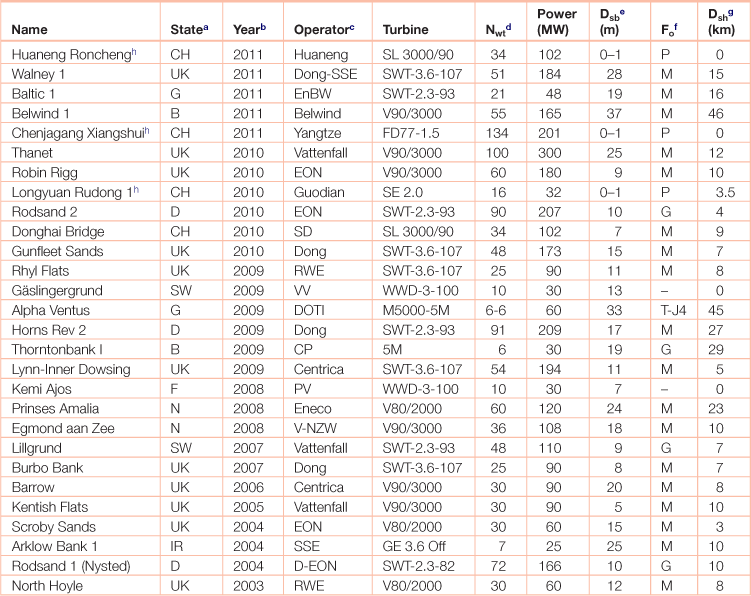
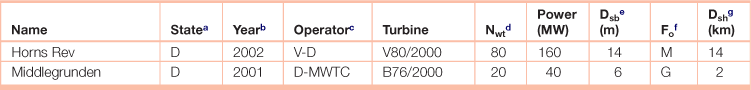
aB stands for Belgium, CH stands for China, D stands for Denmark, F stands for Finland, G stands for Germany, IR stands for Ireland, N stands for the Netherlands, SW stands for Sweden and UK stands for the United Kingdom.
bYear in which the OWF was commissioned and fully connected to the grid.
cCP stands for C-Power, DOTI for Deutsche Offshore-Testfeld und Infrastruktur GmbH, D for Dong Energy, EnBW for Energie Baden-Württemberg AG, MWTC for Middlegrunden Wind Turbine Cooperative, NZW for Nordzeewind, PV for Pohjolan Voima, RWE for RWE Npower Renewables, SSE stands for Scottish and Southern Energy, SD stands for Shanghai Donghai Wind Power Generation Company Ltd., V for Vattenfall and VV for Vindpark Vänern.
dNumber of wind turbines in the OWF.
eMaximum water depth to the lowest astronomical tide within the OWF area.
fFoundation type, where P stands for high-rise pile cap foundations, G stands for gravity based foundations, M for monopiles, T for tripods and J4 for four legged jacket.
gDistance to the nearest shore, which does not necessarily correspond to the length of the submarine cable.
hChinese OWPPs projects do not have dedicated web pages as is usual in Europe. These installations seem to be in intertidal areas, only partially covered at high tides, so it is not clear if they should be more appropriately classified as near-shore wind farms.
Source: Adapted from Madariaga, A., I. Martínez de Alegría, J.L. Martín, P. Eguía, S. Ceballos. 2012. Current facts about offshore wind farms, Renewable and Sustainable Energy Reviews, Volume 16, Issue 5, Pages 3105-3116.
Table 4.11
Capital costs of several offshore wind farms
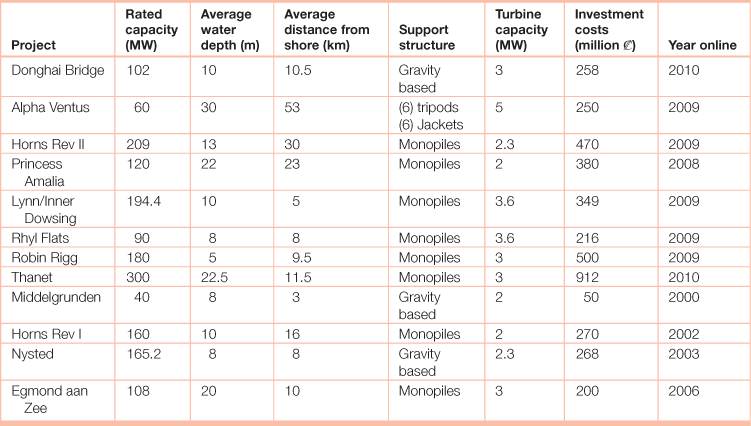
Source: Adapted from Kapsali, M. and J.K. Kaldellis. 2012. 2.14 - Offshore Wind Power Basics, In: Editor-in-Chief: Ali Sayigh, Editor(s)-in-Chief, Comprehensive Renewable Energy, (Oxford, Elsevier), Pages 431-468.
Table 4.12
Collector and transmission network characteristics of operating offshore wind farms (OWF) with rated power above 25 MW
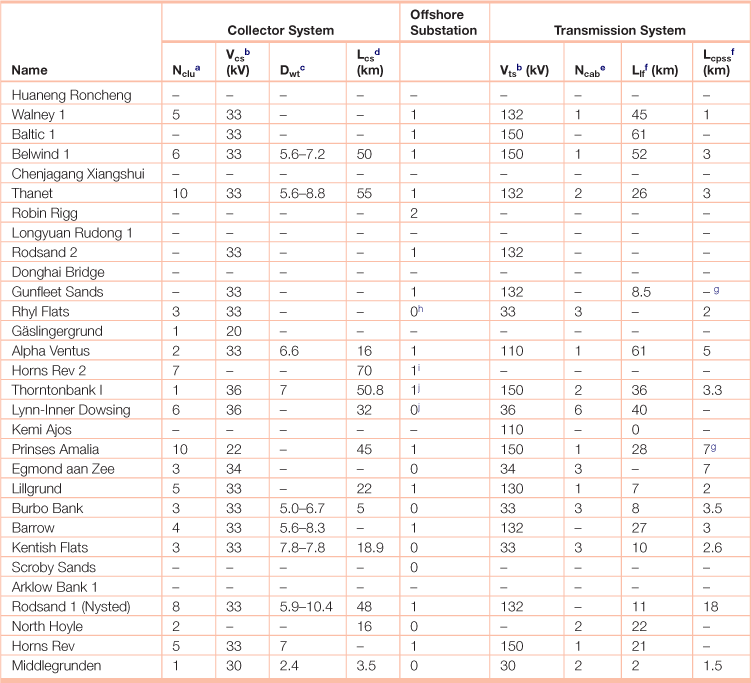
aNumber of clusters of turbines according to their electrical arrangement, not their geometrical disposition.
bVcs and Vts stand for the voltages of the CS (also known as internal grid) and the TS, respectively.
cSeparation among the turbines factorized by the turbine diameter. When two values are given, they account for the geometrical distances between turbines in a row and between rows, respectively.
dTotal length of the MVAC collector system of the farm.
eNumber of cables for the TS. Three phase high voltage alternating current (HVAC) submarine cable with optic fibre for communications is the general case.
fThe length of the TS is the length of the submarine cable (Llf), in most cases between the OS and the landfall, plus the length of the onshore transmission line (Lcpss), between the landfall and the CPS.
gA three phase submarine cable is connected in the landfall to three single phase and communication cables.
hData corresponding to ongoing second and third phases of Thorntonbank OWPP.
iIt is the first OS to offer accommodation facilities for O&M staff and visitors.
jWhen there is no OS, each cluster of OWTs has its own transmission cable, at least as far as the landfall, the voltages of the collection and transmission systems being the same.
Source: Adapted from Madariaga, A., I. Martínez de Alegría, J.L. Martín, P. Eguía, S. Ceballos. 2012. Current facts about offshore wind farms, Renewable and Sustainable Energy Reviews, Volume 16, Issue 5, Pages 3105-3116.
Table 4.13
Nominal power versus rotor swept area for wind turbines
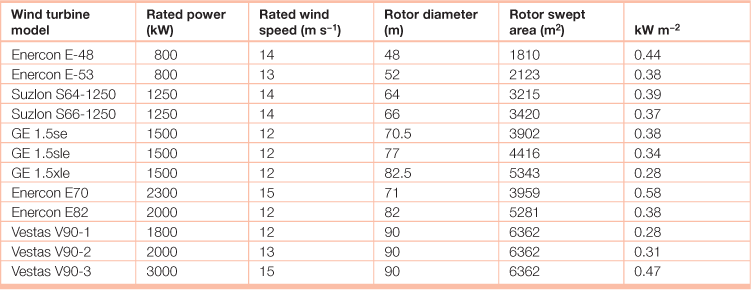
Source: Adapted from Wizelius, T. 2012. 2.13 - Design and Implementation of a Wind Power Project, In: Editor-in-Chief: Ali Sayigh, Editor(s)-in-Chief, Comprehensive Renewable Energy, (Oxford, Elsevier), Pages 391-430.
Table 4.14
International Electrotechnical Commission classes for wind turbines
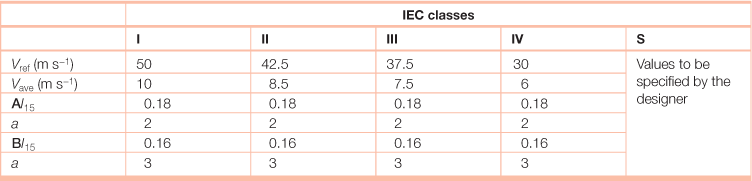
The values apply at hub height. ‘A’ designates higher turbulence; ‘B’ designates lower turbulence; I15 is the turbulence intensity at 15 m s−1; a is the slope parameter in the normal turbulence model equation.
Source: International Electrotechnical Commission.
Table 4.15
Material composition of wind turbines
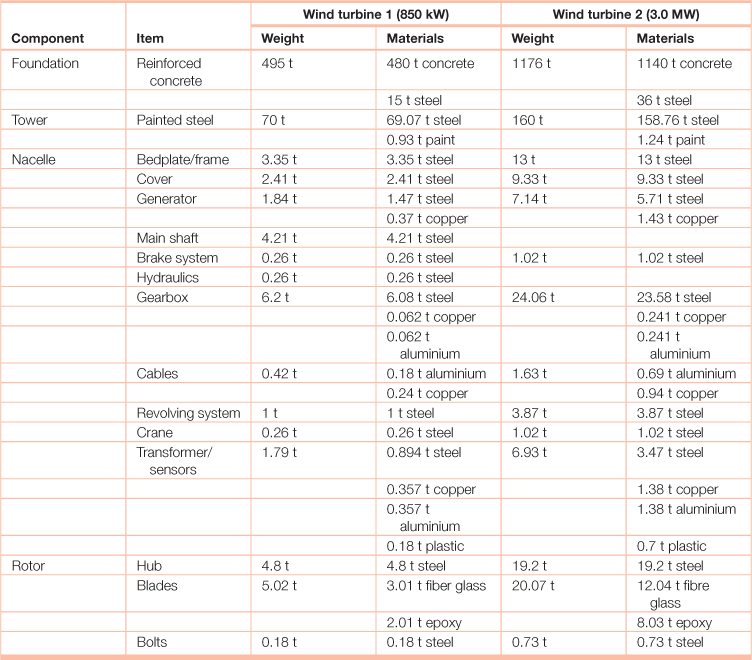
Source: Adapted from Crawford, R.H. 2009. Life cycle energy and greenhouse emissions analysis of wind turbines and the effect of size on energy yield, Renewable and Sustainable Energy Reviews, Volume 13, Issue 9, December 2009, Pages 2653-2660.
Table 4.16
Main categories of generator/converter pairs in wind turbines
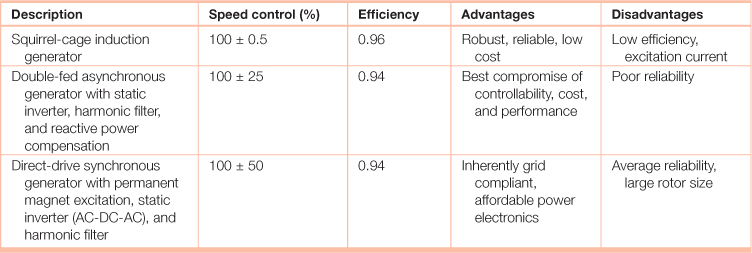
Adapted from Stavrakakis,G.S. 2012. 2.10 - Electrical Parts of Wind Turbines, In: Editor-in-Chief: Ali Sayigh, Editor(s)-in-Chief, Comprehensive Renewable Energy, (Oxford, Elsevier), Pages 269-328.
Table 4.17
Technical specifications for the Vestas 7.0 and 2.0 megawatt (MW) wind turbines
| V164-7.0 MW (offshore) | V80-2.0 MW GridStreamer (onshore) | |
| Power Regulation | pitch regulated with variable speed | pitch regulated with variable speed |
| Operating Data | ||
| Rated power | 7.0 MW | 2,000 kW |
| Cut-in wind speed | 4 m/s | 4.0 m/s |
| Operational temperature range | −10° C to 25° C | −20° C to 40° C |
| Rotor | ||
| Rotor diameter | 164 m | 80m |
| Swept area | 21,124 m2 | 5,027 m2 |
| Electrical | ||
| Frequency | 50 Hz | 50/60 Hz |
| Converter type | Full Scale converter | full scale converter |
| Generator type | Permanent magnet | permanent magnet generator |
| Tower | ||
| Type | Tubular steel tower | Tubular steel tower |
| Hub heights | Site specific | 65 m and 80 m |
| Blade Dimensions | ||
| Length | 80 m | 39 m |
| Max. Chord | 5.4 m | 3.4 m |
| Nacelle Dimensions (incl. hub and coolers) | ||
| Length | 24 m | 10.4 m |
| Width | 12 m | 3.4 m |
Source: Vestas Wind Systems A/S.
Table 4.18
Classes of wind power density at 10 m and 50 m(a) used by the U.S. National Renewable Energy Laboratory
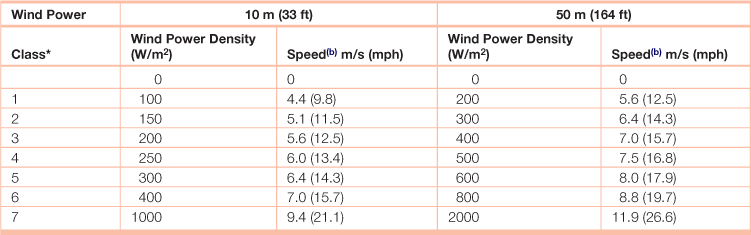
aVertical extrapolation of wind speed based on the 1/7 power law.
bMean wind speed is based on Rayleigh speed distribution of equivalent mean wind power density. Wind speed is for standard sea-level conditions. To maintain the same power density, speed increases 3%/1000 m (5%/5000 ft) elevation.
Table 4.19
The Hellman exponent in wind speed estimation
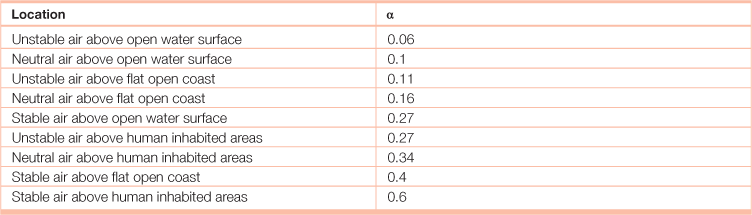
The Hellman exponent (α) is used to estimate the change in wind speed with altitude according to:
![]()
where vw(h)=wind velocity at height h (m/s); v10 = wind velocity at height 10 meters (m/s). The coefficient depends upon the coastal location and the shape of the terrain on the ground, and the stability of the air.
Source: Adapted from “Renewable energy: technology, economics, and environment” by Martin Kaltschmitt, Wolfgang Streicher, Andreas Wiese, (Springer, 2007).
Table 4.20
Power per unit area available from steady wind (air density = 1.225 kg/m3)
| Wind Speed (m/s) | Power/area (W/m2) |
| 0 | 0 |
| 5 | 80 |
| 10 | 610 |
| 15 | 2070 |
| 20 | 4900 |
| 25 | 9560 |
| 30 | 16,550 |
Source: National Renewable Energy Laboratory.
Table 4.21
Number (and percent with respect to each region) of U.S. weather stations falling into each wind power class at 80 m
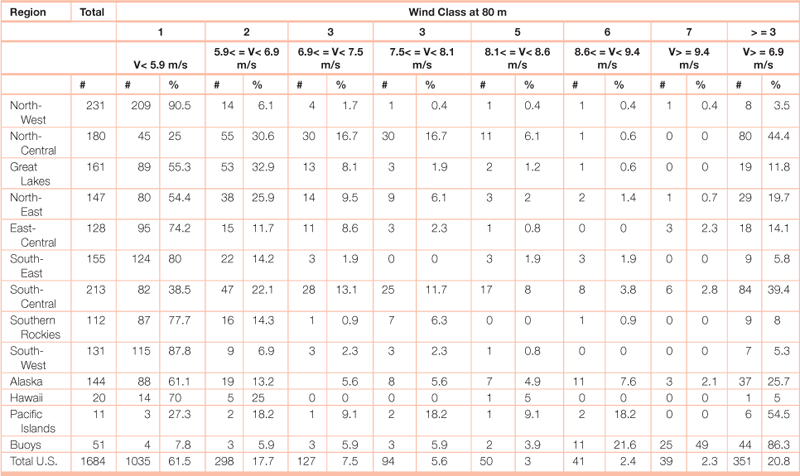
V = wind velocity at 80 meters measured in meters per second.
Source: Adapted from Archer, Cristina L. and Mark Z. Jacobson, The Spatial and Temporal Distributions of U.S. Winds and Windpower at 80 m Derived from Measurements, Stanford University, <http://www.stanford.edu/group/efmh/winds/us_winds.html>.
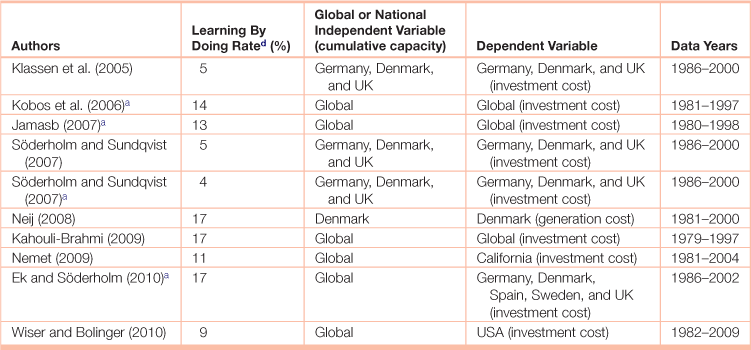
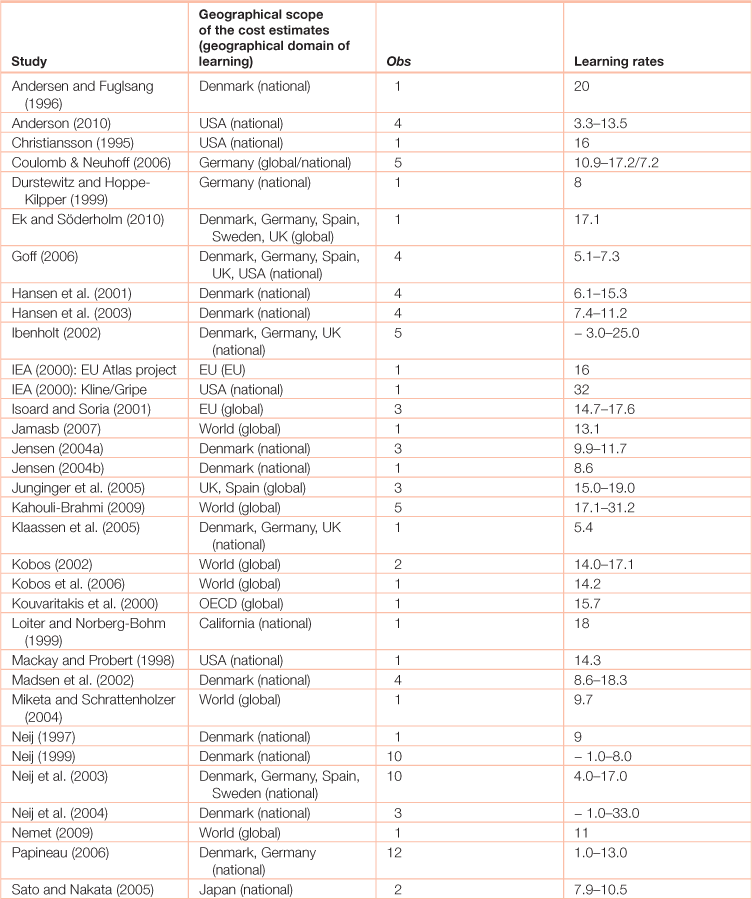
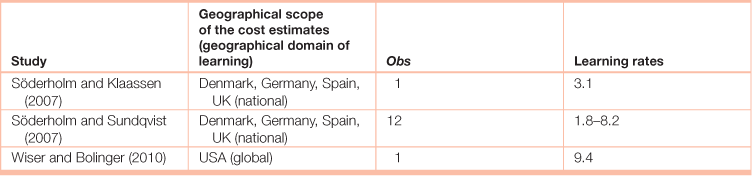
Table 4.22
Estimates of wind power learning ratesa
Work cited:
Andersen, P.D., Fuglsang, P., 1996. Vurdering af udviklingsforløb for vindkraftteknologien (Estimation of the Future Advances of the Wind Power Technology). Research Centre Risø, Roskilde, Denmark. Risø-R-829 (D).
Anderson, J., 2010. Learning-by-doing in the US Wind Energy Industry. Paper presented at the Freeman Spogli Institute for International Studies, Stanford University, USA. 24 February.
Christiansson, L., 1995. Diffusion and Learning Curves of Renewable Energy Technologies.
IIASA Working Paper WP-95-126, International Institute for Applied Systems Analysis, Laxemburg, Austria.
Coulomb, L., Neuhoff, K., 2006. Learning Curves and Changing Product Attributes: The Case of Wind Turbines. Cambridge Working Papers in Economics 0618, University of Cambridge, UK.
Durstewitz, M., Hoppe-Kilpper, M., 1999. Wind Energy Experience Curve from German “250 MW Wind”-Programme. IEA International Workshop on Experience Curves for Policy Making — The Case of Energy Technologies, Stuttgart, Germany. May 1999.
Ek, K., Söderholm, P., 2010. Technology learning in the presence of public R&D: the case of European wind power. Ecological Economics 69 (12), 2356–2362.
Goff, C. (2006). Wind Energy Cost Reductions: A Learning Curve Analysis with Evidence from the United States. Germany. Denmark. Spain. and the United Kingdom, Master’s Thesis, Graduate School of Arts and Sciences of Georgetown University, Washington, DC.
Hansen, J.D., Jensen, C., Madsen, E.S., 2001. Green Subsidies and Learning-by-doing in the Windmill Industry. Discussion Paper 2001–06, University of Copenhagen, Department of Economics, Denmark.
Hansen, J.D., Jensen, C., Madsen, E.S., 2003. The establishment of the Danish windmill industry — was it worthwhile? Review of the World Economics 139 (2), 324–347.
Ibenholt, K., 2002. Explaining learning curves for wind power. Energy Policy 30 (13), 1181–1189.
IEA, 2000. Experience Curves for Energy Technology Policy. International Energy Agency (IEA), Paris.
Isoard, S., Soria, A., 2001. Technical change dynamics: evidence from the emerging renewable energy technologies. Energy Economics 23, 619–636.
Jamasb, T., 2007. Technical change theory and learning curves: patterns of progress in energy technologies. The Energy Journal 28 (3), 51–72.
Jensen, S.G., 2004a. Describing technological development with quantitative models. Energy & Environment 15 (2), 187–200.
Jensen, S.G., 2004b. Quantitative analysis of technological development within renewable energy technologies. International Journal of Energy Technology and Policy 2 (4), 335–353.
Junginger, M. (2005). Learning in Renewable Energy Technology Development, Ph.D. Thesis, Copernicus Institute, Utrecht University, The Netherlands.
Junginger, M., Faaij, A., Turkenburg, W.C., 2005. Global experience curves for wind farms. Energy Policy 33 (2), 133–150.
Junginger, M., van Sark, W., Faaij, A. (Eds.), 2010. Technological Learning in the Energy.
Sector: Lessons for Policy. Industry and Science. Edward Elgar, Cheltenham.
Kahouli-Brahmi, S., 2009. Testing for the presence of some features of increasing returns to adoption factors in energy system dynamics: an analysis via the learning curve approach. Ecological Economics 68 (4), 1195–1212.
Klaassen, G., Miketa, A., Larsen, K., Sundqvist, T., 2005. The impact of R&D on innovation for wind energy in Denmark, Germany and the United Kingdom. Ecological Economics 54 (2–3), 227–240.
Kobos, P.H., 2002. The Empirics and Implications of Technological Learning for Renewable Energy Technology Cost Forecasting. Proceedings of the 22nd Annual.
North American Conference of the USAEE/IAEE, Vancouver, B.C., Canada. October 2002.
Kobos, P.H., Erickson, J.D., Drennen, T.E., 2006. Technological learning and renewable energy costs: implications for US renewable energy Policy. Energy Policy 34 (13), 1645–1658.
Kouvaritakis, N., Soria, A., Isoard, S., 2000. Modelling energy technology dynamics: methodology for adaptive expectations models with learning by doing and learning by searching. International Journal of Global Energy Issues 14 (1–4), 104–115.
Loiter, J.M., Norberg-Bohm, V., 1999. Technology policy and renewable energy: public roles in the development of new energy technologies. Energy Policy 27 (2), 85–97.
Mackay, R.M., Probert, S.D., 1998. Likely market-penetrations of renewable-energy technologies. Applied Energy 59 (1), 1–38.
Madsen, E.S., Jensen, C., Hansen, J.D., 2002. Scale in Technology and Learning-by-doing in the Windmill Industry. Working Papers, Department of Economics, Aarhus, School of Buisness, University of Aarhus, No. 02–2. January 1, 2002. Miketa, A., Schrattenholzer, L., 2004. Experiments with a methodology to model the role of R&D expenditures in energy technology learning processes; first results.
Energy Policy 32 (15), 1679–1692.Neij, L., 1997. Use of experience curves to analyse the prospects for diffusion and adoption of renewable energy technology. Energy Policy 23 (13), 1099–1107.
Neij, L., 1999. Cost dynamics of wind power. Energy 24 (5), 375–389.
Neij, L., Andersen, P.D., Dustewitz, M., Helby, P., Hoppe-Kilpper, M., Morthorst, P.E., 2003. Experience Curves: A Tool for Energy Policy Assessment. Research Report funded in part by the European Commission within the Fifth Framework: Energy.
Environment and Sustainable Development (Contract ENG1-CT2000-00116).
Neij, L., Andersen, P.D., Durstewitz, M., 2004. Experience curves for wind power.
International Journal of Energy Technology and Policy 2 (1–2), 15–32.
Nemet, G.F., 2009. Interim monitoring of cost dynamics for publicly supported energy technologies. Energy Policy 37 (3), 825–835.
Papineau, M., 2006. An economic perspective on experience curves and dynamic economies in renewable energy technologies. Energy Policy 34 (4), 422–432.
Sato, T., Nakata, T., 2005. Learning Curve of Wind Power Generation in Japan.Proceedings of the 28th Annual IAEE International Conference, Taipei, Taiwan. June 2005.
Söderholm, P., Klaassen, G., 2007. Wind power in Europe: a simultaneous innovation diffusion model. Environmental and Resource Economics 36 (2), 163–190.
Söderholm, P., Sundqvist, T., 2007. The empirical challenges of measuring technology learning in the renewable energy sector. Renewable Energy 32 (15), 2559–2578.
Stanley, V.K., 2001. Wheat from chaff: meta-analysis as quantitative literature review.
Wiser, R.H., Bolinger, M., 2010. 2009 Wind Technologies Market Report. US Department of Energy, Washington, DC.
aThe percentage decrease in wind power cost for each doubling of cumulative capacity or production.
Source: Adapted from Lindman, Åsa, Patrik Söderholm. 2012. Wind power learning rates: A conceptual review and meta-analysis, Energy Economics, Volume 34, Issue 3, Pages 754-761.