5.1DID WE GET THERE?
The fifth step for the organization is to measure how it is performing with regard to the implementation of service management (see Figure 0.1).
5.1.1Establishing an effective service measurement framework
An organization needs to capture and report only those metrics that will be meaningful and actionable. A deliberate relationship needs to be established between business outcomes and key performance indicators (KPIs) for service management. Three golden rules should be kept in mind when establishing a metrics framework:
- You cannot manage what you cannot control
- You cannot control what you cannot measure
- You cannot measure what you cannot define.
5.1.1.1 ISO/IEC 20000
The ISO/IEC 20000 standard provides a good starting point for establishing service metrics and reporting. The service reporting process within the standard provides the following minimal requirements that can assist an organization in establishing its metrics and reporting framework.
The description of each service report, including its identity, purpose, audience, frequency and details of the data source(s), shall be documented and agreed by the service provider and interested parties.
Service reports shall be produced for services using information from the delivery of services and the service management system (SMS) activities, including service management processes. According to the SMS requirements of ISO/IEC 20000-1:2011 Part 1, service reporting shall include at least:
- Performance against service targets
- Relevant information about significant events, including at least major incidents, deployment of new or changed services, and the service continuity plan being invoked
- Workload characteristics, including volumes and periodic changes in workload
- Detected non-conformities against the requirements in this part of ISO/IEC 20000, the SMS requirements or the service requirements and their identified causes
- Trend information
- Customer satisfaction measurements, service complaints and results of the analysis of satisfaction measurements and complaints.
The organization shall make decisions and take actions based on the findings in service reports. The agreed actions shall be communicated to interested parties.
ITIL also provides great guidance on establishing a service measurement framework. The following steps, taken from ITIL Continual Service Improvement, will assist in building an effective service measurement framework:
- Define what success looks like
- Building the framework and choosing measures:
- Ask what needs to be measured that will provide the organization with actionable and useful information to make the right strategic, tactical and/or operational decisions
- Ask what measures will provide the organization with the data and information it needs
- Establish targets for all measures through the use of service level agreements (SLAs) or service level targets that have been agreed internally by the business and IT
- Critical elements of a service measurement framework should be:
- Integrated into business planning
- Focused on both IT and business goals and objectives
- Cost-effective
- Balanced in approach on what is measured
- Able to withstand change
- Performance measures should be:
- Timely
- Accurate and reliable
- Well-defined, specific and clear
- Relevant to meeting the objectives
- Free from creating a negative behaviour
- Supportive in leading to improvement opportunities
- Defined roles and responsibilities:
- Who defines the measures and targets?
- Who monitors and measures?
- Who gathers the data?
- Who processes and analyses the data?
- Who prepares the report?
- Who presents the report?
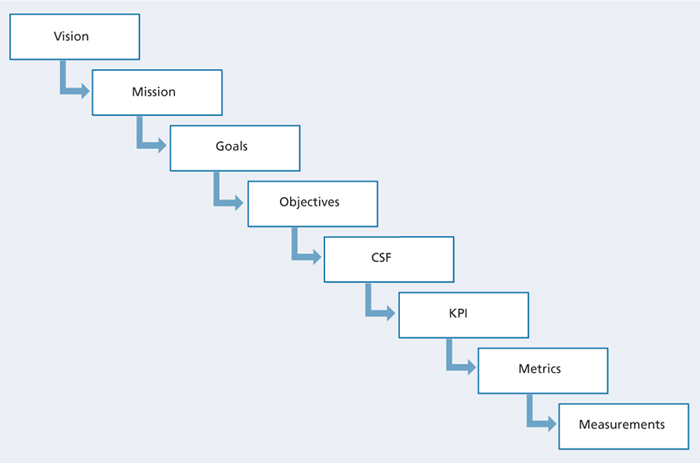
When establishing an effective metrics framework we must always remember to make sure the metrics support the vision, mission, goals and objectives of the organization. Figure 5.1, taken from ITIL Continual Service Improvement, provides a simple and effective depiction of how the integration of metrics supports the organization’s vision, mission, goals and objectives.
Let us return to our check-in business service and future capabilities example from Chapter 3, as depicted in Table 3.2. We will examine each of the elements within Figure 5.1 in the context of the check-in business service.
5.1.2Vision
A vision statement paints a picture of the desired future state, providing guidance and inspiration to an organization on what it wants to achieve in the long term.
Example: ‘To empower customers to purchase and experience hotel services at any time, in any place and from any device.’
5.1.3Mission
A mission statement defines the current state of the organization and usually has a shorter-term focus. It answers the following three questions:
- What does the organization do?
- Who does the organization do it for?
- How does the organization do it?
Example: ‘Our mission is to provide the preferred hotel destination for our guests by delivering a stellar guest experience through outstanding value and innovation.’
5.1.4Goals
Goals tend to be broader, more general and more abstract than the mission statement.
Example: ‘Our goal is to improve the customer online experience and generate additional online hotel bookings.’
Objectives are narrow, precise, tangible and concrete. They can also be validated.
Example: ‘Our objective is to increase online hotel bookings by 20% for North America for 2014.’
5.1.6Critical success factors
Critical success factors (CSFs) determine the success or failure of a service strategy. How will the service provider know when it is successful? When must those factors be achieved? CSFs are defined in terms of capabilities and resources, and are proven to be key determinants of success as defined by the industry, the market, the customer and the competition. They are usually dynamic and require investment and time to develop.
As a rule of thumb it is recommended that, in the early stages of measuring, only two or three KPIs are associated with each CSF. As the maturity of the service and service management processes increases, then additional KPIs and CSFs can be implemented.
Example: ‘Improve the availability and reliability of the check-in service.’
5.1.7Key performance indicators
KPIs are defined during service design and service transition. The most tangible benefit to organizations using ITIL is a marked improvement in resource utilization, eliminating redundant effort, decreasing errors and the amount of rework, and increasing scalability with current resource levels. In addition, the ITIL framework helps to improve the availability, reliability, stability and security of mission-critical IT services by providing demonstrable performance indicators to measure and justify the cost of service quality.
The provision of KPIs is essential to supporting continual service improvement (CSI). These KPIs become the data inputs to analyse and identify improvement opportunities.
There are two types of KPIs: qualitative KPIs and quantitative KPIs. Qualitative KPIs focus on service quality and customer satisfaction aspects, while quantitative KPIs focus more on cost and operational aspects.
Qualitative example: ‘10% increase in customer satisfaction rating for handling tickets related to the check-in service over the next six months.’
Quantitative example: ‘10% reduction in the costs of handling check-in related incidents.’
5.1.8Metrics
A metric is a scale of measurement defined in terms of a standard. Metrics define what to measure and are usually specialized by subject area. These measurements or metrics can be used to identify trends, productivity, resources and more.
According to ITIL Continual Service Improvement, there are primarily three types of metrics to support CSI efforts:
- Technology metrics These metrics are focused on the component technology and application level. Examples would include system availability and capacity throughput.
- Process metrics These metrics determine the overall health of the process and are captured in the form of CSFs, KPIs and activity metrics for service management.
- Service metrics These metrics measure the end performance of the service. Combinations of process and technology metrics are used when calculating the end-to-end service metrics.
Different levels of measurement and reporting need to be considered when establishing a measurement framework. Consideration needs to be given to how all the individual component measurements feed the end-to-end service measurement, which should support the KPIs defined in the service. Figure 5.2, taken from ITIL Continual Service Improvement, illustrates these multiple levels of measurement.
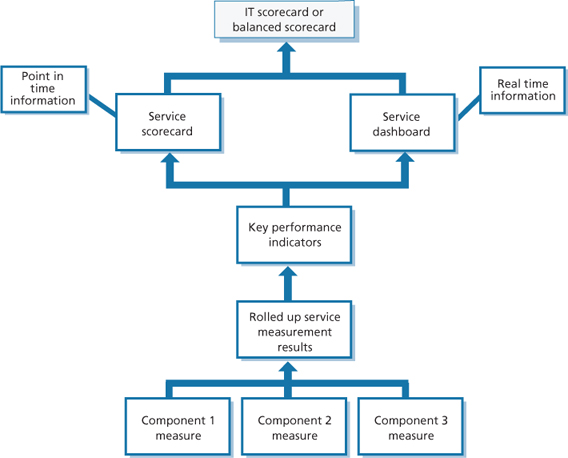
Figure 5.2 Service measurement model
Another good illustration is Figure 5.3, which shows how the overall goals and objectives of the organization can be used to derive the measurements and metrics. Figure 5.3 makes use of the balanced scorecard approach (Kaplan and Norton, 1992), which looks at the health of the organization from the following four perspectives:
- Financial Align IT with the business objectives, manage costs, manage risks and deliver value. Financial management for IT services is the process used to allocate costs and calculate return on investment (ROI).
- Customer IT as a service provided, primarily documented in SLAs. Service level management and business relationship management are the primary processes that support the customer perspective.
- Internal Operational excellence through the implementation of incident management, problem management, change management, service asset and configuration management, and release and deployment management, as well as other IT processes.
- Innovation and learning Business productivity, flexibility of IT, investments in software, professional learning and development. The knowledge management process and service knowledge management system are the two primary areas that support the innovation and learning perspective.
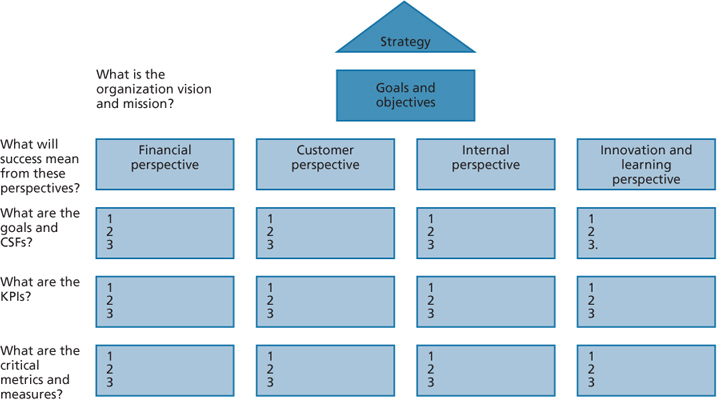
Figure 5.3 Deriving measurements and metrics from goals and objectives
Table 5.1 brings together an example of the integration of a CSF, KPI and measurement.
Table 5.1 Integration of CSF, KPI and measurement
CSF |
KPI |
Measurement |
Improve availability and reliability of the check-in service |
Percentage improvement for end-to-end availability of the check-in service |
End-to-end service availability based on the component availability that makes up the check-in service |
Let us return to the areas the organization is most interested in measuring and improving, as reproduced in Tables 3.4 and 4.1. The organization can take the same approach when building a framework to effectively monitor, measure and improve these process areas.
We will take change management from Table 3.4 and problem management from Table 4.1 to illustrate in Tables 5.2 and 5.3 the application of the framework.
Table 5.2 Change management example
CSF |
KPI |
Measurement |
Effective implementation of changes for the check-in service |
Percentage of requests for change (RFCs) successfully implemented without a back-out or issue Percentage of RFCs that are emergencies |
Measurement of all RFCs that were successfully implemented without a back-out or issue on all applications and systems that support the check-in service. This would also take into account the number of RFCs that were emergencies |
Table 5.3 Problem management example
CSF |
KPI |
Measurement |
Effective implementation of permanent fixes for the check-in service that prevent repeat problems |
Percentage of repeated problems Percentage root cause with permanent fix |
Measurement of all root causes that had a permanent fix on all applications and systems that support the check-in service |
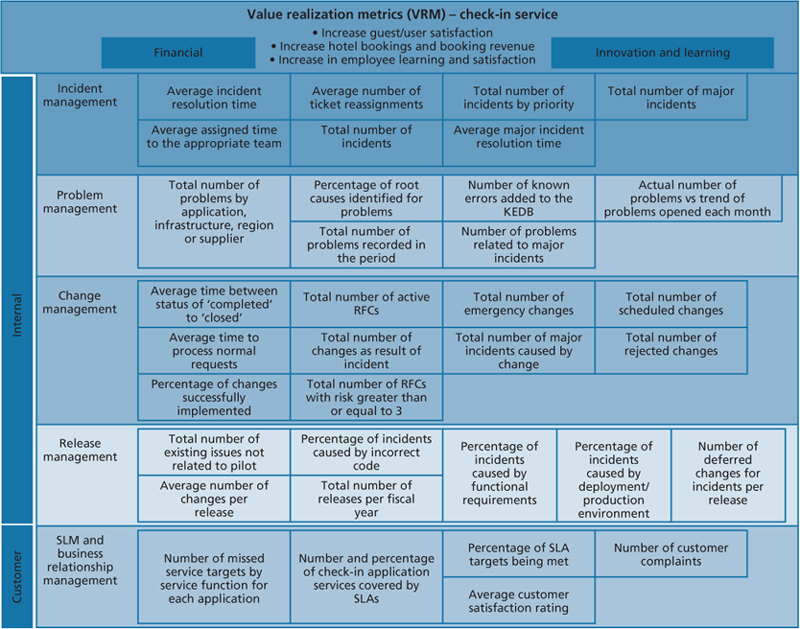
Figure 5.4 links all the elements of the balanced scorecard approach and integrates the process KPIs from the SMS into a holistic measurement approach to support the mission, vision, goals and objectives of the organization. The results are as follows:
- Financial Improved ROI by increasing hotel bookings through an easily accessible hotel check-in service.
- Customer Established service level targets that are measurable for monitoring the availability of the end-to-end hotel check-in service and underlying components.
- Internal Implementation of incident management, problem management, change management, service asset and configuration management, and release and deployment management processes that support hotel check-in application services and underlying components.
- Innovation and learning Establishment of a knowledge management process and service knowledge management system to support employees in assisting guests to use the online hotel check-in service, resulting in increased employee satisfaction, learning and an improved guest experience.