Chapter 3. The Test Engineer
Testability and long-term viability of test automation infrastructure is the purview of the Software Engineer in Test (SET). The Test Engineer (TE) plays a related but different role where the focus is on user impact and risk to the overall mission of the software product. Like most technical roles at Google, there is some coding involved, but the TE role is by far the most broad of all the engineers. He contributes to the product, but many of the tasks a TE takes on require no coding.1
A User-Facing Test Role
In the prior chapter, we introduced the TE as a “user-developer” and this is not a concept to take lightly. The idea that all engineers on a product team fit the mold of a developer is an important part of keeping all stakeholders on an equal footing. At companies like Google where honoring “the writing of code” is such an important part of our culture, TEs need to be involved as engineers to remain first-class citizens. The Google TE is a mix of technical skills that developers respect and a user facing focus that keeps developers in check. Talk about a split personality!
The TE job description is the hardest to nail down as one size definitely does not fit all. TEs are meant as an overseer of all things quality as the various build targets come together and ultimately comprise the entire product. As such, most TEs get involved in some of this lower-level work where another set of eyes and more engineering expertise is needed. It’s a matter of risk: TEs find and contribute to the riskiest areas of the software in whatever manner makes the most sense for that particular product. If SET work is the most valuable, then that’s what a TE does; if code reviews are the most valuable, then so be it. If the test infrastructure is lacking, then it gets some TE attention.
These same TEs can then lead exploratory testing sessions at some other point in a project or manage a dogfood or beta testing effort. Sometimes this is time-driven as early phase work means far more SET-oriented tasks are needed, and later in the cycle, TE-oriented work is prevalent. Other cases are the personal choice of the TEs involved and there are a number of cases where engineers convert from one of these roles to another. There are no absolutes. What we describe in the following section is essentially the ideal case.
The Life of a TE
The TE is a newer role at Google than either Software Engineers (SWEs) or SETs. As such, it is a role still in the process of being defined. The current generation of Google TEs is blazing a trail that will guide the next generation of new hires for this role. Here we present the latest emerging TE processes at Google.
Not all products require the attention of a TE. Experimental efforts and early-stage products without a well defined mission or user story are certainly projects that won’t get a lot of (or any) TE attention. If the product stands a good chance of being cancelled (in the sense that as a proof of concept, it fails to pass muster) or has yet to engage users or have a well defined set of features, testing is largely something that should be done by the people writing the code.
Even if it is clear that a product is going to get shipped, TEs often have little testing to do early in the development cycle when features are still in flux and the final feature list and scope are undetermined. Overinvesting in test engineering too early, especially if SETs are already deeply engaged, can mean wasted effort. Testing collateral that gets developed too early risks being cast aside or, worse, maintained without adding value. Likewise, early test planning requires fewer TEs than later-cycle exploratory testing when the product is close to final form and the hunt for missed bugs has a greater urgency.
The trick in staffing a project with TEs has to do with risk and return on investment. Risk to the customer and to the enterprise means more testing effort and requires more TEs, but that effort needs to be in proportion with the potential return. We need the right number of TEs and we need them to engage at the right time and with the right impact.
After they are engaged, TEs do not have to start from scratch. There is a great deal of test engineering and quality-oriented work performed by SWEs and SETs, which becomes the starting point for additional TE work. The initial engagement of the TE is to decide things such as:
• Where are the weak points in the software?
• What are the security, privacy, performance, reliability, usability, compatibility, globalization, or other concerns?
• Do all the primary user scenarios work as expected? Do they work for all international audiences?
• Does the product interoperate with other products (hardware and software)?
• In the event of a problem, how good are the diagnostics?
Of course these are only a subset. All of this combines to speak to the risk profile of releasing the software in question. TEs don’t necessarily do all of this work, but they ensure that it gets done and they leverage the work of others in assessing where additional work is required. Ultimately, TEs are paid to protect users and the business from bad design, confusing UX, functional bugs, security and privacy issues, and so on. At Google, TEs are the only people on a team whose full-time job is to look at the product or service holistically for weak points. As such, the life of a TE is much less prescriptive and formalized than that of an SET. TEs are asked to help on projects in all stages of readiness: everything from the idea stage to version 8 or even watching over a deprecated or “mothballed” project. Often, a single TE even spans multiple projects, particularly those TEs with specialty skill sets such as security, privacy, or internationalization.
Clearly, the work of a TE varies greatly depending on the project. Some TEs spend much of their time programming, but with more of a focus on medium and large tests (such as end-to-end user scenarios) rather than small tests. Other TEs take existing code and designs to determine failure modes and look for errors that can cause those failures. In such a role, a TE might modify code but not create it from scratch. TEs must be more systematic and thorough in their test planning and completeness with a focus on the actual usage and systemwide experience. TEs excel at dealing with ambiguity in requirements and at reasoning and communicating about fuzzy problems.
Successful TEs accomplish all this while navigating the sensitivities and, sometimes, strong personalities of the development and product team members. When weak points are found, TEs happily break the software and drive to get these issues resolved with the SWEs, PMs, and SETs. TEs are generally some of the most well known people on a team because of the breadth of interactions their jobs require.
Such a job description can seem like a frightening prospect given the mix of technical skill, leadership, and deep product understanding required. Indeed, without proper guidance, it is a role in which many would expect to fail. However, at Google, a strong community of TEs has emerged to counter this. Of all job functions, the TE role is perhaps the best peer-supported role in the company. The insight and leadership required to perform the TE job successfully means that many of the top test managers in the company come from the TE ranks.
There is fluidity to the work of a Google TE that belies any prescriptive process for engagement. TEs can enter a project at any point and must assess the state of the project, code, design, and users quickly and decide what to focus on first. If the project is just getting started, test planning is often the first order of business. Sometimes TEs are pulled in late in the cycle to evaluate whether a project is ready for ship or if there are any major issues before an early “beta” goes out. If they are brought into a newly acquired application or one in which they have little prior experience, they often start doing some exploratory testing with little or no planning. Sometimes projects haven’t been released for quite a while and just need some touchups, security fixes, or UI updates—calling for an even different approach.
One size rarely fits all for TEs at Google. We often describe a TE’s work as “starting in the middle” in that a TE has to be flexible and integrate quickly into a product team’s culture and current state. If it’s too late for a test plan, don’t build one. If a project needs tests more than anything else, build just enough of a plan to guide that activity. Starting at “the beginning” according to some testing dogma is simply not practical.
Following is the general set of practices we prescribe for TEs:
• Test planning and risk analysis
• Review specs, designs, code, and existing tests
• Exploratory testing
• User scenarios
• Executing test cases
• Crowd sourcing
• Usage metrics
• User feedback
Of course, TEs with a strong personality and excellent communication skills are the ones who do all these things to maximum impact.
Test Planning
Developers have a key advantage over testers in that the artifact they work on is one that everyone cares about. Developers deal with code and because that code becomes the application that users covet and that makes profit for the company, it is by definition the most important document created during project execution.
Testers, on the other hand, deal with documents and artifacts of a far more temporal nature. In the early phases of a project, testers write test plans; later, they create and execute test cases and create bug reports. Still, later they write coverage reports and collect data about user satisfaction and software quality. After the software is released and is successful (or not), few people ask about testing artifacts. If the software is well loved, people take the testing for granted. If the software is poor, people might question the testing, but it is doubtful that anyone would want to actually see it.
Testers cannot afford to be too egotistical about test documentation. In the throes of the coding, reviewing, building, testing, rinsing, and repeating cycle that is software development, there is little time to sit around and admire a test plan. Poor test cases rarely achieve enough attention to be improved; they simply get thrown out in favor of those that are better. The attention is focused on the growing codebase and as the only artifact that actually matters, this is as it should be.
As test documentation goes, test plans have the briefest actual lifespan of any test artifact.2 Early in a project, there is a push to write a test plan (see Appendix A, “Chrome OS Test Plan,” for an early Chrome OS test plan). Indeed, there is often an insistence among project managers that a test plan must exist and that writing it is a milestone of some importance. But, once such a plan is written, it is often hard to get any of those same managers to take reviewing and updating it seriously. The test plan becomes a beloved stuffed animal in the hands of a distracted child. We want it to be there at all times. We drag it around from place to place without ever giving it any real attention. We only scream when it gets taken away.
Test plans are the first testing artifact created and the first one to die of neglect. At some early point in a project, the test plan represents the actual software as it is intended to be written but unless that test plan is tended constantly, it soon becomes out of date as new code is added, features veer from their preplanned vision, and designs that looked good on paper are reevaluated as they are implemented and meet feedback from users. Maintaining a test plan through all these planned and unplanned changes is a lot of work and only worthwhile if the test plan is regularly consulted by a large percentage of the projects’ stakeholders.
This latter point is the real killer of the idea of test planning: How much does a test plan actually drive testing activity throughout the entire lifecycle of a product? Do testers continually consult it as they divvy up the features among them so as to divide and conquer the app? Do developers insist the test plan be updated as they add and modify functionality? Do development managers keep a copy open on their desktop as they manage their to-do list? How often does a test manager refer to the contents of a test plan in status and progress meetings? If the test plan is actually important, all of these things would be happening every day.
Ideally, the test plan should play such a central role during project execution. Ideally, it should be a document that lives as the software lives, getting updates as the codebase gets updates and representing the product as it currently exists, not as it existed at the start of a project. Ideally, it should be useful for getting new engineers up to speed as they join a project already in progress.
That’s the ideal situation. It’s also a situation few testers have actually achieved here at Google or anywhere else for that matter.
Here are some features we want in a test plan:
• It is always up to date.
• It describes the intent of the software and why it will be loved by its users.
• It contains a snapshot of how the software is structured and the names of the various components and features.
• It describes what the software should do and summaries how it will do it.
From a purely testing point of view, we have to worry about the test plan being relevant while not making its care and feeding such a burden that it becomes more work than it is worth:
• It cannot take long to create and must be readily modifiable.
• It should describe what must be tested.
• It should be useful during testing to help determine progress and coverage gaps.
At Google, the history of test planning is much the same as other companies we’ve experienced. Test planning was a process determined by the people doing it and executed according to local (meaning the individual team) custom. Some teams wrote test plans in Google Docs (text documents and spreadsheets), shared with their engineering team but not in a central repository. Other teams linked their test plans on their product’s home page. Still others added them to the internal Google Sites pages for their projects or linked to them from the engineering design documents and internal wikis. A few teams even used Microsoft Word documents, sent around in emails to the team in a proper old-school way. Some teams had no test plans at all, just test cases whose sum total, we must suppose, represented the plan.
The review path for these plans was opaque and it was hard to determine the authors and reviewers. Far too many of the test plans had a time and date stamp that made it all too clear that they had been written and long forgotten like the sell-by date on that old jar of jam in the back of the refrigerator. It must have been important to someone at some time, but that time has passed.
There was a proposal floated around Google to create a central repository and template for all product test plans. This was an interesting idea that has been tried elsewhere, but one clearly contrary to Google’s inherently distributed and self-governed nature where “states rights” was the norm and big government a concept that brought derision.
Enter ACC (Attribute Component Capability) analysis, a process pulled together from the best practices of a number of Google test teams and pioneered by the authors and several colleagues in various product areas. ACC has passed its early adopter’s phase and is being exported to other companies and enjoying the attention to tool developers who automate it under the “Google Test Analytics” label.
ACC has the following guiding principles:
• Avoid prose and favor bulleted lists. Not all testers wish to be novelists or possess the skill set to adequately capture in prose a product’s purpose in life or its testing needs. Prose can be hard to read and is easily misinterpreted. Just the facts please!
• Don’t bother selling. A test plan is not a marketing document or a place to talk about how important a market niche the product satisfies or how cool it is. Test plans aren’t for customers or analysts; they are for engineers.
• No fluff. There is no length expectation for a test plan. Test plans are not high school term projects where length matters. Bigger is not better. The size of the plan is related to the size of the testing problem, not the propensity of the author to write.
• If it isn’t important and actionable, don’t put it in the plan. Not a single word in the plan should garner a “don’t care” reaction from a potential stakeholder.
• Make it flow. Each section of the test plan should be an expansion of earlier sections so that one can stop reading at anytime and have a picture of the product’s functionality in his head. If the reader wants more detail, he can continue reading.
• Guide a planner’s thinking. A good planning process helps a planner think through functionality and test needs and logically leads from higher-level concepts into lower-level details that can be directly implemented.
• The outcome should be test cases. By the time the plan is completed, it should clearly describe not just what testing needs to be done but that it should also make the writing of test cases obvious. A plan that doesn’t lead directly to tests is a waste of time.
This last point is crucial: If the test plan does not describe in enough detail what test cases need to be written, then it hasn’t served its primary purpose of helping us test the application we are building. The planning of tests should put us in a position to know what tests need to be written. You are finished planning when you are at exactly that spot: You know what tests you need to write.
ACC accomplishes this by guiding the planner through three views of a product corresponding to 1) adjectives and adverbs that describe the product’s purpose and goals, 2) nouns that identify the various parts and features of the product, and 3) verbs that indicate what the product actually does. It follows that testing allows us to test that those capabilities work and the components as written satisfy the application’s purpose and goals.
A is for “Attribute”
When starting test planning or ACC, it is important to first identify why the product is important to users and to the business. Why are we building this thing? What core value does it deliver? Why is it interesting to customers? Remember, we’re not looking to either justify or explain these things, only to label them. Presumably the PMs and product planners, or developers, have done their job of coming up with a product that matters in the marketplace. From a testing perspective, we just need to capture and label these things so we can ensure they are accounted for when we test it.
We document the core values in a three-step process called Attribute, Component, Capability analysis and we do so in that order, with attributes as the first target.
Attributes are the adjectives of the system. They are the qualities and characteristics that promote the product and distinguish it from the competition. In a way, they are the reasons people would choose to use the product over a competitor. Chrome, for example, is held to be fast, secure, stable, and elegant, and these are the attributes we try to document in the ACC. Looking ahead, we want to get to a point where we can attach test cases to these labels so that we know how much testing we have done to show that Chrome is fast, secure, and so on.
Typically, a product manager has a hand in narrowing down the list of attributes for the system. Testers often get this list by reading the product requirements document, the vision and mission statement of the team, or even by simply listening to a sales guy describe the system to a prospective customer. Indeed, we find at Google that salespeople and product evangelists are an excellent source of attributes. Just imagine back-of-the-box advertising or think about how the product would be pitched on QVC, and you can get the right mindset to list the attributes.
Some tips on coming up with attributes for your own projects:
• Keep it simple. If it takes more than an hour or two, you are spending too long on this step.
• Keep it accurate. Make sure it comes from a document or marketing information that your team already accepts as truth.
• Keep it moving. Don’t worry if you missed something—if it’s not obvious later, it probably wasn’t that important anyway.
• Keep it short. No more than a dozen is a good target. We boiled an operating system down to 12 key attributes (see Figure 3.1), and in retrospect, we should have shortened that list to 8 or 9.

Figure 3.1 Original Chrome risk analysis.
Note
Some figures in this chapter are representational and are not intended to be read in detail.
Attributes are used to figure out what the product does to support the core reasons for the product’s existence and to surface these reasons to testers so they can be aware of how the testing they do impacts the application’s ultimate reason for existence.
As an example, consider the attributes for a product called Google Sites, which is a freely available application for building a shared website for some open or closed community. Sites, as you’ll find with many end-user applications, is kind enough to provide most of its attributes for you in its own documentation, as shown in Figure 3.2.
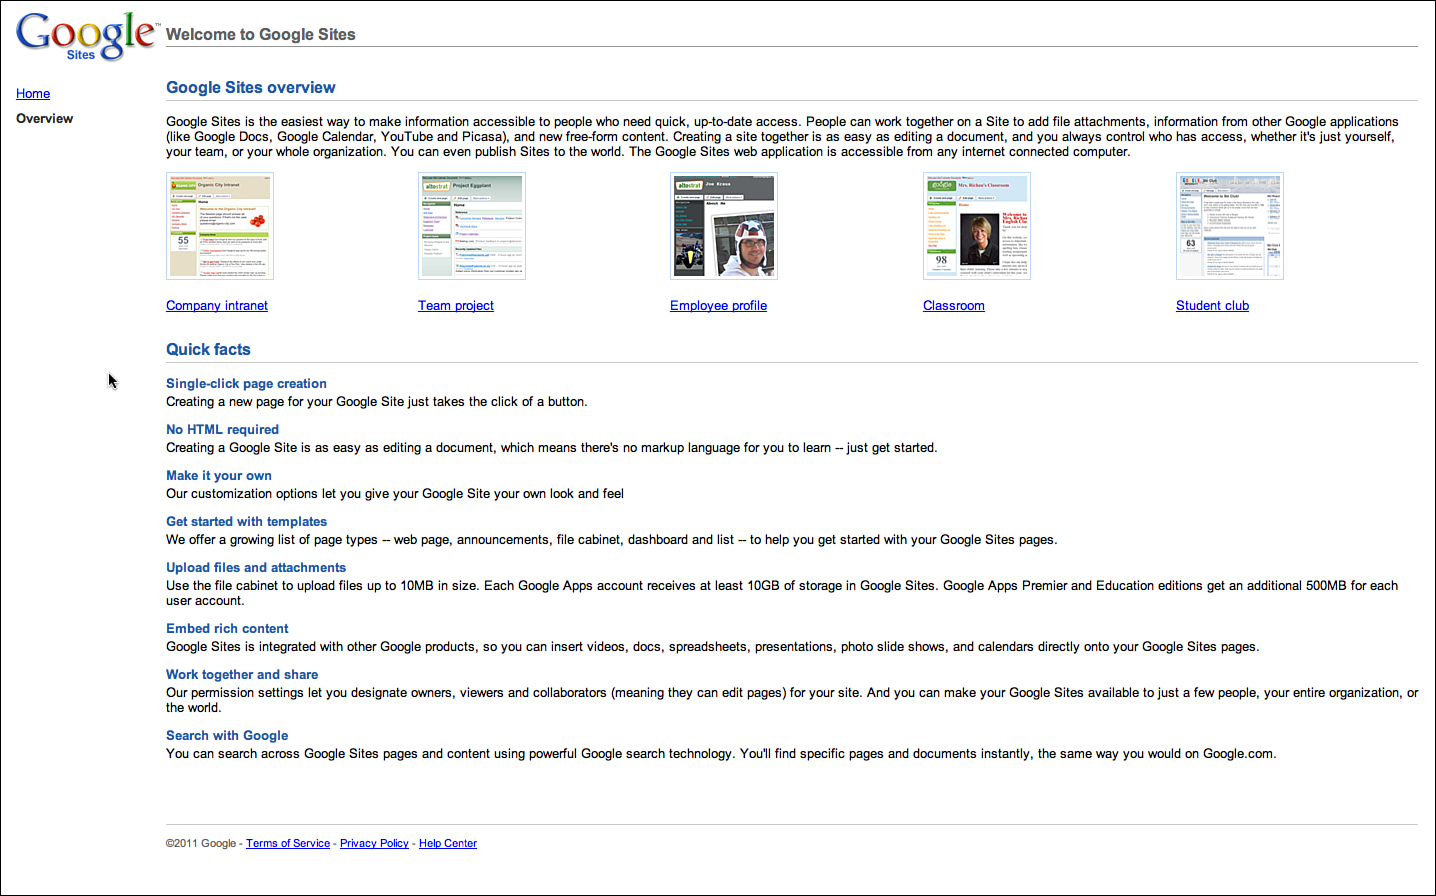
Figure 3.2 Welcome to Google Sites.
Indeed, most applications that have some sort of Getting Started page or sales-oriented literature often do the work of identifying attributes for you. If they do not, then simply talking to a salesperson, or better yet, simply watching a sales call or demo, gets you the information you need.
Attributes are there for the taking. If you have trouble enumerating them in anything more than a few minutes, then you do not understand your product well enough to be an effective tester. Learn your product and listing its attributes becomes a matter of a few minutes of work.
At Google, we use any number of tools for documenting risk; from documents to spreadsheets to a custom tool built by some enterprising engineers called Google Test Analytics (GTA). It doesn’t really matter what you use, just that you get them all written down (see Figure 3.3).
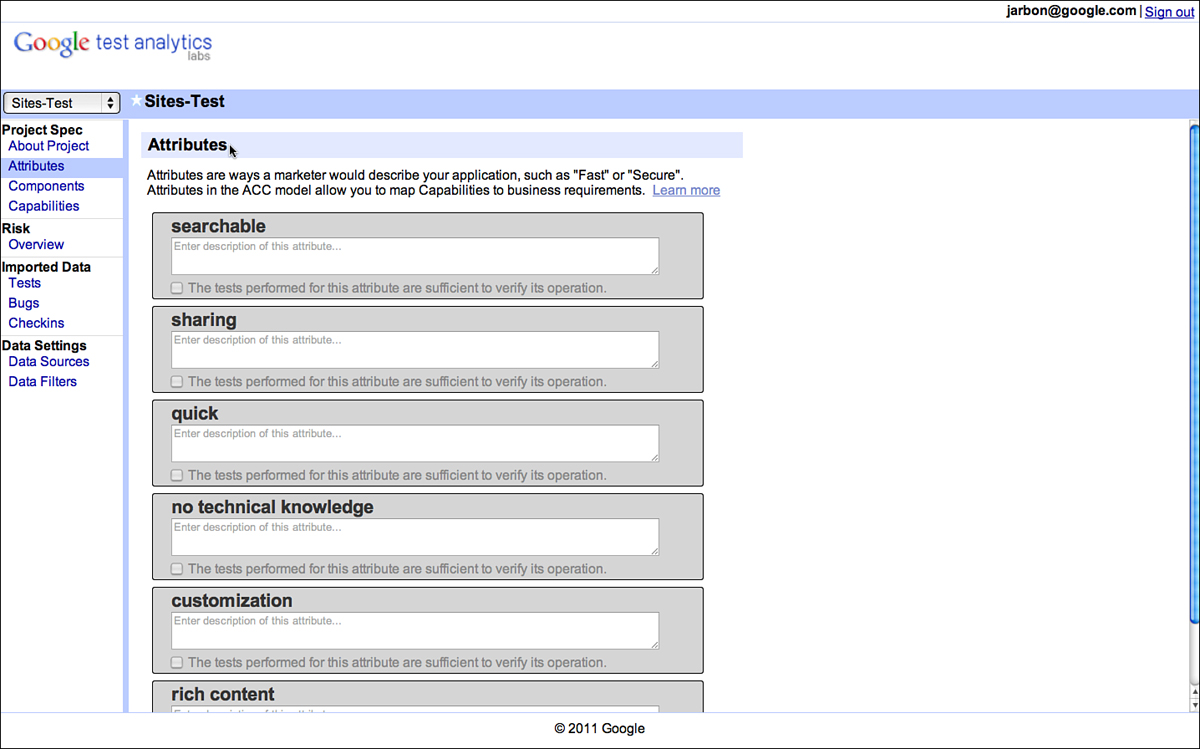
Figure 3.3 Attributes for Google Sites as documented in GTA.
C is for “Component”
Components are the nouns of the system and the next target of enumeration after the attributes are complete. Components are the building blocks that together constitute the system in question. They are the shopping cart and the checkout feature for an online store. They are the formatting and printing features of a word processor. They are the core chunks of code that make the software what it is. Indeed, they are the very things that testers are tasked with testing!
Components are generally easy to identify and often already cast in a design document somewhere. For large systems, they are the big boxes in an architectural diagram and often appear in labels in bug databases or called out explicitly in project pages and documentation. For smaller projects, they are the classes and objects in the code. In every case, just go and ask each developer: “What component are you working on?” and you will get the list without having to do much else.
As with attributes, the level of detail in identifying components of the product is critical. Too much detail and it becomes overwhelming and provides diminishing returns. Too little detail, and there’s simply no reason to bother in the first place. Keep the list small; 10 is good and 20 is too many unless the system is very large. It’s okay to leave minor things out. If they are minor, then they are part of another component or they don’t really matter enough to the end user for us to focus on them.
Indeed, for both the attributes and the components, spending minutes tallying them should suffice. If you are struggling coming up with components, then you seriously lack familiarity with your product and you should spend some time using it to get to the level of a power user quickly. Any actual power user should be able to list attributes immediately and any project insider with access to the source code and its documentation should be able to list the components quickly as well. Clearly we believe it is important for testers to be both power users and, obviously, project insiders.
Finally, don’t worry about completeness. The whole ACC process is based on doing something quick and then iterating as you go. If you miss an attribute, you might discover it as you are listing the components. Once you get to the capability portion, which is described next, you should shake out any attributes or components you missed earlier.
The components for Google Sites appear in Figure 3.4.
Figure 3.4 Components for Google Sites as documented in GTA.
C is for “Capability”
Capabilities are the verbs of the system; they represent the actions the system performs at the command of the user. They are responses to input, answers to queries, and activities accomplished on behalf of the user. Indeed, they are the very reason users choose to use your software in the first place: They want some functionality and your software provides it.
Chrome, for example, has the capabilities of rendering a web page and playing a Flash file. Chrome can synchronize between clients and download a document. All these are capabilities and these and many more represent the full set of capabilities of the Chrome web browser. A shopping app, on the other hand, has the capability of performing a product search and completing a sale. If an application can perform a task, then this task is labeled as one of its capabilities.
Capabilities lie at the intersection of attributes and components. Components perform some function to satisfy an attribute of the product and the result of this activity is providing a capability to a user. Chrome renders a web page fast. Chrome plays a Flash file securely. If your product does something that isn’t covered by the intersection of an attribute and a component, it probably doesn’t matter and warrants raising the question as to why we are bothering to have it in the product. A capability that doesn’t serve a core value to the product sounds very much like fat that can be trimmed and represents potential points of failure with little to be gained. Either that or there is an explanation for the capabilities’ existence and you don’t understand it. Not understanding your product is unacceptable in the testing profession. If any single engineer on a project understands his product’s value proposition to its users, that someone is a tester!
Here are some examples of capabilities for an online shopping site:
• Add/remove items from the shopping cart. This is a capability of the Cart component when trying to meet the Intuitive UI attribute.
• Collect credit card and verification data. This is a capability of the Cart component when trying to meet the Convenient attribute and the Integrated (for instance, integrated with the payment system) attribute.
• Processes monetary transactions using HTTPS. This is a capability of the Cart component when trying to meet the Secure attribute.
• Provide suggestions to shoppers based on the products they are viewing. This is a capability of the Search component when trying to meet the Convenient attribute.
• Calculate shipping cost. This is a capability of the UPS Integration component when trying to meet the Fast and Secure attribute.
• Display available inventory. This is a capability of the Search component when trying to meet the Convenient and Accurate attribute.
• Defer a purchase for a later date. This is a capability of the Cart component when trying to meet the Convenient attribute.
• Search for items by keyword, SKU, and category. This is a capability of the Search component when trying to satisfy the Convenient and Accurate attributes. In general, we prefer to treat each search category as a separate capability.
Obviously there can be a large number of capabilities and if it feels like you are listing everything you could test, then you are getting the hang of ACC! The entire idea is to list, quickly and succinctly, the most important capabilities of the system that need to be verified to be in working order.
Capabilities are generally user-oriented and written to convey a user’s view of what the system does. They are also far more numerous than either attributes or components. Whereas brevity rules in the first two stages of ACC, capabilities should in sum total describe everything the system is capable of doing and therefore be greater in number based on the feature richness and complexity of the application in question.
For systems, we have worked on at Google, capabilities tend to be in the hundreds for larger more complicated applications (Chrome OS has more than 300, for example) and in the dozens for smaller applications. Surely there is a case to be made for products with only a few capabilities to not require testing beyond what the developers and a few early users could accomplish. So if you are testing something with fewer than 20 capabilities, you might want to question your presence on the project!
The most important aspect of capabilities is that they are testable. This is the primary reason we write them in an active voice. They are verbs because they require action on our part, specifically that we will write test cases to determine whether each capability is implemented correctly and that the user will find the experience useful. We discuss more about translating capabilities into test cases later.
The right level of abstraction for capabilities is a point that gets argued about a great deal among Google TEs. Capabilities, by definition, are not meant to be atomic actions. A single capability can describe any number of actual use cases. In the previous shopping example, the capabilities don’t specify which items are in the cart or the outcome of a specific search. They describe general activities a user might be involved in. This is intentional as such details are too voluminous to document unless they are actually going to be tested. We cannot test all possible searches and shopping cart configurations, so we only bother translating these capabilities into test cases for the ones that actually get tested.
Capabilities are not meant to be test cases in the sense that they contain all the information necessary to run them as actual tests. We don’t put exact values and specific data into a capability. The capability is that a user can shop. The test case specifies what they shop for. Capabilities are general concepts of actions the software can take or a user can request. They are meant to be general. They imply tests and values but are not tests themselves.
Continuing with the Google Sites example, we show in Figure 3.5 a grid showing attributes across the x axis and components across the y axis. This is the way we link capabilities back to attributes and components. The first thing to note is the large number of empty squares. This is typical as not every component has an impact on every attribute. For Chrome, only some of the components are responsible for making it fast or secure; the others will have blanks representing no impact. These blank entries mean that we don’t have to test this particular attribute component pair.
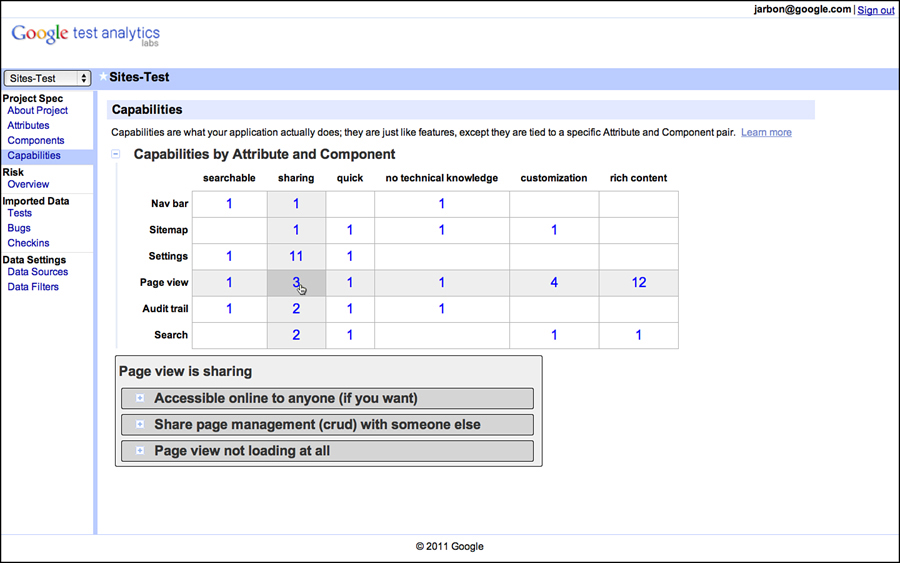
Figure 3.5 Capabilities are tied to attributes and components in GTA.
Each row or column of the table of capabilities represents a slice of functionality that is related in some fashion. A single row or column is a good way to break the application’s functionality into testable sessions. A test manager might take each row and assign it to separate test teams or have a bug bash to really hit a row or column hard. They also make excellent targets for exploratory testing and when each exploratory tester takes a different row and column, you can manage overlap and get better coverage.
For entries that contain a numeric value, this is the number of capabilities provided by that component to satisfy that attribute. The higher the number, the more test points for that particular intersection. For example, the Page View components impact the Sharing attributes with the following three capabilities:
• Make the document accessible to collaborators.
• Share page management duties with a collaborator.
• View collaborator position within a page.
These capabilities conveniently specify things that need to be tested for the Page View/Sharing pair. We can either write test cases for them directly or test a combination of capabilities by combining them into a larger use case or test scenario.
Writing good capabilities requires some discipline. Here are some properties we’ve found to be useful guidance for writing capabilities:
1. A capability should be written as an action and convey the sense of the user accomplishing some activity using the application under test.
2. A capability should provide enough guidance for a tester to understand what variables are involved in writing test cases for the behavior it describes. For example, process monetary transactions using https requires that the tester understands what types of monetary transactions the system is capable of performing and a mechanism to validate whether the transaction occurs over https. Obviously, there is a great deal of work to be done here. If we believe there are monetary transactions that might be missed by, say, a new tester on the team, then by all means, replicate this capability to expose the various transaction types. If not, then the level of abstraction is good enough. Likewise, if https is something well understood by the team, then the capability is fine as it is worded. Don’t fall into the trap of trying to document everything as capabilities; they are supposed to be abstract. Leave it to the test cases or exploratory testers themselves to provide that level of detail.3
3. A capability should be composed with other capabilities. In fact, a user story or use case (or whatever terminology you may prefer) should be describable with a series of capabilities. If a user story cannot be written with only the existing capabilities, then there are missing capabilities or the capabilities are at too high a level of abstraction.
Transforming a set of capabilities into user stories is an optional interim step that can add a great deal of flexibility to testing. In fact, there are several groups in Google that prefer more general user stories over more specific test cases when engaging with external contractors or when organizing a crowd-sourced exploratory testing effort. Test cases can be specific and cause boredom as they are executed over and over by a contractor, whereas a user story provides enough leeway in deciding specific behaviors that it makes testing more fun and less prone to mistakes from boring, rote execution.
Whether it is user stories, test cases, or both that are the ultimate goal, here is the general guidance for translating capabilities to test cases. Keep in mind these are goals, not absolutes.
• Every capability should be linked to at least one test case. If the capability is important enough to document, it is important enough to test.
• Many capabilities require more than one test case. Whenever there is variation in the inputs, input sequences, system variables, data used, and so on, multiple test cases are required. The attacks in How to Break Software and the tours in Exploratory Software Testing provide good guidance in test case selection and ways to think through data and inputs that are more likely to turn a capability into a test case that finds a bug.
• Not all capabilities are equal and some are more important than others. The next step in the process (described in the next section) addresses how risk is associated with the capabilities to distinguish their importance.
Once the ACC is complete, it specifies everything we could test if budget and time were not a problem. Given that both of these are pretty major problems, it helps to prioritize. At Google, we call such prioritization risk analysis and that’s the subject matter we turn to next.
• Google+ Attributes (derived exclusively by watching an executive discuss Google+)
Social: Empowers users to share information and what they’re up to.
Expressive: Users can express themselves through the features.
Easy: Intuitive. Easy to figure out how to do what you want to do.
Relevant: Shows only information the user cares about.
Extensible: Capable of integrating with Google properties and third-party sites and applications.
Private: Users’ data won’t be shared.
• Google+ Components (derived from architecture documents)
Profile: Information and preferences for the logged in user.
People: Profiles that the user has connected with.
Stream: A ranked stream of posts, comments, notifications, photos, and so on.
Circles: Groups to put contacts into “friends,” “co-workers,” and so on.
Notifications: Indicators for when you are mentioned in a post.
Interests or +1: Indication for user likes.
Posts: Buzz posts from the users and their contacts.
Comments: Comments on posts, photos, videos, and so on.
Photos: Photos uploaded by the users and their contacts.
• Google+ Capabilities:
Profile:
Social: Share profiles and preferences with friends and contacts.
Expressive: Users can create an online version of themselves.
Expressive: Personalize your experience with Google+.
Easy: Easy to enter and update information and have it propagate.
Extensible: Serves profile information to applications with appropriate access.
Private: Enables a user to keep private data private.
Private: Share data only with approved and appropriate parties.
People:
Social: Users can connect with users’ friends, coworkers, and families.
Expressive: Profiles of other users are personalized and easily distinguishable.
Easy: Provides tools to easily manage a user’s contacts.
Relevant: Users can filter their contacts based on criteria for relevance.
Extensible: Serves contact data to authorized services and applications.
Private: Keeps data about a user’s contacts private to approved parties.
Stream:
Social: Informs the users of updates from their social networks.
Relevant: Filters for updates the user would be interested in.
Extensible: Serves stream updates to services and applications.
Circles:
Social: Groups contacts into circles based on social context.
Expressive: New circles can be created based on the context of the user.
Easy: Facilitates adding, updating, and removing contacts to and from circles.
Easy: Facilitates creating and modifying circles.
Extensible: Serves data about circles for use to services and applications.
Notifications:
Easy: Presents notifications concisely.
Extensible: Posts notifications for use by other services and applications.
Hangouts:
Social: Users can invite their circles to hang out.
Social: Users can open hangouts to the public.
Social: Others are notified of hangouts they access in their streams.
Easy: Hangouts can be created and participated in within a few clicks.
Easy: Video and audio inputs can be disabled with a single click.
Easy: Additional users can be added to an existing hangout.
Expressive: Before joining a hangout, users can preview how they will appear to others.
Extensible: Users can chat through text while in a hangout.
Extensible: Videos from YouTube can be added to a hangout.
Extensible: Devices can be configured and adjusted in Settings.
Extensible: Users without a webcam can participate in hangouts through audio.
Private: Only invited guests can access a hangout.
Private: Only invited guests are notified of a hangout.
Posts:
Expressive: Expresses the thoughts of the user through Buzz.
Private: Posts are restricted to the intended audience.
Comments:
Expressive: Expresses the thoughts of the user through comments.
Extensible: Posts data on comments for use by other services and applications.
Private: Posts are restricted to the intended audience.
Photos:
Social: Users can share their photos with their contacts and friends.
Easy: Users can easily upload new photos.
Easy: Users can easily import photos from other sources.
Extensible: Integration with other photo services.
Private: Photos are restricted so that they’re only visible to the intended audience.
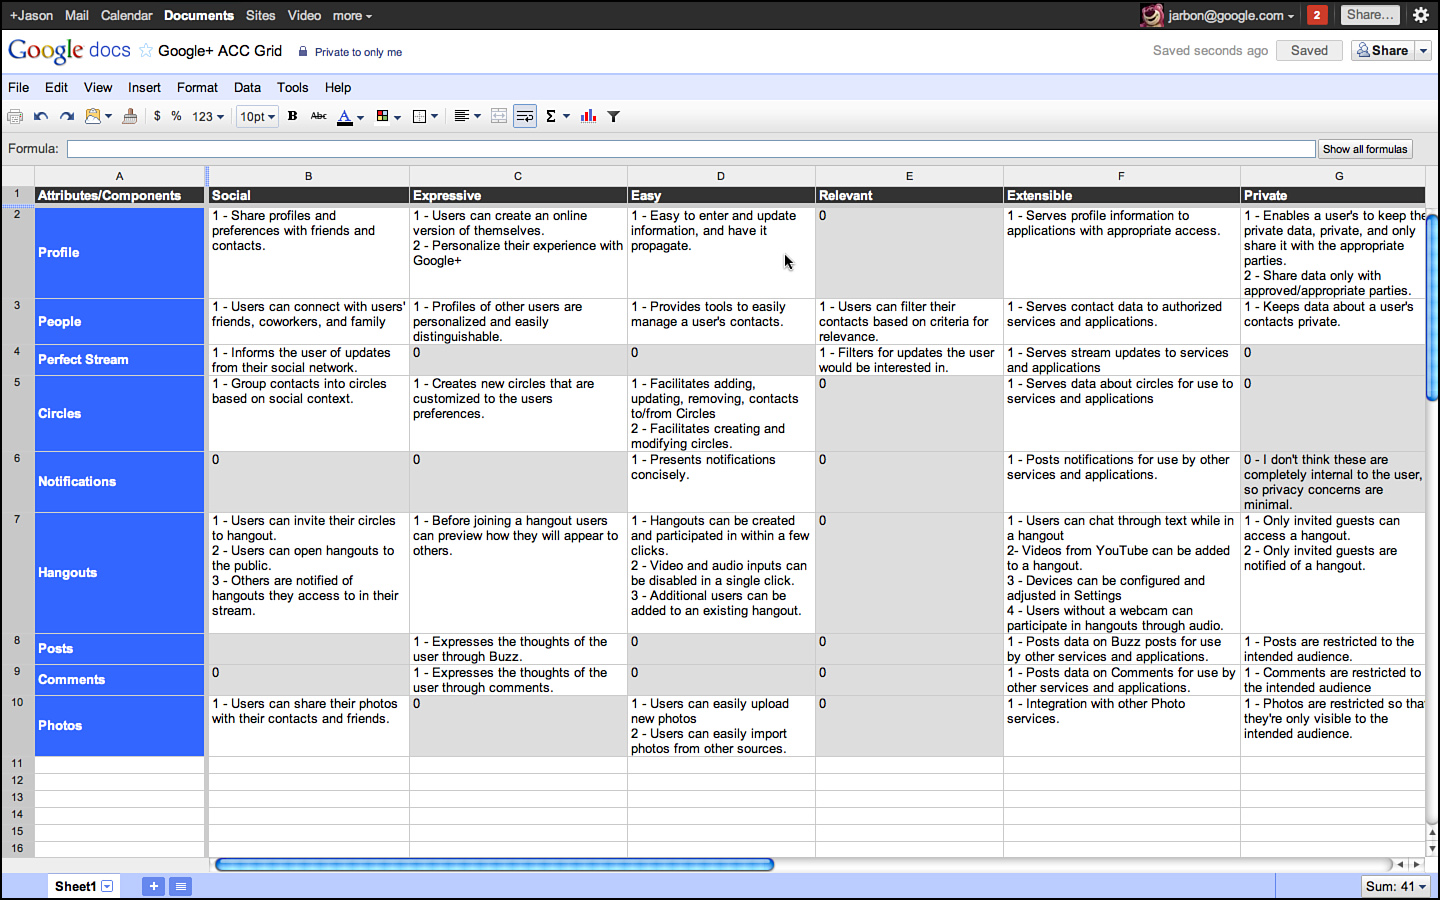
Figure 3.6 ACC spreadsheet grid for Google+.
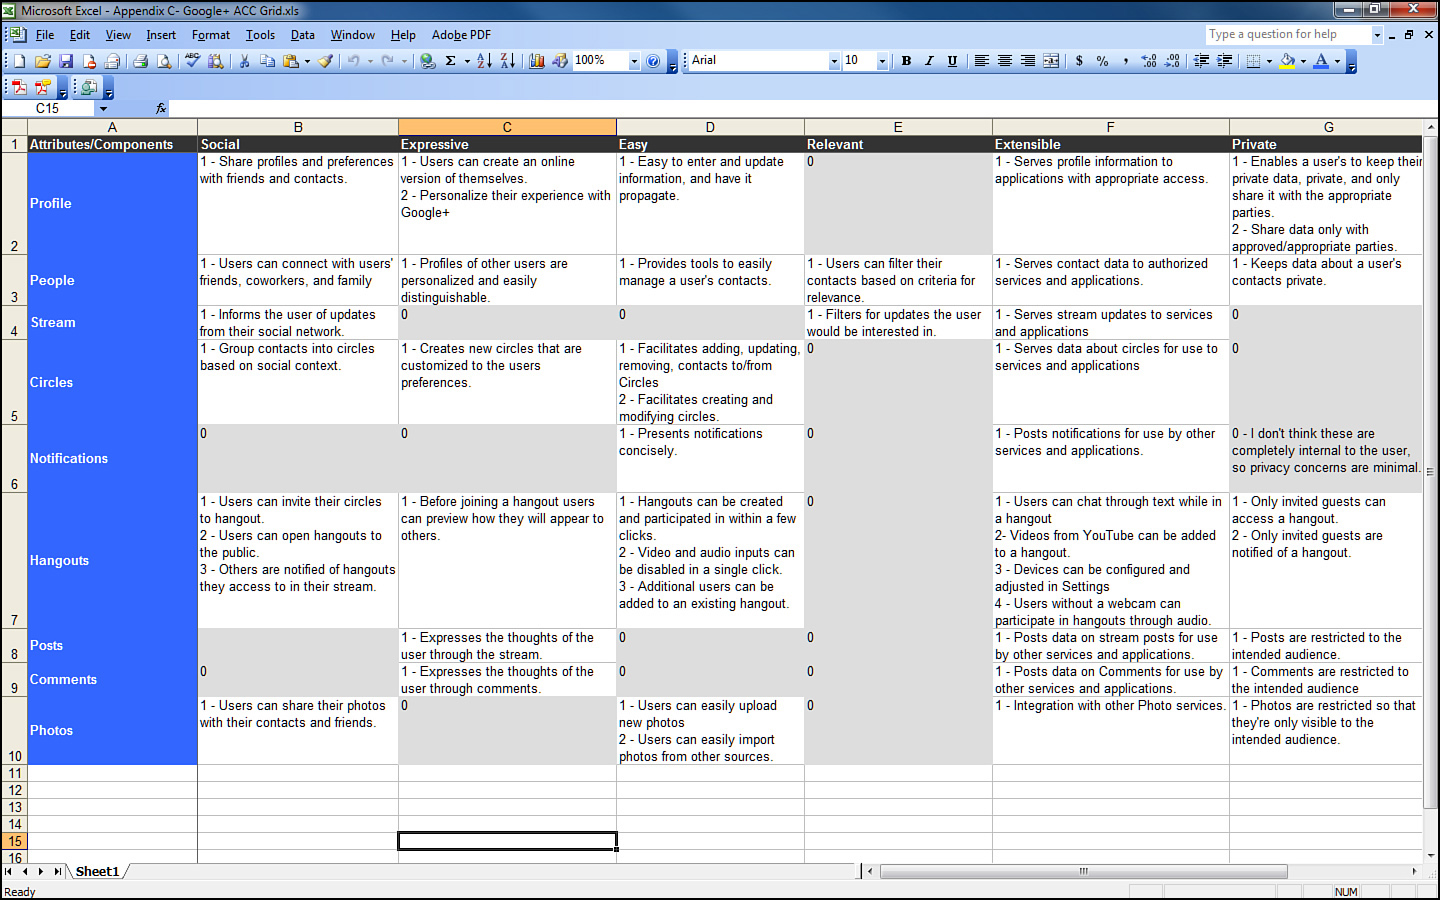
Figure 3.7 Google+ ACC grid.
Risk
Risk is everywhere. At home, on the roads, and at our workplace, everything we do has an element of risk, and shipping software is no different. We buy safer cars and practice defensive driving to mitigate the risk of driving. At work, we watch what we say in meetings and try to find projects suitable to our skill set to mitigate the risk of losing our job. How do we mitigate the risk of shipping software? How can we navigate the overwhelming odds that the software will fail (after all, no software is perfect) and cause untold damage to our company’s reputation?
Certainly not shipping the software isn’t an option despite its complete negation of the risk of failure. The enterprise benefits from well calculated risks.
Note that we did not say “well quantified” risks. Risk, at least for our purposes, isn’t something that requires mathematical precision. We walk on sidewalks and not the street not because of a formula that shows a 59 percent decrease in risk but a general knowledge that roads are not a safe place for pedestrians. We buy cars with air bags not because we know the math behind increasing our survival chances in case of a wreck but because they represent an obvious mitigation to the risk of breaking our faces on the steering wheel. Risk mitigations can be incredibly powerful without a great deal of precision and the process of determining risk is called risk analysis.
Risk Analysis
For software testing, we follow a common sense process for understanding risk. The following factors have been helpful to us when understanding risk:
• What events are we concerned about?
• How likely are these events?
• How bad would they be to the enterprise?
• How bad would they be for customers?
• What mitigations does the product implement?
• How likely is it that these mitigations would fail?
• What would be the cost of dealing with the failure?
• How difficult is the recovery process?
• Is the event likely to recur or be a one-time problem?
There are many variables in determining risk that makes quantifying it more trouble than mitigating it. At Google, we boil risk down to two primary factors: frequency of failure and impact. Testers assign simple values for each of these factors to each capability. We’ve found that risk is real as a qualitative number rather than as an absolute number. It isn’t about assigning an accurate value; it’s about determining whether one capability is more or less risky than another capability. This is enough to determine which capabilities to test and which order to test them in. GTA presents the options, as shown in Figure 3.8.
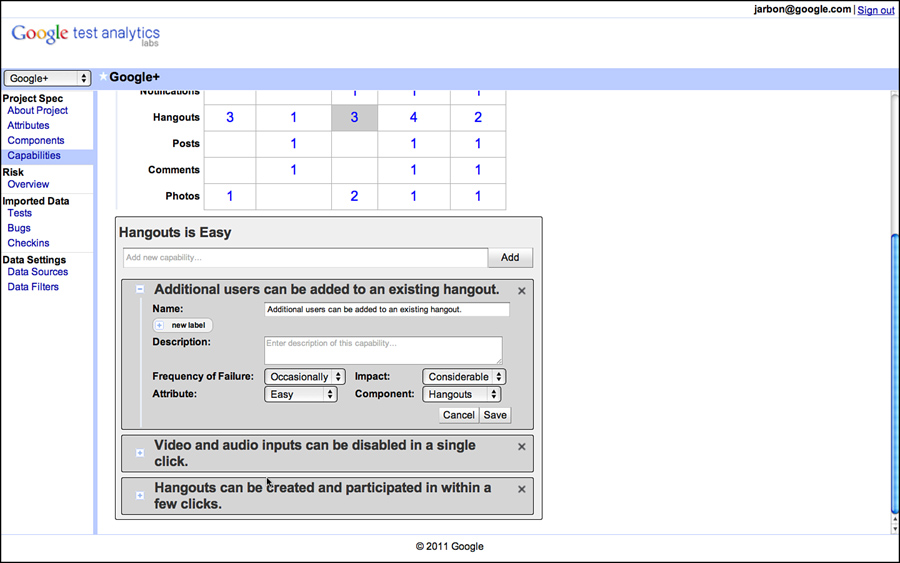
Figure 3.8 Estimating risk in terms of frequency and impact in GTA for Google+.
GTA uses four predefined values for frequency of occurrence:
• Rarely: It’s hard to imagine a case where failure would occur and recovery would not be trivial.
• Example: Download page for Chrome.4 The content is largely static with parameterization for only auto-detection of the client OS, even if there was a break in the core HTML or script on the page that would be detected quickly by monitoring code.
• Seldom: There are cases where failure can occur, but low complexity or low usage would make such occurrences rare.
• Example: The Forward button in Chrome. This button is used, but far less frequently than the Back button. Historically, it doesn’t fail often, and even if it did regress, we would expect our early adopters on the early release channels to catch this issue quickly as it would be fairly obvious.
• Occasionally: Failure circumstances are readily imaginable, somewhat complex, and the capability is one we expect to be popular.
• Example: Chrome Sync capabilities. Chrome synchronizes the bookmarks, themes, form-fill, history, and other user profile data across clients. There are different data types and multiple OS platforms, and merging changes is a somewhat complex computer science problem in its own right. Users are also likely to notice if this data isn’t synchronized. Synchronization happens only when data to be synchronized changes, like when a new bookmark has been added.
• Often: The capability is part of a high-use, high-complexity feature that experiences failure on a regular basis.
• Example: Rendering web pages. This is the primary use case of a browser. Rendering HTML, CSS, and JavaScript code of whatever origin and quality is the principle task a browser performs. If any of this code fails, it’s the browser that the user blames. Risk increases when you consider such a failure on a high-traffic site. Rendering issues aren’t always caught by users either; they often result in elements misaligned slightly, but still functional, or elements go missing, but the user wouldn’t know they aren’t there.
Testers choose one of these values for each capability. We used an even number of values on purpose to keep testers from simply picking the middle value. It’s important to think about it a bit more carefully.
Estimating impact takes a similarly simplistic approach and is also based on choosing from an even number of possibilities (more examples from the Chrome browser):
• Minimal: A failure the user might not even notice.
• Example: Chrome Labs. This is optional functionality. Failure to load the chrome://labs page would affect few users. This page contains optional Chrome experimental features. Most users don’t even know they are there; the features themselves are labeled “use at your own risk” and don’t pose a threat to the core browser.
• Some: A failure that might annoy the user. If noticed, retry or recovery mechanisms are straightforward.
• Example: Refresh button. If this fails to refresh the current page, the user can retype the URL in the same tab, simply open a new tab to the URL, or even restart the browser in the extreme case. The cost of the failure is mostly annoyance.
• Considerable: A failure would block usage scenarios.
• Example: Chrome extensions. If users installed Chrome extensions to add functionality to their browser and those extensions failed to load in a new version of Chrome, the functionality of that extension is lost.
• Maximal: A failure would permanently damage the reputation of the product and cause users to stop using it.
• Example: Chrome’s autoupdate mechanism. Should this feature break, it would deny critical security updates or perhaps even lead the browser to stop working.
Sometimes the impact to the enterprise and the user are at odds. A banner ad that fails to load is a problem for Google but might not even be noticed by a user. It is good practice to note whether risk to the enterprise or risk to the user is being considered when assigning a score.
We can generate a heat map of risk areas of Google Sites based on the values entered by the tester and the Attribute-Component grid shown earlier. This appears in Figure 3.9.

Figure 3.9 Heat map of risk for attribute-component grid for an early version of Google+.
The entries in the grid light up as red, yellow, or green depending on the risk level of the components assigned to those intersections. It is a simple calculation of risk for each of the values you’ve entered—we simply take the average of each capability’s risk. GTA generates this map, but a spreadsheet can also be used.
This diagram represents the testable capabilities of the product and their risk as you assign the values. It’s difficult to keep bias from these numbers, and testers do represent a specific point of view. We’re careful to solicit feedback from other stakeholders as well. Following is a list of stakeholders and some suggestions about getting them involved in assigning these risk values:
• Developers: Most developers, when consulted, will assign the most risk to the features they own. If they wrote the code, they want tests for it! It’s been our experience that developers overrate the features they own.
• Program Managers: PMs are also humans and introduce their own biases. They favor the capabilities they see as most important. In general, they favor the features that make the software stand out from its competition and make it “pop.”
• Salespeople: Sales are the ones who get paid for attracting users. They are biased toward features that sell the product and look good in demos.
• Directors and VPs: Executives often highlight the features that set the software apart from its major competitors.
Obviously, all stakeholders have significant biases so our approach has been to solicit all their opinions and have them each separately score the capabilities using the previous two scales. It isn’t always easy to get their participation, but we’ve hit upon a strategy that has been successful. Instead of explaining the process and convincing them to help, we simply do it ourselves and present them with our heat map. Once they see our bias, they are quick to supply their own. Developers participate in mass if they know we are using the map to prioritize testing; the same goes for PMs and salespeople. They all have a stake in quality.
There is power in this approach. In determining risk ourselves, we have undoubtedly come to a conclusion they will argue with. Indeed, in presenting our risk analysis as the basis for all forthcoming tests, we have given them something to argue about! And that is the point. Instead of asking their opinions about a concept they consider nebulous, we have shown them a specific conclusion they can argue against. People are often ready to tell you what the answer is not. We also avoid having everyone wade through all data for which they have little interest or context. With this little ruse in our toolkit, we generally get a lot of focused input that we can factor into the risk calculations.
Once risk is generally agreed upon, it’s time to start mitigating it.
Risk Mitigation
Risk can rarely be eliminated. Driving is risky, yet we have places to go. Travel is risky, yet we do it anyway, and more often than not, the risk never manifests as any real injury. Why is this the case? Because we mitigate risks based on our actions. There are certain times of the day we choose not to drive and certain destinations to which we choose not to travel. This is mitigation.
For software, the ultimate mitigation is to simply eliminate the riskiest components: the less software we ship, the less risk we assume. But besides outright elimination of risk, there are many things we can do to mitigate risk:
• We can write user stories around risky capabilities to define paths of less risk and feed this back to development so that more constraints can be added to the app.
• We can write regression test cases to ensure that failures cannot be reintroduced without being detected.
• We can write and run tests to show the need for recovery and fallback features.
• We can add instrumentation and watchdog code to detect failures early.
• We can add instrumentation that notices behavioral changes across versions of the software that indicate a bug has regressed.
The exact mitigation needed depends greatly on the application and what users expect of its safety and security. For testers, we might be involved in the actual mitigation, but we are most certainly involved in exposing the risk. We proceed by prioritizing the capabilities marked in red over those in yellow or green. We want to test in the order of risk. This is important: If you can’t test everything, test the most important stuff first, and the most important stuff is the riskiest stuff.
Depending on the type of project, it is up to you the tester to advise about readiness to ship. A tester should be able to glance at the risk heat map and make a recommendation to other engineers whether the product is ready for release. If it is a Google Labs Experiment, it is probably fine to ship with some red areas as long as they don’t deal with privacy or security. If it is a major new release of Gmail, any yellows will likely be a blocking concern. The colors are also simple enough that even test directors can understand them.
Concerns about risk fade over time and a significant amount of successful testing is a good indication that risk is at acceptable levels. This makes it crucial that we tie test cases back to individual capabilities and back to attributes and components in the risk grid. Indeed, ACC fits this requirement perfectly and it’s why we designed it the way we did.
Last Words on Risk
Google Test Analytics supports risk analysis based on values of the categories (very rarely, seldom, occasionally, often) we presented earlier. We specifically do not want to turn risk analysis into a complicated effort or it won’t get done. We also aren’t concerned about the actual numbers and math because a single number in isolation means little anyway. Simply knowing something is more risky than something else is often enough. Risk is about choice, choosing one test over another because it tests a more risky area of the application. It is enough to know that A is riskier than B without paying too much attention to the exact risk value of either. Simply knowing that one feature is riskier than another allows an individual test manager to distribute testers to features more optimally and on an organizational level, it allows someone like Patrick Copeland to decide how many testers each product team is allocated. Understanding risk provides benefit at every level of the organization.
Risk analysis is a field of its own and taken very seriously in many different industries. We use a lightweight version here, but remain interested in additional research that can improve the way we test. If you want to read more about risk analysis, we suggest searching for Risk Management Methodology on Wikipedia. It will get you to a good starting point for a more in-depth treatment of this important topic.
GTA helps us identify risk, and testing is what helps us mitigate it. The Google TE is a facilitator of this mitigation. A TE might decide to perform tests in house on some of the riskier areas and might request regression tests to be added by SWEs and SETs. Other tools at the TE’s disposal include manual and exploratory testing and the use of dogfood users, beta users, and crowd sourcing.
The TE is responsible for understanding all the risk areas and creates mitigations using any and every tool he or she can get his hands on.
Here is a set of guidelines we’ve found helpful.
1. For every set of high-risk capabilities and attribute-component pairs that appear red in the GTA matrix, write a set of user stories, use cases, or test guidance that address them. Google TEs take personal responsibility for the highest risk areas, and even though they might coordinate with other TEs or use tools, the ultimate responsibility is their own.
2. Take a hard look at all the previous SET- and SWE-oriented testing that has occurred and assess its impact on the risk levels exposed in GTA. Was this testing well placed to manage the risk? Are there additional tests that need to be added? A TE might need to write these tests or negotiate with the attending SET or SWE to get them written. The important thing is not who does the coding, but that it gets done.
3. Analyze the bugs that have been reported against every high-risk attribute-capability pair and ensure that regression tests are written. Bugs have a tendency to recur as code is modified. Every bug in every high-risk component should have a regression test.
4. Think carefully about the high-risk areas and inquire about fallback and recovery mechanisms. Surface any concerns about user impact by coming up with worst-case scenarios and discussing them with other engineers. Try and determine how realistic the scenarios are. TEs who cry wolf too often won’t be listened to again. It’s important to reduce the shrill warnings unless they cover high-risk scenarios that are also very realistic and unmitigated by existing tests.
5. Involve as many concerned stakeholders as possible. Dogfood users are often internal and if left on their own will just use the system without providing a lot of input. Actively engage dogfood users. Specifically ask them to run certain experiments and scenarios. Ask them questions such as, “How does this work on your machine?” and “How would you use a feature like this one?” Dogfood users are numerous at Google, and TEs should be very active in pushing them for more than just casual use.
6. If none of the previous is working and a high-risk component continues to be under-tested and fails often, lobby hard for its removal. This is a chance to explain the concept of risk analysis to project owners and underscore the value a TE provides.
For less risky capabilities, we can be somewhat less insistent in our execution. We may decide that writing specific test cases for lower risk areas is too much investment for too little return. Instead, we might choose to perform exploratory testing or use crowd sourcing to handle these areas. The concept of “tours” as high-level guidance for exploratory testing5 is often used as direction for crowd source testers. “Run the Fed Ex tour on this set of capabilities” will often get far better results from the crowd than simply tossing them an app and hoping for the best. At once, we have identified the features we want testing and instructed them how to go about testing it.
The real power of the ACC is that it presents a set of capabilities that can be rank-ordered by risk and also parceled out in sections to various quality collaborators. The set of actual project TEs can be given different sets of capabilities to validate. Dogfood users, 20-percent contributors, contract testers, crowd testers, SWEs, SETs, and so on can all take a subset of capabilities and the TE can feel good about getting coverage of important areas with less overlap than simply throwing out the application to a free for all of usage.
The range of a TE, unlike that of an SET, does not stop when our software is released.
Life of a Test Case
Whether they come from user stories or from direct translation of capabilities, Google TEs create a large number of test cases that prescribe, in terms ranging from general to precise, inputs and data to test an application. Unlike code and automated test artifacts that are managed by common infrastructure, test case management is still a group-by-group thing, but a new tool is beginning to change all that.
Spreadsheets and documents have often been the tool of choice for storing test cases. Teams with rapid feature development and fast ship cycles aren’t too concerned with keeping test cases around for long. As new features arrive, they often invalidate the scripts, requiring all the tests to be rewritten. In such cases, documents that can be shared and then trashed are as suitable as any other format. Documents are also a suitable mechanism to describe the context of a test session as opposed to specific test case actions. Such tests are less prescriptive and more general suggestions about which feature areas to explore.
Of course, some teams have rather elaborate spreadsheets for storing test procedures and data and some teams even document ACC tables in spreadsheets because they are more flexible than Google Test Analytics (GTA). But this takes discipline and some continuity in the TE team as one TE’s procedure will be another TE’s shackles. Large team turnover requires a more structured approach, a structure that can outlast any individual team member.
Spreadsheets are preferred over documents because they provide convenient columns for procedure, data, and pass or fail tags, and they are easy to customize. Google Sites and other types of online wikis are often used to display the test information to other stakeholders. They can be easily shared and edited by anyone on the team.
As Google grew, many teams had a growing set of prescriptive test cases and regression tests that needed better management. Indeed, the test cases documented grew so large, they became burdensome to search and to share. Another solution was needed and some enterprising testers built a system called Test Scribe that was loosely based on any number of commercial tools and other homegrown test case management systems our testers were familiar with from previous employers.
Test Scribe stored test cases in a rigid schema and had the capability to include or exclude test cases from a specific test pass. It was a basic implementation and enthusiasm over using it and maintaining it was waning; however, many teams had taken dependencies on it and after nursing it along for a few quarters, it was trashed and a new tool was written in 2010 by a Senior SET named Jordanna Chord. Google Test Case Manager (GTCM) was born.
The idea behind GTCM was to make it simple to write tests, provide a flexible tagging format that can be tailored to any project, make the tests easily searchable and reusable, and, most importantly, integrate GTCM with the rest of Google’s infrastructure so that test results could become a first-class citizen. Figures 3.10 through 3.14 show various screenshots of GTCM. Figure 3.11 shows the page for creating test cases. Test cases can have arbitrary sections or labels. This allows GTCM to support everything from classic test and validation steps, to exploratory tours, cukes,7 and userstory descriptions, and some test teams even store code or data snippets in the GTCM test case itself. GTCM had to support a wide variety of test teams and their varied test case representations.
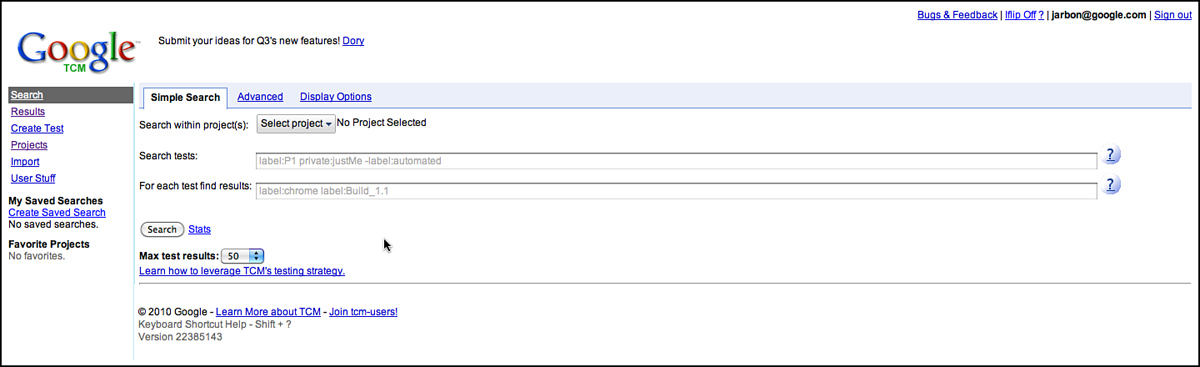
Figure 3.10 The GTCM home page is focused on the search experience.
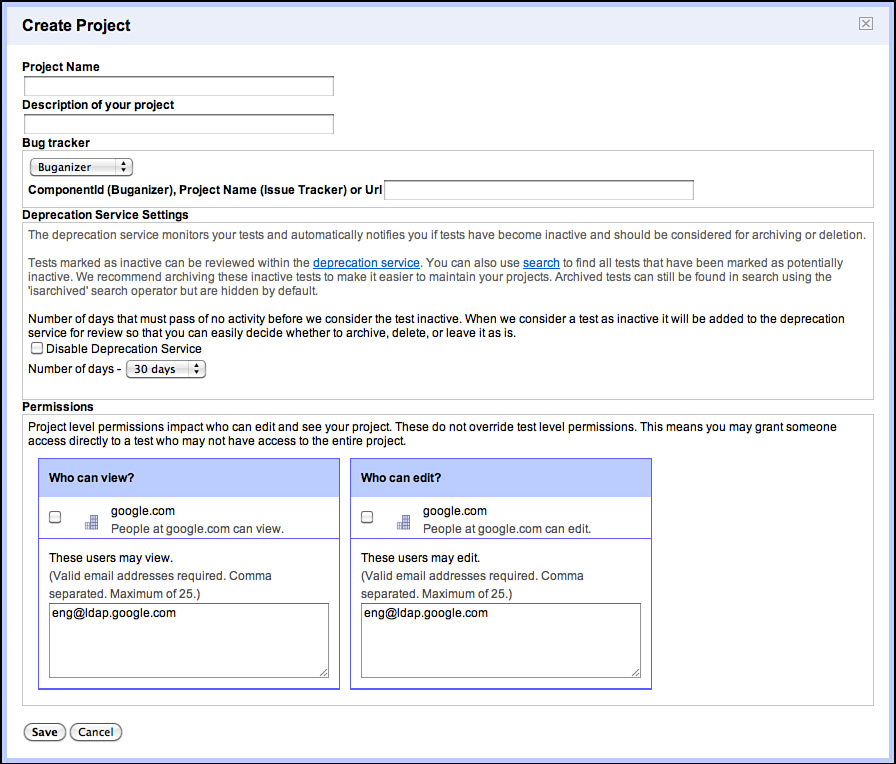
Figure 3.11 Creating a project in GTCM.
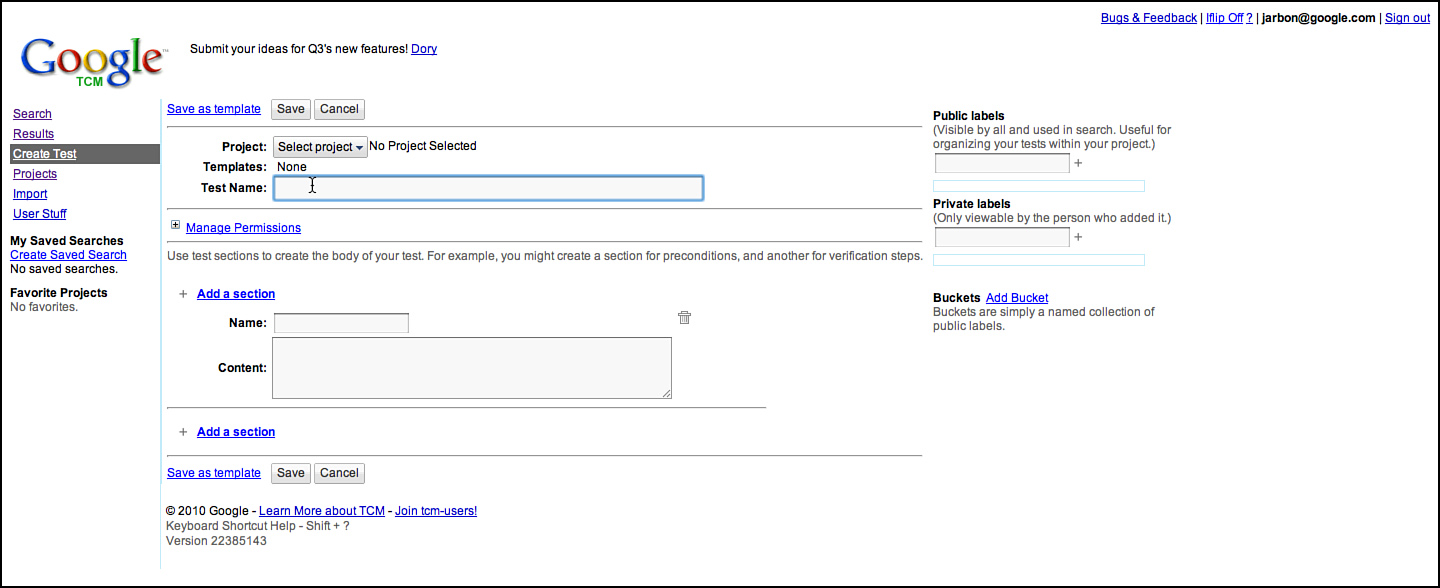
Figure 3.12 Creating a test in GTCM.
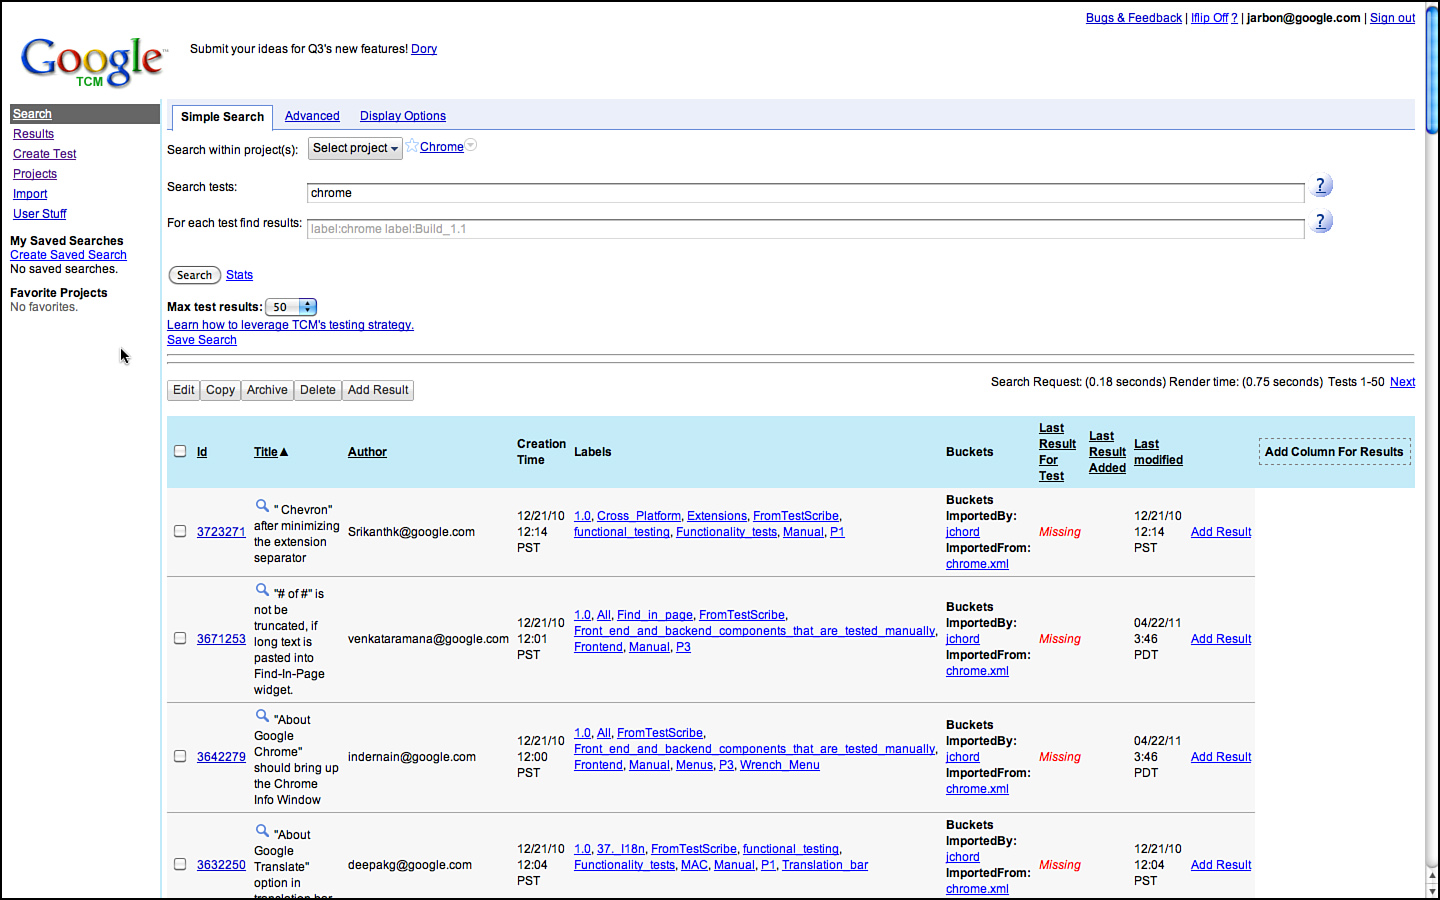
Figure 3.13 View of test cases when searching for Chrome in GTCM.
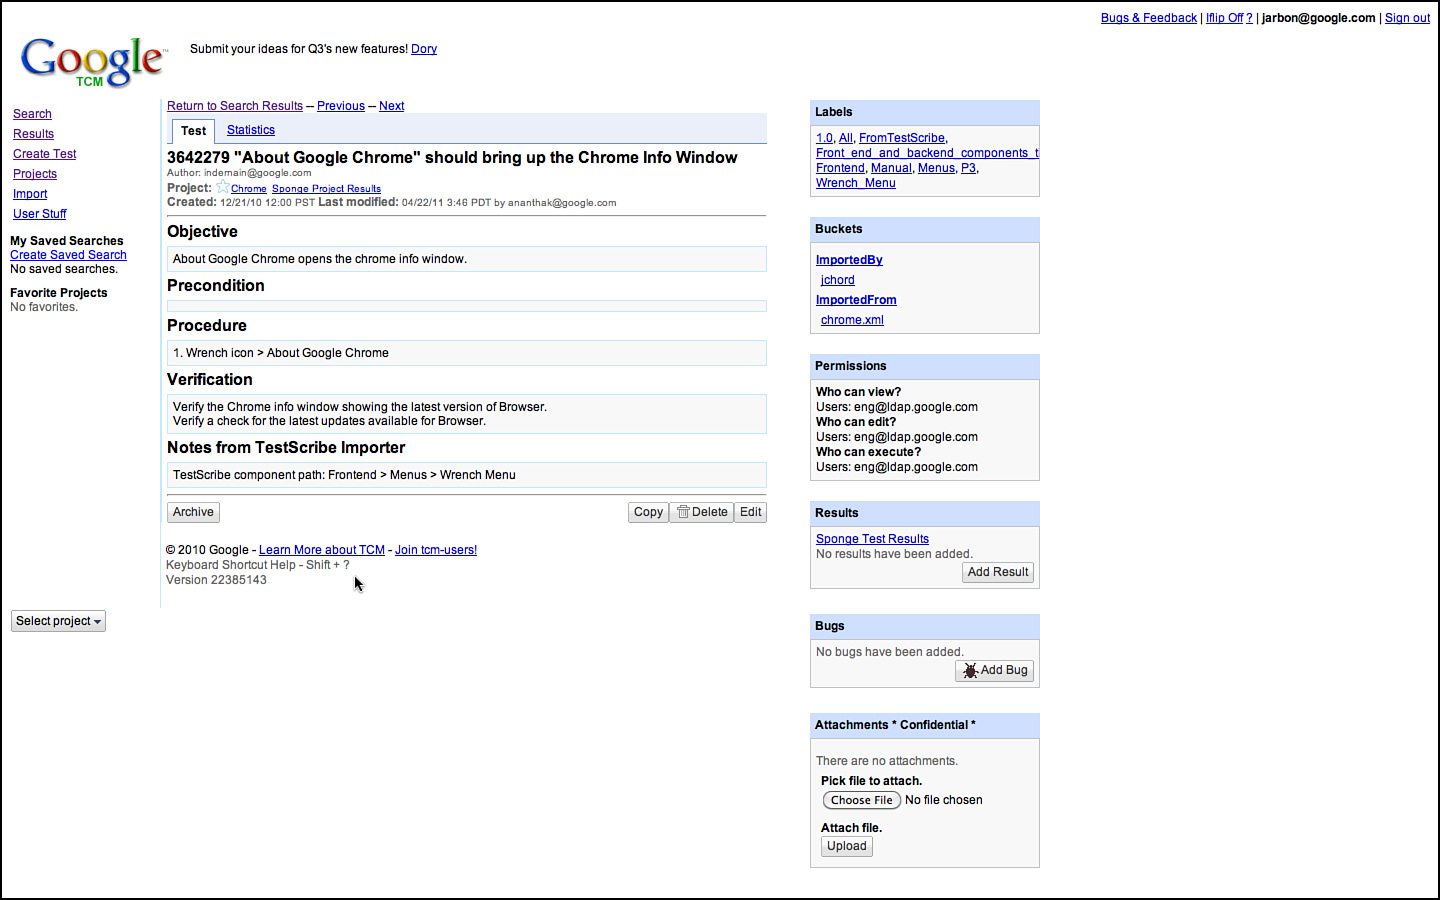
Figure 3.14 Simple test case for Chrome’s About dialog.
The metrics around GTCM are interesting to get a feel for what testers are doing with test cases in aggregate. The total number of tests and tests result trends are interesting, as shown in Figures 3.15 and 3.16. The total number of tests is reaching an asymptote. Basic analysis of why this is so is that Google is also deprecating older, more manual-regression focused projects, along with their tests. Also, GTCM largely holds manual tests, and many teams are replacing their manual testing with automation or external crowd-sourcing and exploratory testing, which is putting downward pressure on total test case counts in our internal TCM—even while coverage is going up. The numbers of tests logged are increasing as these numbers are dominated by several large and necessarily manually focused teams such as Android.
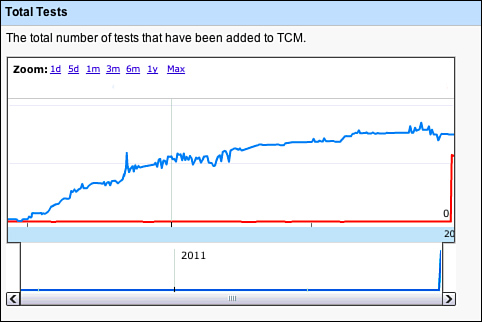
Figure 3.15 Test case counts over time in GTCM.
The total number of manual test results logged is increasing, as one would generally expect (see Figure 3.16).
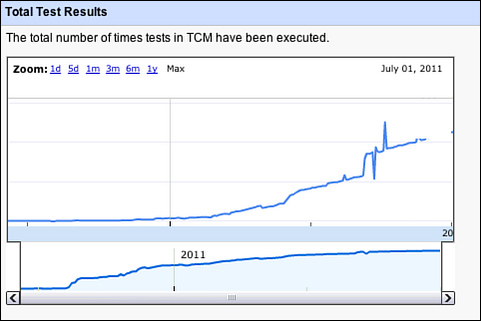
Figure 3.16 Test result counts over time in GTCM.
Taking a look of a plot of the number of bugs associated with GTCM, in Figure 3.17, is interesting to look at, but it also doesn’t tell the whole story. Google is bottom-up, so some teams are particular about tracking which bugs came from which test cases; others are much looser with their data, as they don’t find that information too valuable for the project. Also, some of these logged bugs are filed via automation; not all of these are from manual test execution.
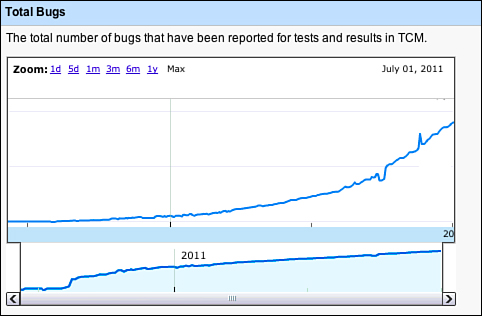
Figure 3.17 Total number of bugs logged during GTCM test execution over time.
A primary requirement of GTCM from day one was to have a clean and simple API. TestScribe technically had an API, but was SOAP-like and the authentication scheme was so painful that few people used it. And, as security tightened internally, the original authentication mode used made it too awkward to use. To resolve all these issues, GTCM now has a restful JSON API.
The team intends to open GTCM up for general external usage soon. We also hope to open source this test case database for the world to collectively maintain. GTCM was also designed with external re-use in mind. It is built on a Google App Engine for scalability and also to allow other testers outside of Google to host their own instance if they prefer. GTCM’s internals are also designed to abstract much of the logic and UI from Google App Engine, so it can be ported to other stacks if people prefer. Watch the Google Testing Blog for any updates on these efforts.
Life of a Bug
Bugs and bug reports are the one artifact every tester understands. Finding bugs, triaging bugs, fixing bugs, and regressing bugs are the heartbeat and workflow for software quality. This is the part of testing that is the most conventional at Google, but there are still a few interesting deviations from the norm. For this section, we ignore the bugs that are filed to track work items and use the term to identify actual broken code. As such, bugs often represent the hour-to-hour and day-to-day workflow for engineering teams.
A bug is born. Bugs are found and filed by everyone at Google. Product Managers file bugs when they catch issues in the early builds that differ form their specifications/thoughts. Developers file bugs when they realize they accidentally checked in an issue, or find an issue somewhere else in the codebase, or while dogfooding Google products. Bugs also come in from the field, from crowd-sourced testers, external vendor testing, and are filed by Community Managers monitoring the product-specific Google Groups. Many internal versions of apps also have quick one-click ways to file bugs, like Google maps. And, sometimes, software programs create bugs via an API.
Because the tracking and workflow around a bug is such a large part of what engineers do, a great deal of effort has been expended to automate this process. Google’s first bug database was called BugsDB. It was nothing more than a few database tables to store information and a set of queries to retrieve bugs and compute statistics about them. BugDB was used until 2005 when a couple of enterprising engineers, Ted Mao8 and Ravi Gampala, created “Buganizer.”
The key motivations for Buganizer were:
• More flexible n-level component hierarchy to replace the simple Project > Component > Version hierarchy used in BugDB (and all the other commercial bug databases at that time)
• Better accountability for bug tracking and a new workflow around triage and maintenance
• Easier tracking of a group of bugs with the capability to create and manage hotlists
• Improved security with login authentication
• The capability to create summary charts and reports
• Full text search and change history
• Default settings for bugs
• Improved usability and a more intuitive UI
Some Buganizer Trivia and Metrics
The oldlest bug filed and still in existence: May 18, 2001, 15:33. The title is Test Bug. The body of the documentation is “First Bug!.” Interestingly, this bug is often used accidentally when developers are asked to provide a bug that their CL fixes.
The oldest active bug was filed in March of 1999. This bug suggests a performance investigation to reduce latency for serving for ads based on geographic region. The last activity was in 2009. The last edit said that this could be investigated, but that it would require architectural work, and the latency metrics are just fine.
Here are some bug charts of overall bug activity at Google. Some of these are filed automatically and some manually; these are aggregate information. Some of the automation dominates these bug trends, and we don’t highlight any single teams here, but it is interesting nonetheless.
As you can see in Figure 3.18, there are many P29 bugs, far fewer P1, and even fewer P0 bugs. Correlation is not causation, but it can be a sign that the engineering methodology described in this book works. It might also be that no one bothers to file P1 issues, but that isn’t what we see anecdotally. P3 and P4 bugs are often not filed as they are rarely looked at.
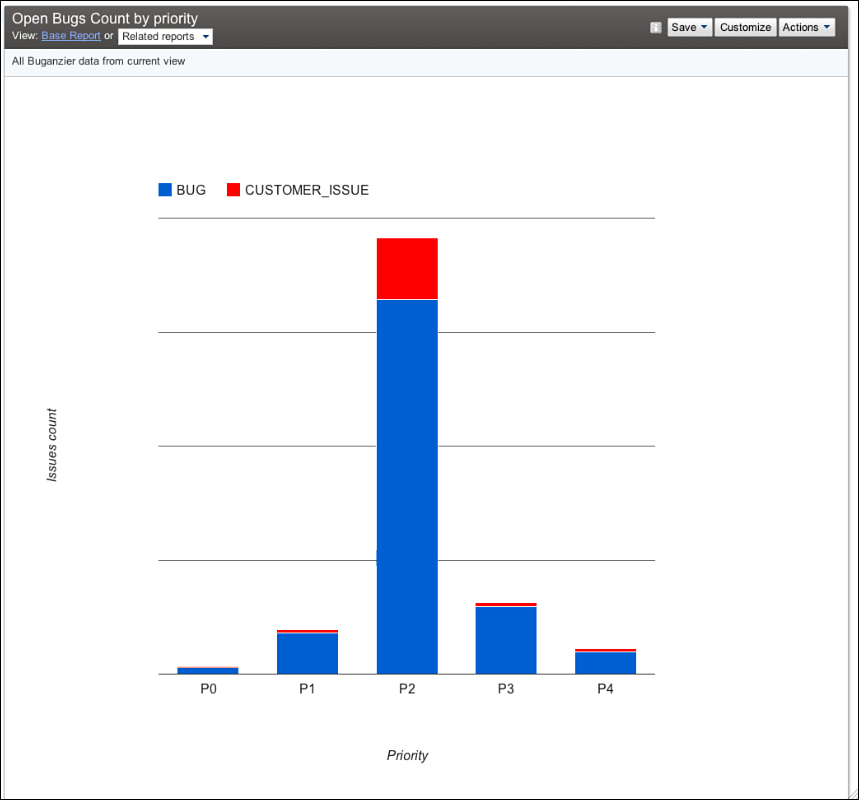
Figure 3.18 Number of bugs in Buganizer by priority.
The average age of bugs is also generally what would be expected (see Figure 3.19). The anomaly seems to be with P0 bugs. In practice, though, P0 bugs are often more difficult to fix as they represent severe design or deployment issues, which are often complex to debug and resolve. The rest of the bugs on average take longer to fix, with increasing priority numbers, as they are less important.

Figure 3.19 Average age of bugs in Buganizer.
The chart for the number of bugs found over time in Figure 3.20 shows a slight uptick in bugs found each month. We don’t systematically understand why this is increasing. The obvious explanation is that we have more code and more coders over time, but the bug rate increases at a rate lower than the increase in number of testers and developers. Perhaps either our code is getting better with quality controls or we aren’t finding as many of them.
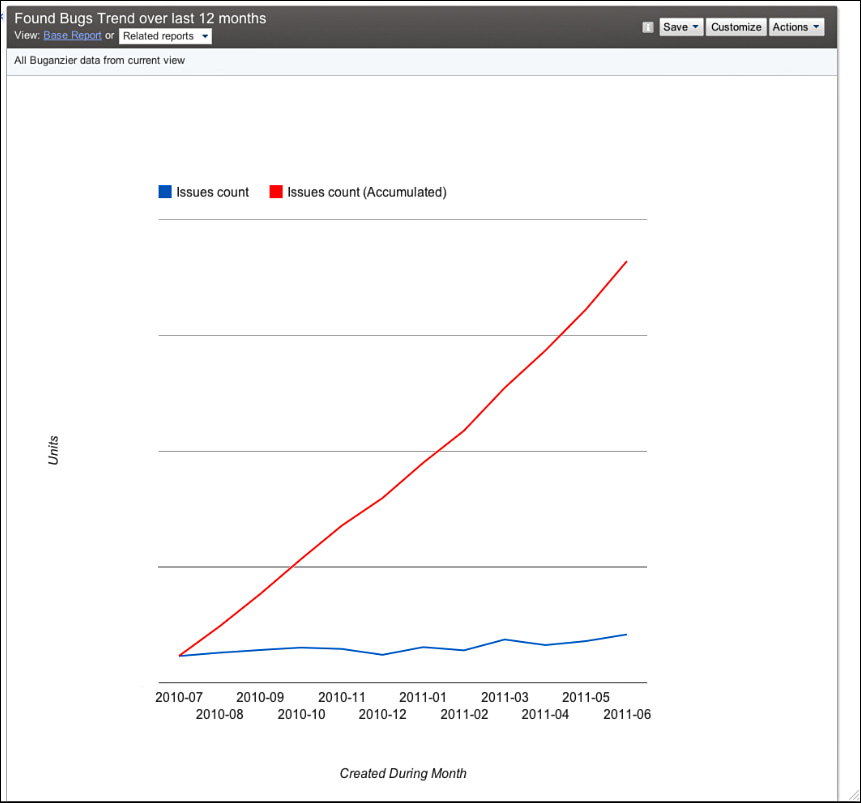
Figure 3.20 Trend of bugs found.
Our fix rate in Figure 3.21 shows that teams generally have a handle on the bug rate. Many teams simply stop adding features when the incoming bug rate exceeds the team’s ability to fix them. This practice is highly recommended versus focusing on the feature or code-complete milestones. Focus on small bits of tested code, incrementally testing, and dogfooding help keep bug rates in check.
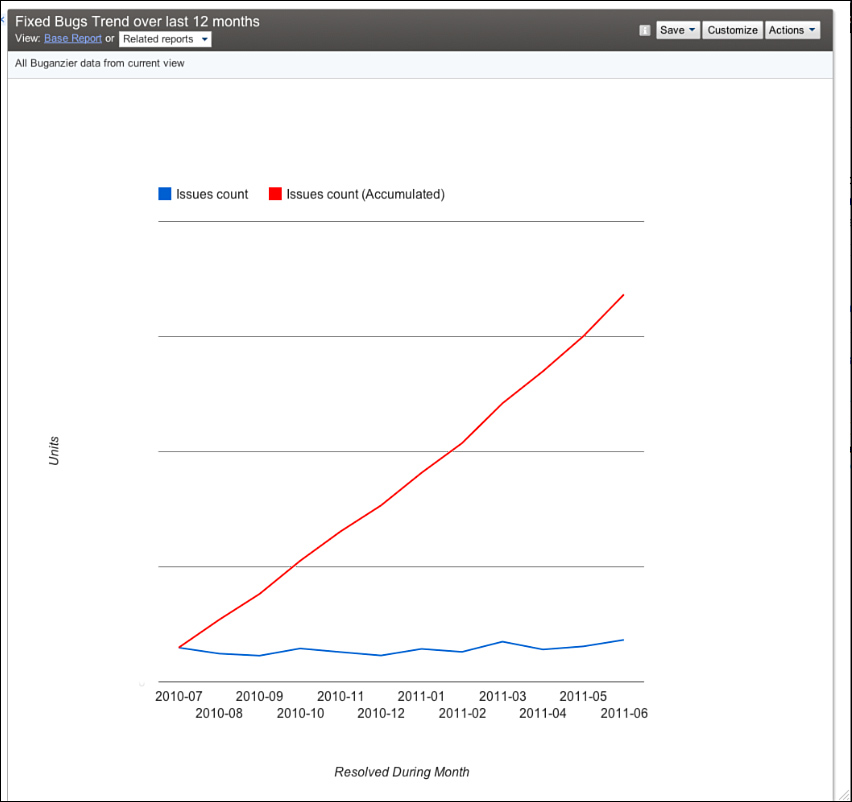
Figure 3.21 Bugs fixed over time. It’s a good thing this looks similar to the trend of bugs found!
As Google’s products have moved more into the open, such as Chrome and Chrome OS, it’s no longer possible to maintain a single bug database. These projects also deal with externally visible bug databases such as Mozilla’s Bugzilla for WebKit issues and issue tracker for chromium.org issues. Googlers are encouraged to file issues in any product they see, including those from competitive products. The primary goal is making the Web as a whole better.
Issue Tracker is the core repository for all Chrome and Chrome OS bugs. Its bug database is public. This means anyone can look at the bug activity, even the press. Security bugs are sometimes hidden between the time they are found and fixed to avoid tipping off hackers, but other than that, it is a public bug database. External users are free to file bugs, and they are a valuable source of bug information. Figures 3.22 and 3.23 show searching and finding a bug related to the Chrome logo in the About box.
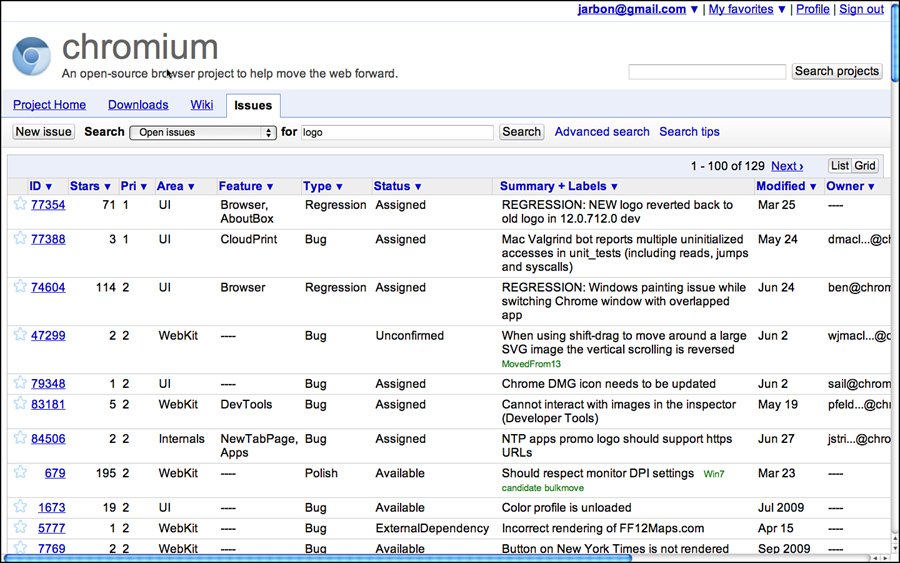
Figure 3.22 Issue tracker search.

Figure 3.23 Open issue in Chromium Issue Tracker.
However, the longest-lived and most widely used piece of testing infrastructure at Google is Buganizer and it deserves further discussion. For the most part, it is a typical bug database, but it also supports the core quality cycle of tracking problems in our software, from discovery to resolution, and in building regression test cases. Buganizer is also built on top of Google’s latest core storage technology for scale and speed.
Bugs are filed with a subset of the following fields, very few of which are required, and their definition is deliberately not well defined so individual teams can decide how they want to manage the information to fit their own workflow.
• Assigned to (Assignee)
[Optional] LDAP name of one person who should take the next step in handling this issue. This person is automatically emailed when the issue is created and whenever anyone changes the value of any field in the issue. Buganizer administrators specify a default assignee for every component.
• CC
[Optional] Zero or more LDAP names of people to email when an issue is created or modified. Names are LDAP or mailing list names only, no @google, so only Google mailing lists or employees are valid entries. This is a comma-delimited list. Do not include the “Assign to” name when filing an issue, because this person is emailed by default.
• Attachments
[Optional] Zero or more attachments to the bug. Any file type is accepted. There is no limit to the number of attachments for an issue, but the maximum total size of each attachment is 100MB.
• Blocking
[Optional] The IDs of bugs that this bug prevents from being resolved. This is a comma-delimited list. Updating this list will automatically update the Depends On field in the listed bugs.
• Depends On
[Optional] The IDs of bugs that must be fixed before this bug can be fixed. Updating this list will automatically update the Blocking field of all listed bugs. This is a comma-delimited list.
• Changed
[Read-only] The date and time when any value in the issue was last changed.
• Changelists
[Optional] Zero or more change list (CL) numbers for CLs dealing with this issue in some way. Only specify CLs that have been submitted; do not specify pending CLs.
[Required] The thing that has the bug or feature request if it is known. When filing an issue, this should be a complete path to the component. An infinitely long path is now supported. When filing an issue, you do not need to assign the issue to a leaf component (that is, one without children).
Additional components can be created only by project and engineering managers.
• Created
[Read-only] The date when the bug was created.
• Found In
[Optional] Use for versioning by entering the number of the software version where you found the issue, such as 1.1.
• Last modified
[Read-only] The date that any field in the issue was last modified.
• Notes
[Optional] Detailed description of the problem and running comments as the issue is handled over time. When filing the issue, describe the steps required to reproduce a bug or how to get to a screen involving a feature request. The more information you put here, the less likely future issue handlers will need to contact you. You cannot edit previous entries in the Notes field, not even if you added them; you can add only new values to the Notes field.
• Priority
[Required] The importance of a bug, where P0 is the highest priority. This indicates how soon it should be fixed and how many resources should be allocated to fix it. For example, misspelling “Google” in the search page logo would be low severity (the page function would not be affected), but high priority (it would be a Very Bad Thing). Setting both fields lets the bug fix team allocate its time more wisely. See also the Severity description.
• Reported by (Reporter)
[Read-only] The Google login of the person who originally reported the bug. The default value is assigned to the person creating the bug, but this can be modified to give credit where credit is due.
• Resolution
[Optional, entered by Buganizer] The final action chosen by the verifier. Values include Not feasible, Works as intended, Not repeatable, Obsolete, Duplicate, and Fixed.
[Required] How much the bug affects the use of the product, where S0 is the most severe. Setting both priority and severity can help prioritize the importance of this bug to bug fixers. For example, misspelling “Google” in the search page logo would be low severity (the page function would not be affected), but high priority (it would be a Very Bad Thing). Setting both fields lets the bug fix team allocate its time more wisely. Severity values have the following text equivalents:
— s0 = System unusable
— s1 = High
— s2 = Medium
— s3 = Low
— s4 = No effect on system
• Status
[Required] The current state of the bug. See Life of an issue (see Figure 3.24) for details on how these values are set in the issue. Available statuses include the following:
— New: The issue has just been created and not assigned yet.
— Assigned: An assignee has been specified.
— Accepted: The assignee has accepted the issue.
— Fix later: The assignee has decided that the issue will be fixed in the future.
— Will not fix: The assignee has decided that the issue will not be fixed for some reason.
— Fixed: The issue has been fixed, but the fix has not been verified.
— Verifier assigned: A verifier has been assigned to the issue.
— Verified: The fix has been verified by the verifier.
• Summary
[Required] A descriptive summary of this issue. Be sure to make this as descriptive as possible; when scrolling through a list of issues in a search result, this is what helps the user decide whether or not to examine the issue further.
• Targeted To
[Optional] Use for versioning by entering the number of the software version in which the issue should be fixed, such as 1.2.
[Required] What type of issue:
— Bug: Something that causes the program not to work as expected
— Feature request: Something you would like to see added to the program
— Customer issue: A training issue or general discussion
— Internal cleanup: Something requiring maintenance
— Process: Something tracked automatically via the API
• Verified In
[Optional] Use for versioning by entering the number of the software version where the issue fix was verified, such as 1.2.
• Verifier
[Required before issue can be resolved] Each issue is assigned one person who has the right to mark the issue as resolved. This person need not be assigned until the issue is ready to be resolved, but the verifier is the only one who can change the status to “Verified” (the issue is closed). The verifier can be the same person as the assignee.
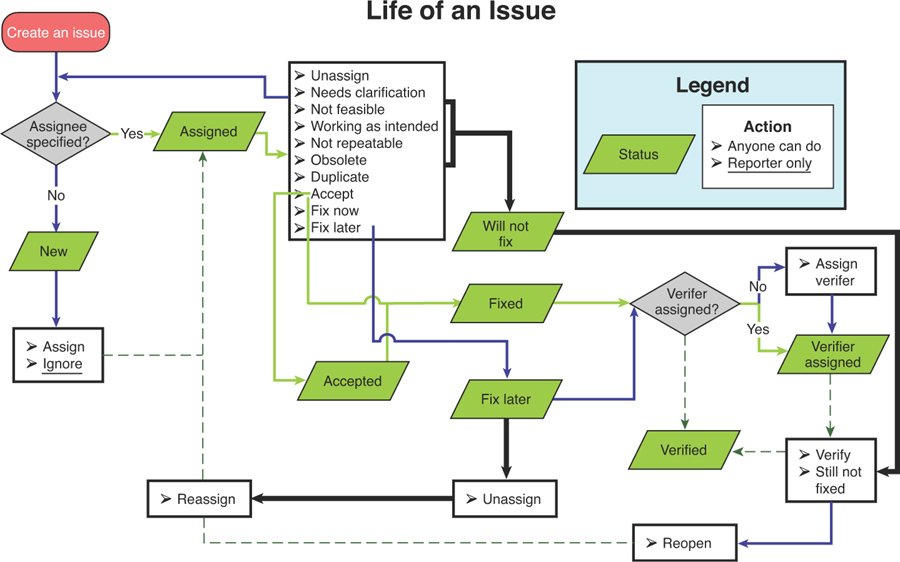
Figure 3.24 The basic workflow for bugs in a Buganizer world.
Figure 3.24 summarizes the life of an issue.
A few key differences between bugs at Google and elsewhere:
• For the most part, the bug database is completely open. Any Googler can see any bug in any project.
• Everyone files bugs, including engineering directors and (Senior Vice Presidents (SVPs). Googlers file bugs against products they use even if they are not part of that product team. Groups of testers often “dog pile” on a product just to be helpful.
• There are no formal top-down bug triage processes. How bugs are triaged10 varies widely from team to team. Sometimes it’s an individual task or a TE and SWE do it together informally at one or the other’s desk. Sometimes triage is part of a weekly or daily standup meeting. The team figures out who should be there and what works best. There are no formal methods or dashboards for triaging or big brothers checking in on a team. Google leaves this up to the individual teams to decide.
Google projects are often in one of two states: new and rapid development swamped with a continual stream of issues or established infrastructure released incrementally and with so much upfront unit testing and fault tolerance that bugs aren’t very common and kept to a small and manageable number.
The dream of a unified dashboard has haunted Googlers, much like it has at many other companies. Every year or so, a new effort tried to take root to build a centralized bug or project dashboard for all projects at Google. It makes sense, even if confined only to Buganizer data. But, as each group has different ideas of what metrics are important for shipping and for day-to-day health of the projects, these projects have consistently not gotten far off the ground. This idea may be useful at more uniform companies, but at Google, well-intentioned folks often keep ending up frustrated due to the variety of projects and engineering at Google.
A Google-scale approach to filing bugs was started by the Google Feedback team11 (http://www.google.com/tools/feedback/intl/en/index.html). Google Feedback enables end users to file bugs against select Google services. The general idea is that external users don’t have full context on what bugs have already been filed, or even already fixed, and we want to make it quick and easy to get feedback from users. So, Google testers and software engineers have made it point-and-click simple for users to file a bug. The engineers on this team have gone to great lengths to ensure that users can intuitively omit parts of the page that might contain private data when filing bugs back to Google (see Figure 3.25).
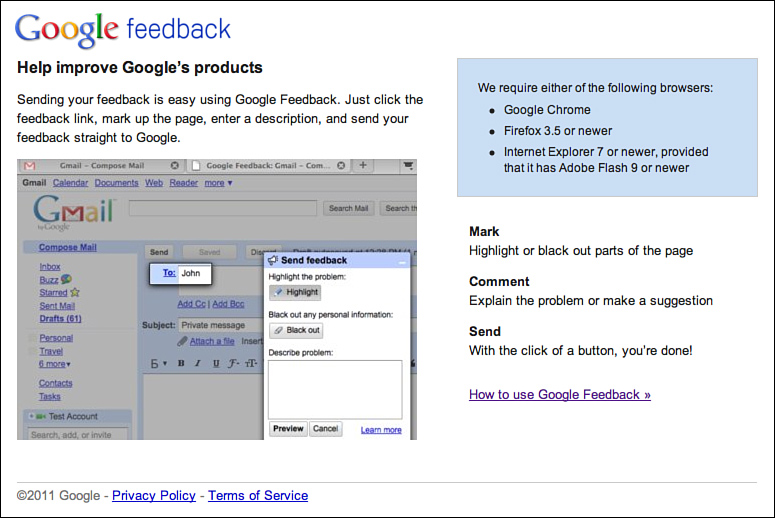
Figure 3.25 Google Feedback shown with privacy filtering.
The Google Feedback team has done some very cool work to avoid blindly dropping these bugs from the wild into our bug databases, as duplicate issues can overwhelm the bug triage process. They use clustering algorithms automatically to de-dupe and identify the top issues coming in. Google Feedback has a helpful dashboard showing this processed data of user-reported issues to the product team for analysis. It is not unusual for many tens of thousands of pieces of feedback to pour in the week after a major application launch—and have them boil down to just 10 or so major and common issues. This saves a lot of engineering time and makes it possible for Google to actually listen to end users without having to process each individual piece of feedback that would be prohibitive. The team is beta testing this with a small set of Google properties, but aims to provide this for all Google properties in the future.
Recruiting TEs
Google takes hiring engineers seriously. In general, our engineers have computer science or related degrees from accredited universities. However, few schools systematically teach software testing. This makes hiring good testers a challenge for any company, because the right mix of coding and testing skills is truly rare.
The TE role is particularly difficult to hire because the best ones aren’t raw algorithm, theorem-proving, function-implementing people. Google TEs break the mold of the SWE/SET that we have traditionally built our recruiting and interviewing process around. To be honest, we haven’t always gotten it right. Indeed, we owe apologies to all the testers caught up in our early attempts to perfect our TE interview process. TEs are rare individuals. They are technical, care about the user, and understand the product at a system and end-to-end perspective. They are relentless, great negotiators, and most importantly, they are creative and able to deal with ambiguity. It’s a small wonder Google, or any company for that matter, struggles to hire them.
It is often forgotten, but testing is also largely about validation. Does the application do what it is supposed to do? Much of the testing work is planning the execution and performing the validation. Crashes happen, but aren’t always the goal. Bending the software until it breaks might be interesting, but even more interesting is bending it a little bit over and over repeatedly, simulating actual usage, and making sure it doesn’t break under those conditions. We look for this positive viewpoint of testing when we interview.
Over the years, we tried a number of interview styles for TEs:
• Interview them as an SET. If a candidate is smart and creative but doesn’t meet the coding bar, then we’d consider him for a TE role. This caused lots of problems, including a virtual hierarchy within the test team, and worse, it filtered out a lot of folks focused on user-centric things, such as usability and end-to-end testing, that we were wrong to exclude.
• Deemphasize the coding requirement: If we focus only on user-centric and functional testing, then we vastly increase the size of the candidate pool. A candidate who can’t write code to solve a Sudoku puzzle or optimize a quick sort algorithm doesn’t mean he doesn’t have the ability to be a tester. This might be a route to get more TEs into the company, but it is not a route that sets them up for success once they are inside. The Google coding culture and computer science-centric skills among its engineering population are at odds with the career development of a strictly high-level tester.
• Use a hybrid middle ground: Today we interview for general computer science and technical skills combined with a strong requirement for testing aptitude. Knowledge of coding is necessary but tends toward the coding skills necessary for the TE work described previously: the modification of code over its creation and the ability to script end-to-end user scenarios. This, combined with excelling in TE-specific attributes such as communication, system-level understanding, and user empathy usually get you in the door and set the stage for internal advancement and promotion.
TEs are difficult to hire because they have to be good at many things, any one of which has the chance to derail the interview process. They are the jack-of-all-trades, and the stronger ones are often looked to as the final go or no-go decider in releasing products and new versions into the wild. If we didn’t take the quality of these individuals seriously, we would be in some serious trouble.
As a result of these filters, TEs can adapt to almost any product and role needed. From building tools, engaging customers, coordinating with other teams and dependencies, and so on, TEs often take a leadership role with respect to SETs as they have a broader perspective of what needs to get done and they can understand the design issues and risks.
Google has built up its TE ranks as our products have become more complex and with more UI than google.com. As our products have impacted many more users and become a more critical piece of users’ lives, the TE role has emerged as crucial to the Google culture.
Interviewing TEs
When we find the right mix of skills, we bring a candidate in for an interview. We are often asked how we interview TEs; indeed, it ranks as the most common question we receive on our blog and when we speak at public events. We’re not willing to give up the entire set of questions we ask, but here is a sampling (which will be deprecated now that they are public!) to give you insight into our thinking.
To begin, we probe for test aptitude. Our intent is to find out whether the candidate is more than just bright and creative, and whether he has a natural knack for testing. We are looking for innate curiosity about how things are built and what combinations of variables and configurations are possible and interesting to test. We are looking for a strong sense of how things should work and the ability to articulate it. We are also looking for a strong personality.
The idea here is to give a testing problem that requires a variety of input and environmental conditions and then to ask the candidate to enumerate the most interesting ones. On a simple level, we might ask a candidate to test a web page (see Figure 3.26) with single text input box and a button labeled count which, when pressed, computes the number of As in the text string. The question: Come up with a list of input strings you would want to test.

Figure 3.26 Sample UI for test question.
Some candidates just dive right in and start listing test cases. This is often a dangerous signal because they haven’t thought about the problem enough. The tendency to focus on quantity over quality is something we have learned to interpret as a negative (mostly through experience) because it is an inefficient way to work. You can learn a lot about a candidate by just looking at how they approach a problem before they even get to their solution.
Better is the candidate who asks clarifying questions: Capital or lowercase? Only English? Is the text cleared after the answer is computed? What about repeated button presses? And so on.
When the problem is clarified, candidates then start listing test cases. It is important to see whether they have some method to their madness. Are they just looking to break the software or also looking to validate that it works? Do they know when they are doing the former or the latter? Do they start with the obvious simple stuff first so they can find big bugs as quickly as possible? Can they figure out how to clearly represent their test plan/data? Random ordering of strings on a white board doesn’t indicate clarity of thought, and their test plans are likely to be ragged if they bother to plan at all. A typical list might look something like this:
• “banana”: 3 (An actual word.)
• “A” and “a”: 1 (A simple legal case with a positive result.)
• “”: 0 (A simple legal case with a zero result.)
• null: 0 (Simple error case.)
• “AA” and “aa”: 2 (A case where the count is > 1 and all As.)
• “b”: 0 (A simple, nonblank legal case with a negative result.)
• “aba”: 2 (Target character at the beginning and end to look for an off-by-one loops bug.)
• “bab”: 1 (Target character in the middle of the string.)
• space/tabs/etc.: N (Whitespace characters mixed with N As.)
• long string without As: N, where N > 0
• long string with As: N, where N is equal to the number of As
• X X in the string: N, where N is equal to the number of As (Format characters.)
• {java/C/HTML/JavaScript}: N, where N is equal to the number of As (Executable characters, or errors or accidental interpretation of code.)
Missing several of the previous tests is a bad indicator.
Better candidates discuss more advanced testing issues and rise above the specifics of input selection. They might
• Question the look and feel, color palette, and contrast. Is it consistent with related applications? Is it accessible for the visually impaired, and so on?
• Worry that the text box is too small/suggest that it be long enough to accommodate the longer strings that can be entered.
• Wonder about multiple instances of this application on the same server. Is there a chance for crosstalk between users?
• Ask the question, “Is the data recorded?” It might contain addresses or other personally identifiable information.
• Suggest automation with some real-world data, such as drawing from a dictionary of words or text selections from books.
• Ask the questions, “Is it fast enough? Will it be fast enough under load?”
• Ask the questions, “Is it discoverable? How do users find this page?”
• Enter HTML and JavaScript. Does it break the page rendering?
• Ask whether it should count capital or lowercase As, or both.
• Try copying and pasting strings.
Some concepts are even more advanced and indicate an experienced and valuable testing mind willing to look past only the problem presented. They might
• Realize that if the count is passed to the server via a URL-encoded HTTP GET request, the string can be clipped as it bounces across the Net. Therefore, there is no guarantee how long the supported URL can be.
• Suggest the application be parameterized. Why count only As?
• Consider counting other As in other languages (such as angstrom or umlaut).
• Consider whether this application can be internationalized.
• Think about writing scripts or manually sampling string lengths, say by powers of 2, to find the limits and ensure that string lengths in between would work.
• Consider the implementation and code behind this. There might be a counter to walk the string and another to keep track of how many As have been encountered (accumulator). So, it’s interesting to vary both the total number of As and the length of a string of As around interesting boundary values.
• Ask the questions, “Can the HTTP POST method and parameters be hacked? Perhaps there is security vulnerability?”
• Generate test input and validation with script to create interesting permutations and combinations of string properties such as length, number of As, and so on.
Digging into the issue of what length strings the candidate uses as test cases often reveals a lot about how well they will do on the job. If candidates cannot be more technically specific than “long strings,” which is an all too frequent answer, then that is a bad sign. More technical candidates will ask what the specification for the string is and then provide boundary tests around these limits. For example, if the limit is 1,000 characters, they will try 999, 1,000, and 1,001. The best candidates will also try 2^32, and many interesting values in between, such as powers of two and ten. It is important that candidates show an understanding of which values are important versus just random numbers—they need to have some understanding of the underlying algorithms, language, runtime, and hardware because this is where the faults most often live. They will also try lengths based on possible implementation details, and think of counters and pointers and off-by-one possibilities. The very best ones will realize the system might be stateful and that tests must take into account previous values entered. Thus, trying the same string multiple times or a zero length after a 1,000-length string become important cases.
Another key characteristic often looked for in interviewing is the ability for the TE to deal with ambiguity and push back on goofy ideas. We often change specifications or specify a behavior that doesn’t make sense when candidates ask clarifying questions. How they deal with this ambiguity can reveal a lot about how well they will do on the job. At Google, specifications are often moving targets and open to interpretation and modification given the pace of our release cycles. Suggesting that the maximum length of five characters is odd and would likely frustrate users is a great indicator that they are thinking of the user. Candidates who accept this blindly and move on might do the same on the job and end up validating goofy behavior. Candidates who push back or question specifications will often do wonders on the job, as long as they can do it diplomatically.
The final part of our TE interviews is probing for what we call “Googliness.” We want curious, passionate engineers who don’t just do what they are told but investigate options and do things outside the direction job description. Job responsibilities must get done, but life and work should be about maximum impact on the world around you. We want people who are connected to the world around them and the larger computer science community. People who file bugs on open-source projects are one example or those who generalize their work for reuse are another. We want to hire people who are enjoyable to work with, get along well with others, and who add to our culture here. We want engineers who want to continue to learn and grow. We also want people who we can learn from as well—people with new ideas and experiences that will add to our collective talent pool. With a corporate motto of “do no evil,” we want people who will call out evil if they see it!
Interviewing at big technology companies is intimidating. We know because it was intimidating to us! Many don’t make it through the first time around and require a practice round to get it right. We’re not trying to be harsh; we are trying to ensure that we find people who can contribute and when they become Google TEs, can grow in their role. It has to be good for the company and the candidate. Google, like most companies intent on keeping a small-company feel despite the big company numbers, tends to err on the side of caution. We want Google to be a place we want to continue to work for many years to come. Hiring the right people is the best way to ensure that!
Test Leadership at Google
We sometimes joke that we are only good at managing highly skilled, highly motivated, and autonomous engineers. The truth about managing TEs at Google is that it is difficult. The problems are focused on inspiring versus commanding and ensuring there is a coherence and focus to the team while encouraging experimentation and trusting folks to make the right decisions as much as possible on their own. This is actually tough work.
Leading and managing testers at Google is likely the thing most different from other testing shops. There are several forces at work at Google driving these differences, namely: far fewer testers, hiring competent folks, and a healthy respect for diversity and autonomy. Test management at Google is much more about inspiring than actively managing. It is more about strategy than day-to-day or week-to-week execution. That said, this leaves engineering management in an open-ended and often more complex position than that typical of the places we’ve worked before. The key aspects of test management and leadership at Google are leadership and vision, negotiation, external communication, technical competence, strategic initiatives, recruiting and interviewing, and driving the review performance of the team.
Generally, there is tension in Google when there is too much management and structure. Google test directors, managers, and leaders all try to walk this tightrope of trusting the engineers, but ensuring they don’t walk off a cliff or waste their time. Google invests in large-scale and strategic solutions and approaches to problems. Managers help avoid developing duplicate of test frameworks, over invest in small tests, and often encourage the pooling of engineers for larger test execution and infrastructure efforts. Without this oversight, test engineering projects often die on the vine if left to individual engineers, or only organic 20 percent time.
There are several types of leaders and managers at Google. The roles are the tech lead, the tech lead manager, the engineering manager, and the director.
• Tech lead: Tech leads in test emerge on the larger teams where there is a cluster of SETs or TEs on a larger project where they share common technical problems, infrastructure, and so on. They usually do not manage people. This also happens on teams building product-independent infrastructure. If you think of who this person is, he is the go-to person for technical and or testing problems on the team. This role is often informal and organically decided on based on team dynamics. These folks are focused on a single project at a time.
• Tech lead manager (TLM): This interesting creature appears when the go-to person is officially the manager for a set of commonly focused engineers and is also the go-to person for technical issues. These people are often highly respected and effective. They are often focused on only one primary project at a time.
• Test engineering manager: Engineering managers oversee the engineering work across multiple teams and almost always “come up through the ranks.” These positions are roughly equivalent to the industry standard test manager role, but with the breadth of context typical of a director at many other companies due to lower density of test resources on projects. These folks typically manage from as few as 12 to up to 35 folks depending on the complexity of the work. They focus on cross-team sharing of tools and processes, load balancing people across teams based on risk assessments, and steering the recruiting and interview and hiring pipelines.
• Test director: There are only a few test directors. Test directors more or less drive several test-engineering managers across sever products. They work on overall scoping the testing work and driving strategic and sometimes transformative technical infrastructure or testing methodologies. Their focus is on how quality and testing affect the business (rough cost analysis, benefit analysis, and so on), and often has an external bent—sharing externally with the industry. These folks often have between 40 and 70 reports. They are closely aligned with high-level groups or “focus areas,” such as Client, Apps, Ads, and so on.
• Senior test director: There is only one (Pat Copeland) whose accountability is to the senior leadership at the company for a unified approach to job descriptions, hiring, external communication, and overall testing strategy for Google. His job is often one of sharing best practices and creating and driving new initiatives such as global build or test infrastructure, static analysis, and testing activities that span the breadth of Google’s products, user issues, and codebase.
External recruiting and interviewing is something most Google testers are involved with, especially the directors and senior director. There are a few strange quirks about recruiting for Google. Most engineers already know of the company, the basic technology, and that it’s a great place to work. Often, candidates are a little leery of the interview process and concerned about getting excited about the possibility and then not making it through the loops. Great candidates are often well taken care of in their current position, but they worry about increased competition at Google. Often the best way to dispel these concerns is to point out who they are talking to. Google engineers are competent and motivated, but a large part of what makes their work seem interesting and sometimes herculean, is simply leveraging the community of like-minded engineers and the raw compute infrastructure at Google to do amazing things.
There is also a lot of internal recruiting going on. Engineers are encouraged to change projects so there is always movement from team to team. Internal recruiting is focused on getting the word out about the projects in your domain and your team’s harmony. Most internal recruiting is done engineer-to-engineer, as they talk about their interesting projects, technical issues, and overall happiness about their family of testers, developers, and PMs. There are occasional, semi-formal gatherings where teams looking for engineers present what they are working on, but for the most part, internal recruiting is organic by design—let people flow to where they are interested and think they can add the most value.
• Technical: Test managers and especially test leads are expected to be technical. They may write a prototype, perform code reviews, and always strive to know the product and customers better than anyone else on the team.
• Negotiation: We can’t test everything all the time. Requests for resources and attention from engineering directors are constant. They need to know how to politely say no with great reasoning.
• External communication. Test management and leadership often also strike deals for onsite vendor work or external validation where it makes senses. Test management also reaches out to peers and organizes events, such as GTAC, to create forums for discussing and sharing test engineering issues with the larger community.
• Strategic initiatives: Test leads and managers also often ask what can we do at Google that can’t be done anywhere else? How can we broaden and share our test infrastructure to help make the Web better, not just our product or Google? What things could happen if we pooled our resources and took longer-term bets? Supporting these initiatives with vision, funding, and protection from the onslaught of everyone wanting a tester is truly a full-time job.
• Reviews/performance: At Google, reviews are a mix of peer input and cross-team leveling driven by the leads and managers. Googlers are reviewed quarterly. The emphasis is on what have you done lately? What impact have you made on quality and efficiency and for users? The review system doesn’t let people coast based on their previous work. The mechanics of this aren’t fully disclosed, and they often undergo experimentation and change, so documenting details wouldn’t be all that useful anyway. Basically, Googlers submit a short description of what they worked on and how well they think they did. Their peers and manager then get to comment, and neutral committees meet to arbitrate and level the results across teams. It is important to note that Googlers are expected to set goals higher than they think possible. If Googlers meet all their objectives, they aren’t aiming high enough.
Part of review and performance management at Google is also identifying or encouraging folks to cross disciplines if they’d be better served. Moves in all directions happen all the time. TE to SET and SET to SWE moves are the most common as engineers often pursue their technical interests and specialize. Moves from SET to TE and TE to PM are the second most occurring, as folks move to generalize, have a wider context, and become disinterested in coding all day.
Managers also help set the quarterly and yearly OKRs12 for people. They ensure there are some “stretch” OKRs, which are OKRs that are very optimistic or ambitious goals, but not always necessary or likely to be reached to force the function of aiming high even when planning for the near term. The manager also helps ensure the goals represent a blend of the individual TE and SET’s abilities and interests with the needs of the project and business.
Test leadership often requires compromise and deferring to the wisdom of the individual SET and TEs. A hallmark of Google leadership and management is mentoring and guiding their report work, not dictating it.
Maintenance Mode Testing
Google is known for shipping early and often, and failing fast. Resources can also rush to the highest-risk projects. What that means to the TE is that features, and sometimes entire projects, are either deprioritized at times or entirely scrapped. This often happens just as you get things under control and have figured out the hard problems of testing that particular piece of software. TEs at Google have to be prepared and know how to deal with these situations both technically and emotionally. It’s not glamorous, but these situations can be some of the most risk-intensive and expensive if not done carefully.
When putting a project in a quality maintenance mode, we need to reduce the amount of human interaction required to keep quality in check. A funny thing about code is that when left alone, it gets moldy and breaks of its own accord. This is true of product code and test code. A large part of maintenance engineering is about monitoring quality, not looking for new issues. As with all things, when a project is well funded, you don’t always build the leanest set of tests so the tester will need to deprecate (remove) tests.
When deprecating manual tests, we use these guidelines:
• We look for tests that always pass or tests that are a low priority when you can’t keep up with your higher priority testing. Deprecate them!
• We understand what we are deprecating. We take the time to pick a few representative sample tests from the areas you deprecate. Talk to the original authors if possible to understand their intent so it’s not lost.
• We use the newly freed time for automation or to look at a higher priority test or at exploratory testing.
• We also prune automated tests that might have given false positives in the past or are flaky—they just create false alarms and waste engineering work later.
Following are tips to consider before entering maintenance mode:
• Don’t just drop the hard problems; fix them before leaving.
• Even a small, automated suite focused on E2E can give a lot of assurance over the long haul for almost zero cost. Build this automated suite if you don’t have one already.
• Leave a how-to document, so anyone in the company can run your test suite; it takes you off the firing line for a random interrupt and is the right thing to do.
• Ensure you have an escalation path if something were to go wrong. Be willing to be somewhere on that escalation path.
• Always be ready to dive in and help on projects you used to work on. It’s good for the product, the team, and users.
Entering test maintenance mode is a fact of life for many projects, especially at Google. As a TE, we owe it to our users to take prudent steps to make sure it is as painless for them as possible and as efficient as possible engineering wise. We also have to be able to move on and not be married to our code or ideas.
Quality Bots Experiment
What would testing look like if we forgot the state-of-the-art approaches and tools for testing and took on the mindset of a search engine’s infrastructure with virtually free CPU, virtually free storage, and expensive brains to work on algorithms—bots, quality bots to be exact.
After working on many projects at Google and chatting with many other engineers and teams, we realized we spent a lot of engineering brains and treasure hand-crafting and running regression suites. Maintaining automated test scenarios and manual regression execution is an expensive business. Not only is it expensive, but it is often slow. To make it worse, we end up looking for behavior we expect—what about the unexpected? Perhaps due to the quality-focused engineering practices at Google, regression runs often show less than a 5 percent failure rate. Importantly, this work is also mind-numbing to our TEs, who we interview for being highly curious, intelligent, and creative—we want to free them up to do the smarter testing that we hired them for: exploratory testing.
Google Search constantly crawls the Web; it keeps track of what it sees, figures out a way to order that data in vast indexes, ranks that data according to static and dynamic relevance (quality) scores, and serves the data up on demand in search result pages. If you think about it long enough, you can start to view the basic search engine design as an automated quality-scoring machine—sounds a lot like the ideal test engine! We’ve built a test-focused version of this same basic system:
1. Crawl: The bots are crawling the Web now.13 Thousands of virtual machines, loaded with WebDriver automation scripts, drive the major browsers through many of the top URLs on the Web. As they crawl URL to URL like monkeys swinging vine to vine, they analyze the structure of the web pages they visit. They build a map of which HTML elements appear, where they appear, and how they appear.
2. Index: The crawlers post the raw data to the index servers. The index orders the information based on which browser was used and what time the crawl happened; it pre-computes basic statistics about the differences between each run such as how many pages were crawled.
3. Ranking: When an engineer wants to view results for either a particular page across several runs or all pages for a single browser, the ranker does the heavy compute to figure out a quality score. The quality score is computed as a simple percent similarity score between the two pages, and also averages it for entire runs. A 100 percent means the pages are identical. Less than 100 percent means things are different and is a measure of how different.
4. Results: Results are summarized on a bots dashboard (see Figure 3.27). Detailed results are rendered as a simple grid of scores for each page, showing the percent similarity (see Figures 3.28 and 3.29). For each result, the engineer can dig into visual differences, showing the detailed score on overlays of what was different between the runs with the XPaths14 of the different elements and their positions (see Figure 3.30). Engineers can also view the average minimum and maximum historical scores for this URL, and so on.
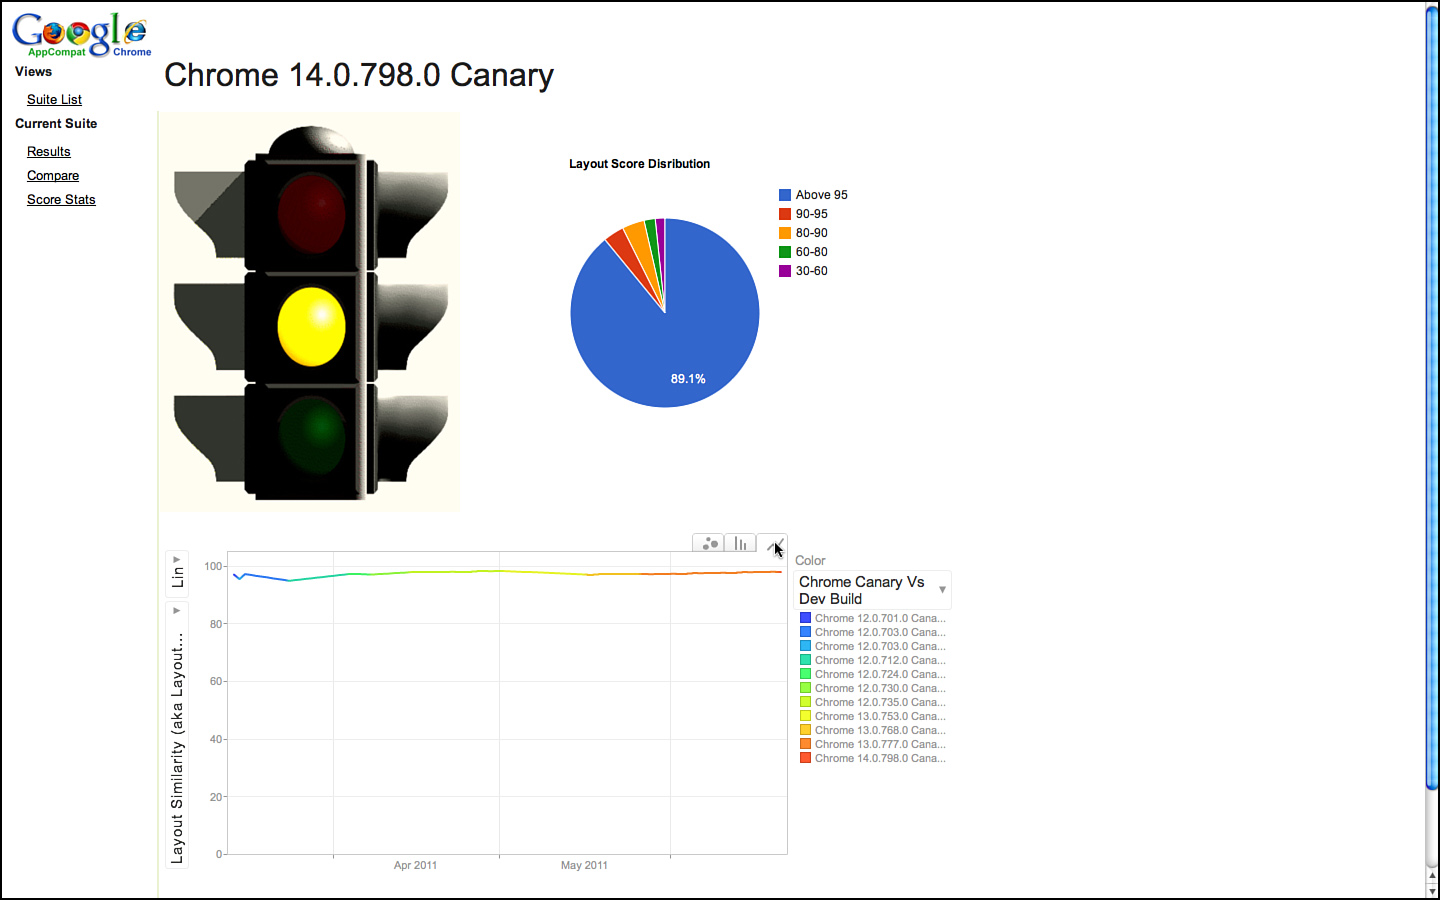
Figure 3.27 Bot summary dashboard showing trends across Chrome builds.
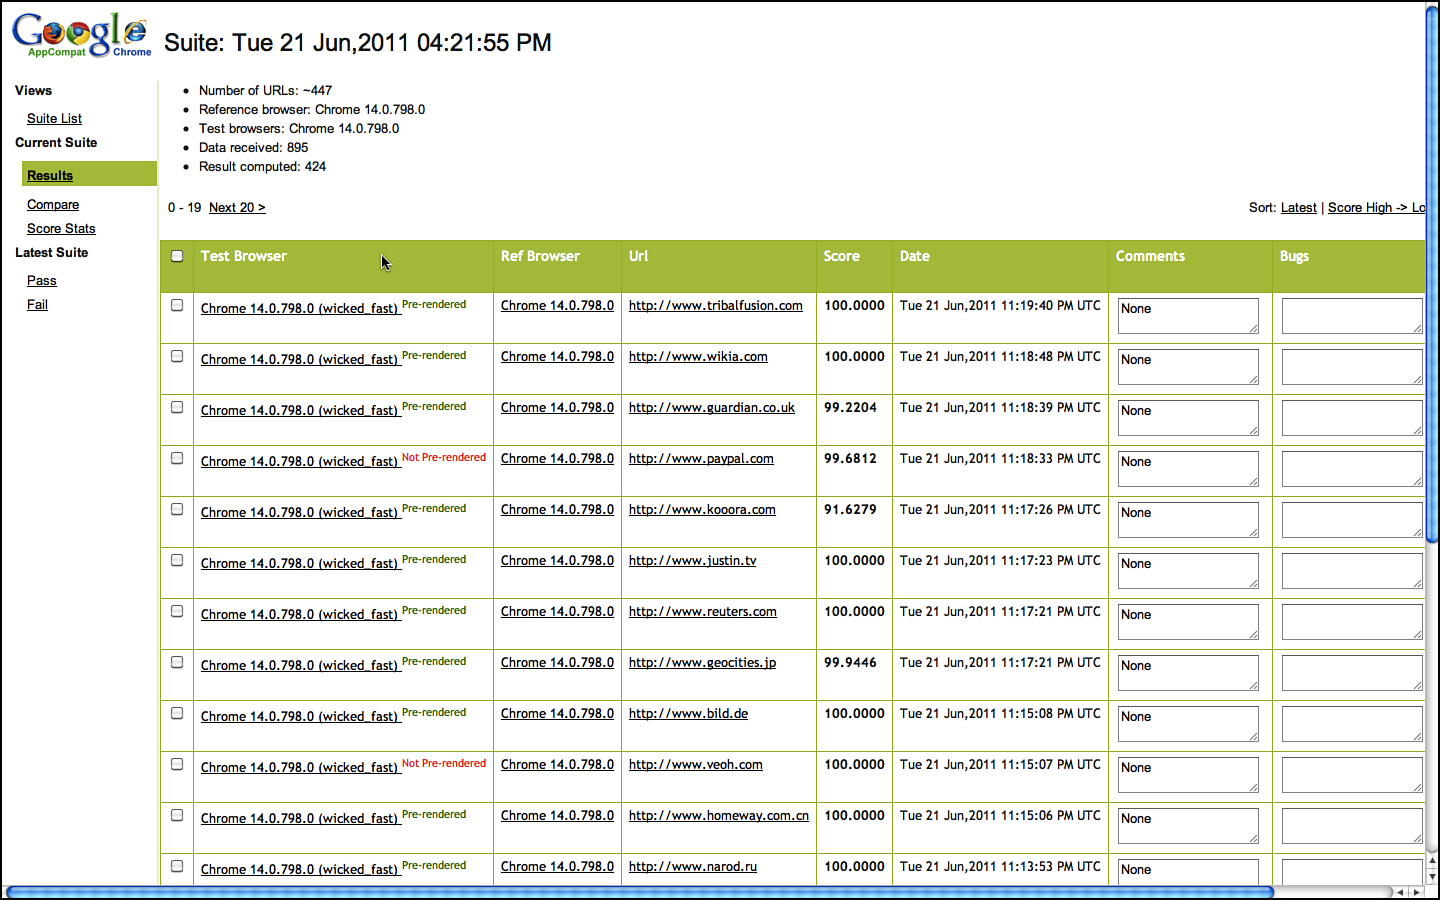
Figure 3.28 Bot typical grid details view.
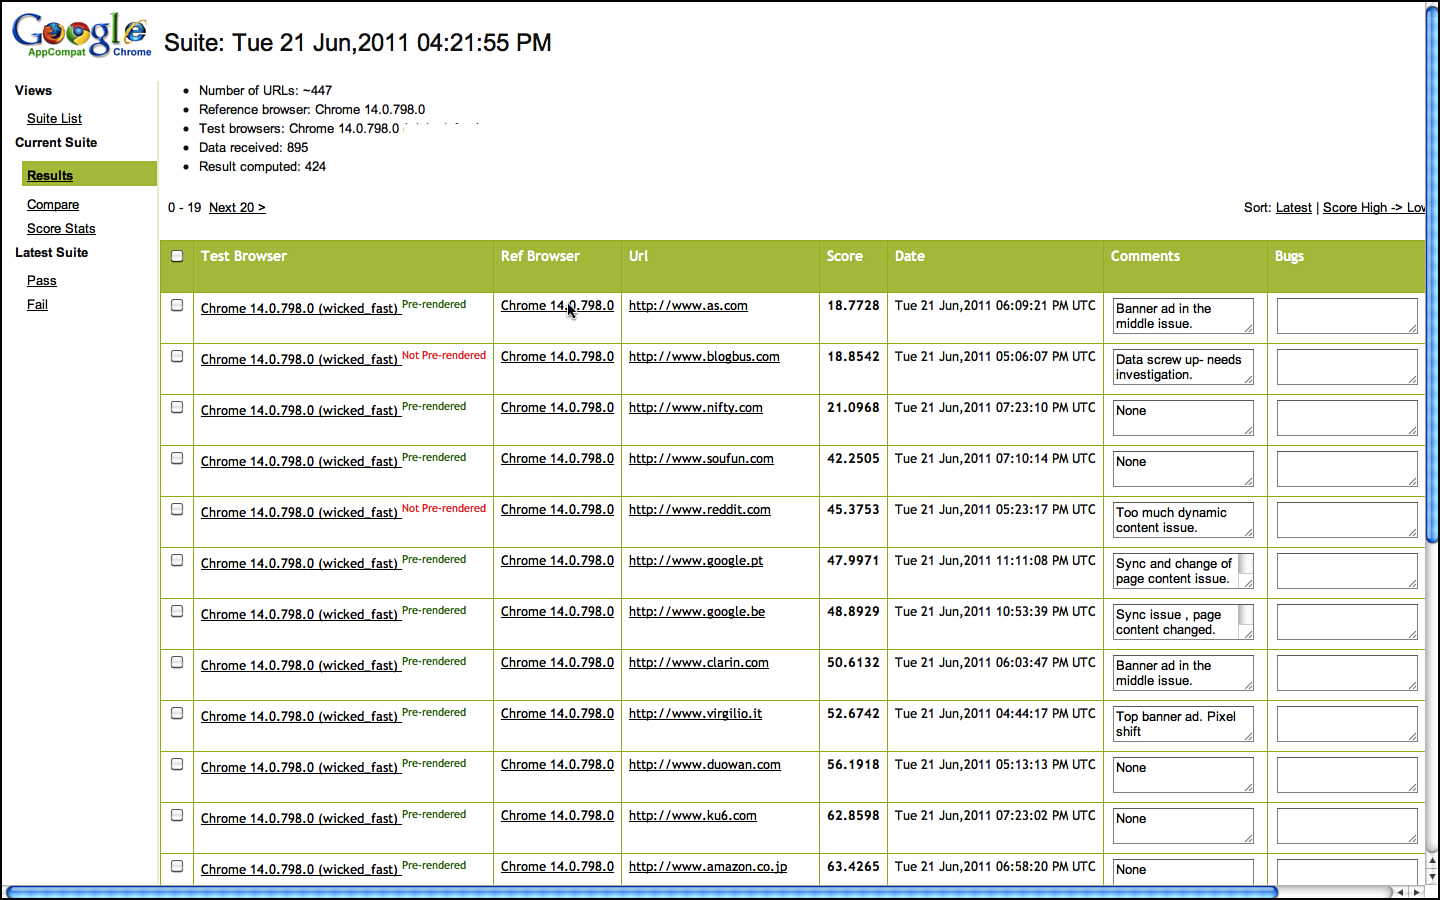
Figure 3.29 Bot grid sorted to highlight the largest differences.
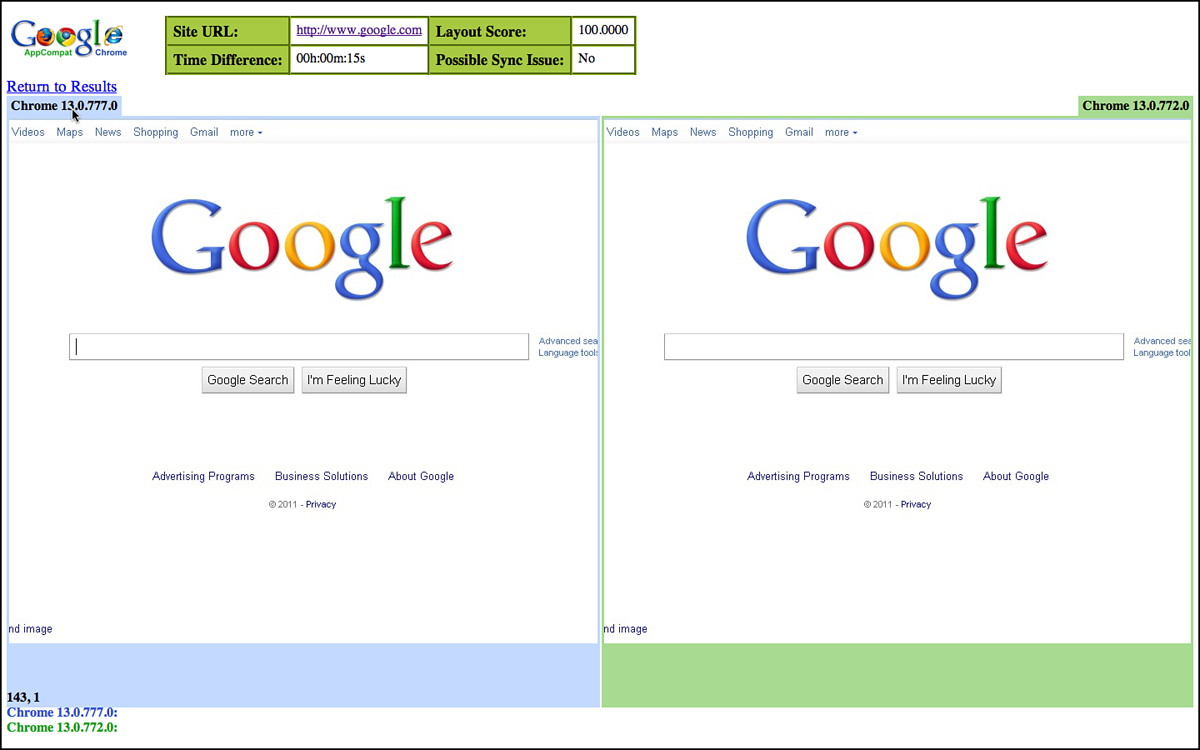
Figure 3.30 Bot visual diff inspection for page with no differences.
The first official run of Bots caught an issue introduced between two Canary builds of Chrome. The bots executed automatically, and the TE looked at the results grid, which showed this URL to have dropped in percent similarity. Based on this detail view that highlighted the differences, the engineer was able to quickly file the issue based on the detail view in Figure 3.31, which highlighted the exact portion of the page that was different. Because these bots can test every build of Chrome,15 the engineer quickly isolated any new regressions found as the build contained only a few CLs, quickly isolating the offending code check-in.
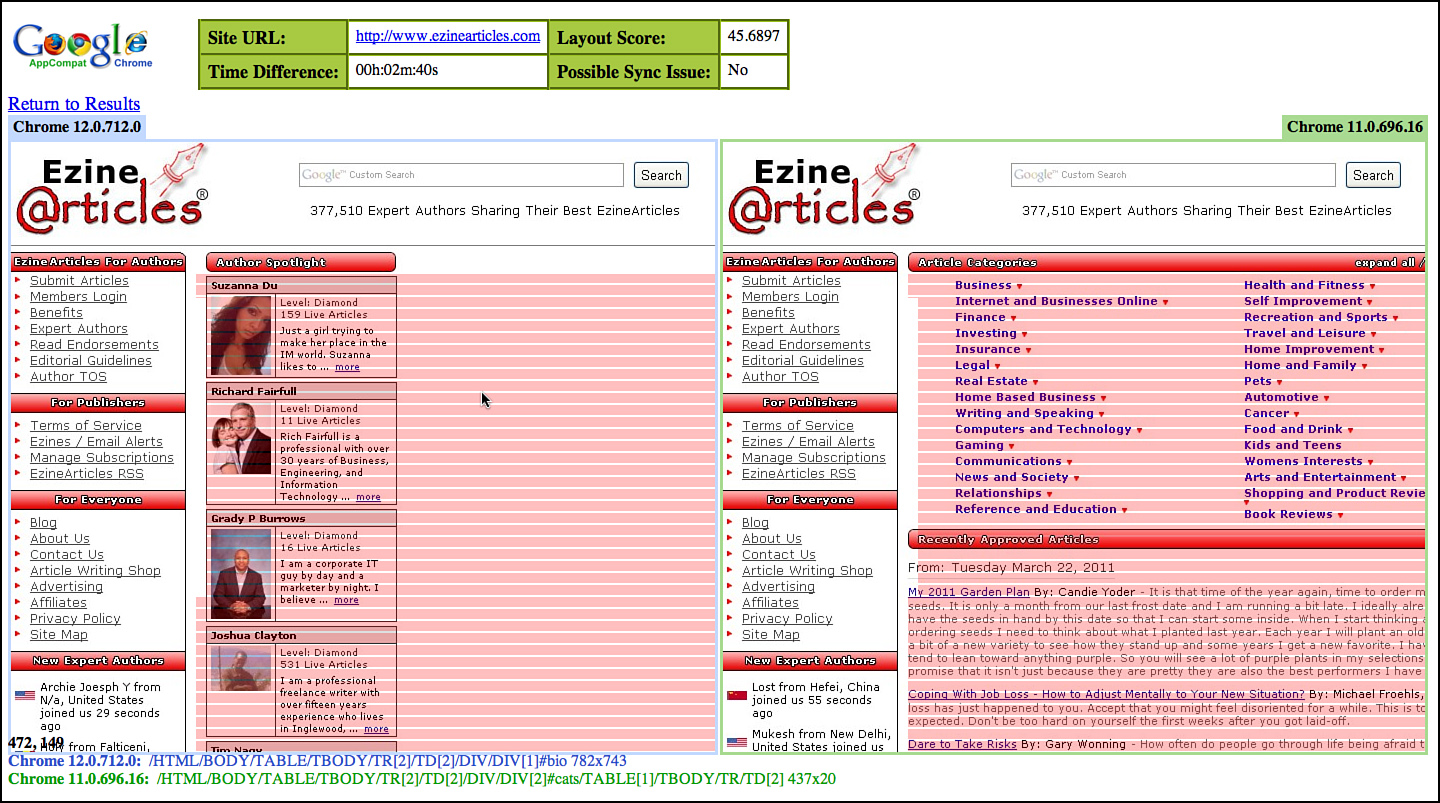
Figure 3.31 View of first bug caught with first run of bots.
Check-in16 into the WebKit codebase (bug 56859: reduce float iteration in logicalLeft/RightOffsetForLine) caused a regression17 that forced the middle div on this page to be rendered below the fold of the page. Issue 77261: ezinearticles.com layout looks broken on Chrome 12.0.712.0.
As we predicted (and hoped), the data from the bots looks very much like the data we get from the manual equivalents—and in many ways, it’s better. Most of the web pages were identical, and even when they were different, quick inspection using the results viewer enables engineers to quickly note that there was nothing interesting (refer to Figure 3.29). Machines are now able to compute that no regressions happened. The significance of this should not be lost—that means we don’t need humans to slog through all these uninteresting web pages—some 90 percent of them. Test passes that used to take days can now be executed on the order of minutes, and they can be executed every day versus every week or so. Those testers are freed to look for more interesting bugs.
If we look at the view where the browser remains the same, but we vary a single website’s data over time, we now have something that tests a website, instead of just testing a browser. There are similar views for seeing a single URL across all browsers and across all test runs. This gives a web developer the opportunity to see all changes that have happened for her site. This means a web developer can push a new build, let the bots crawl it, and be pushed a grid of results showing what changed. At a glance, almost immediately, and with no manual testing intervention, the web developer can confirm that any changes the bots found are okay and can be ignored, and those that look like regressions can be turned into bugs with the data on which browsers and what application version and the exact HTML element information where the bug occurred.
What about websites that are data-driven? YouTube and CNN are heavily data-driven sites—their content changes all the time. Wouldn’t this confuse the bots? Not if the bots are aware of what the normal “jitter” in data for that site is based on historical data. If run over run, only the article text and images change, the bots measure differences within a range that is normal for that site. If the sites score moves outside of that range, say when an IFRAME is broken, or the site moves to an entirely new layout, the bots can generate an alert, notify the web developer of who can determine this is the new normal, or file appropriate bugs if it was a new layout issue. An example of this small amount of noise can be seen in Figure 3.32 where CNET shows a small ad that appeared during the run on the right side, but not on the left. This noise is small and can be ignored via heuristics or quickly marked ignore by a human in seconds who notices this difference is an ad.
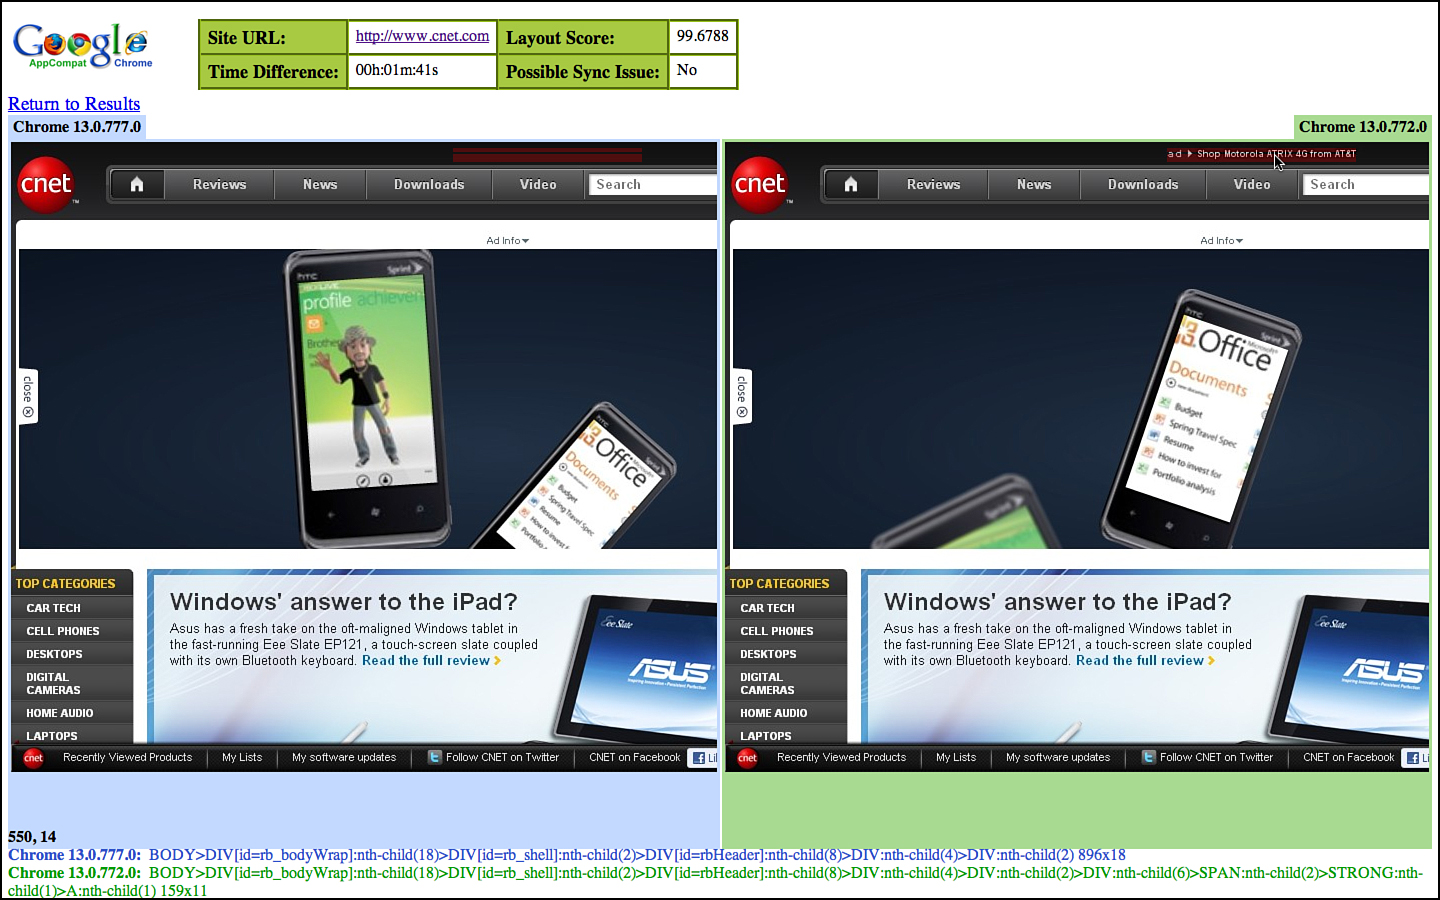
Figure 3.32 Bot visual diff inspection for page with noisy differences.
Now, what about all these alerts when they do occur? Does the tester or developer have to see them all? Nope, experiments are underway to route these differences directly to crowd-sourced18 testers for quick evaluation to shield the core test and development teams from any noise. The crowd-sourced testers are asked to view the two versions of the web page and the differences found, and asked to label it as a bug, or ignore it as it looks like a new feature. This extra layer of filtering can further shield the core engineering team from noise.
How do we get the crowd-sourced voting data? We built some infrastructure to take the raw bot data where there are differences and deliver a simple voting page for crowd testers. We’ve run several experiments with crowd testers versus the standard manual review methods. The standard manual review methods take up to three days latency across two days with onsite vendor testers to evaluate all 150 URLs for regressions. The bots flagged only six of the 150 URLs for investigation. Those didn’t need any further evaluation. These flagged URLs were then sent to crowd testers. With bot data and the difference visualization tools, the average time for a crowd-sourced tester to evaluate a site as having a bug or “okay” was only 18 seconds on average. Crowd testers successfully identified all six as nonissues, matching the results of the manual and expensive form of this validation.
Great, but this measures only the static versions of web pages. What about all the interactive parts of a page such as flying menus, text boxes, and buttons? Work is underway to tackle this problem much like movies. The bots automatically interact with interesting elements on the web page, and at each step, take another scrape, or picture, of the DOM. Then, these “movies” from each run can be compared with the same difference technologies frame by frame.
There are several teams at Google already replacing much of their manual regression testing efforts with Bots and freeing them up to do more interesting work such as exploratory testing that just wasn’t possible before. Like all things at Google, we are taking it slowly to make sure the data is solid. The team aims to release this service and source code publically, including options for self-hosting for testing on other folks’ VPNs if they prefer that to opening their staging URLs to the Internet.
The basic Bots code runs on both Skytap and Amazon EC2 infrastructure. The code has been open sourced (see the Google testing blog or Appendix C). Tejas Shah has been the tech lead on Bots from very early on and was joined by Eriel Thomas, Joe Mikhail, and Richard Bustamante. Please join them in pushing this experiment forward.

Figure 3.33 Early WebKit layout testing used single hashes of the entire page layout. We can now test full pages and fail at the element versus page level.
• Ads keep changing.
• Content on sites such as CNN.com keep changing.
• Browser-specific code means pages will render differently on different browsers.
• Bugs in the browsers themselves cause differences.
• Such an effort requires overwhelming amounts of data.
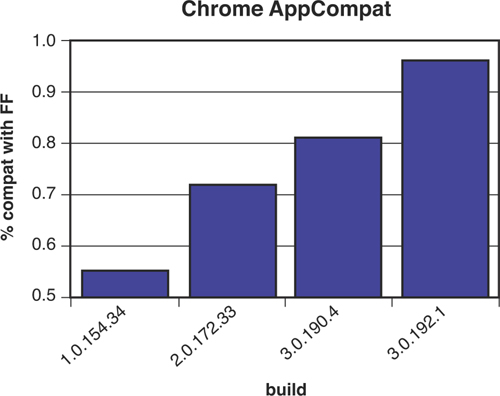
Figure 3.34 Early data showing similarity between bot and human measures of quality.
BITE Experiment
BITE stands for Browser Integrated Test Environment. BITE is an experiment in bringing as much of the testing activity, testing tools, and testing data into the browser and cloud as possible, and showing this information in context. The goal is to reduce distraction and make the testing work more efficient. A fair amount of tester time and mental energy is spent doing all this manually.
Much like a fighter pilot, so much of a tester’s time is spent context switching and dealing with a lot of data. Testers often have multiple tabs open: one for the bug database, one for email for product mailing lists or discussion groups, one for their test case management system, and one for a spreadsheet or test plan. The tester is constantly flipping between these tabs. This might seem like we are overly obsessing on efficiency and speed, but there is a greater problem in all this. The testers end up missing valuable context while they are testing:
• Testers waste time filing duplicate bugs because they don’t know the right keywords to find the existing bug.
• Testers do not actually file a bug for seemingly obvious issues because they don’t want to sift through the bug database looking for the right keyword to confirm it’s already filed.
• Not every tester is aware of all the hidden and relevant debug information that is useful for later bug triaging and debugging by developers.
• It takes a lot of time to manually enter the reproduction steps, debug info, and where the bug was found in the application. A lot of time and mental energy is wasted, and often this mundane work takes the creativity and focus out of the TE in the process at the exact time he should be most alert for bugs.
BITE tries to address many of these issues and lets the engineer focus on actual exploratory and regression testing—not the process and mechanics.
Modern jet fighters have dealt with this information overload problem by building Heads Up Displays (HUDs). HUDs streamline information and put it in context, right over the pilot’s field of view. Much like moving from propeller-driven aircraft to jets, the frequency with which we ship new versions of software at Google also adds to the amount of data and the premium on the speed at which we can make decisions. We’ve taken a similar approach with BITE for regression and manual testing.
We implemented BITE as a browser extension because it allows us to watch what the tester is doing (see Figure 3.35) and examine the inside of the web application (DOM). It also enables us to project a unified user experience in the toolbar for quick access to data while overlaying that data on the web application at the same time, much like a HUD.
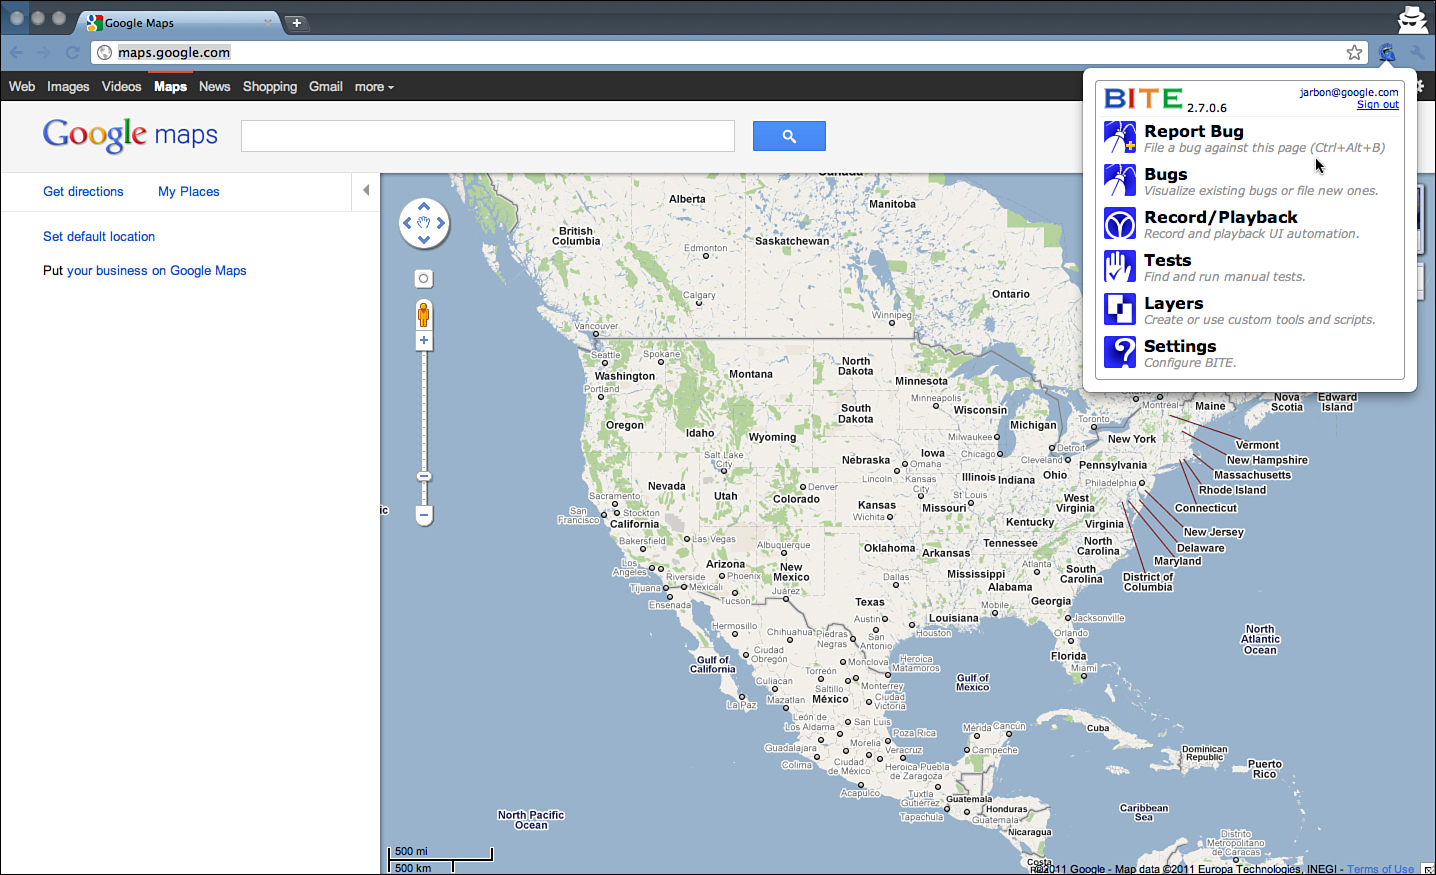
Figure 3.35 BITE extension popup window.
Lets walk through these experimental features using some real world Google web applications.
Reporting Bugs with BITE
When the tester finds a bug on a web application she is testing, or dogfooding, she can make one click on the Chrome extension icon, and then select which part of the page is buggy. Much like Google Feedback, the tester can highlight the part of the page where the bug lives, and with one more click, automatically file that as a bug. The tester can add more text to describe the problem, but the bug already automatically has most of the interesting and tedious information added to it automatically: the URL, the offending element/text on the page, and a screenshot. For a few deeply supported web applications, the tool automatically goes deeper and extracts application-specific debug URLs and information useful for debugging in the page itself.
Let’s say the tester tried searching on maps.google.com for “Google offices” and saw a possibly irrelevant maps search result: the White House. The tester simply clicks the BITE menu button to Report Bugs. He then gets a cursor to select the part of the page that he thinks has a bug in it: the fourth search result in this case (see Figure 3.36). He can also pick any of the controls, images, or map tiles on the page, and individual words, links, or icons.
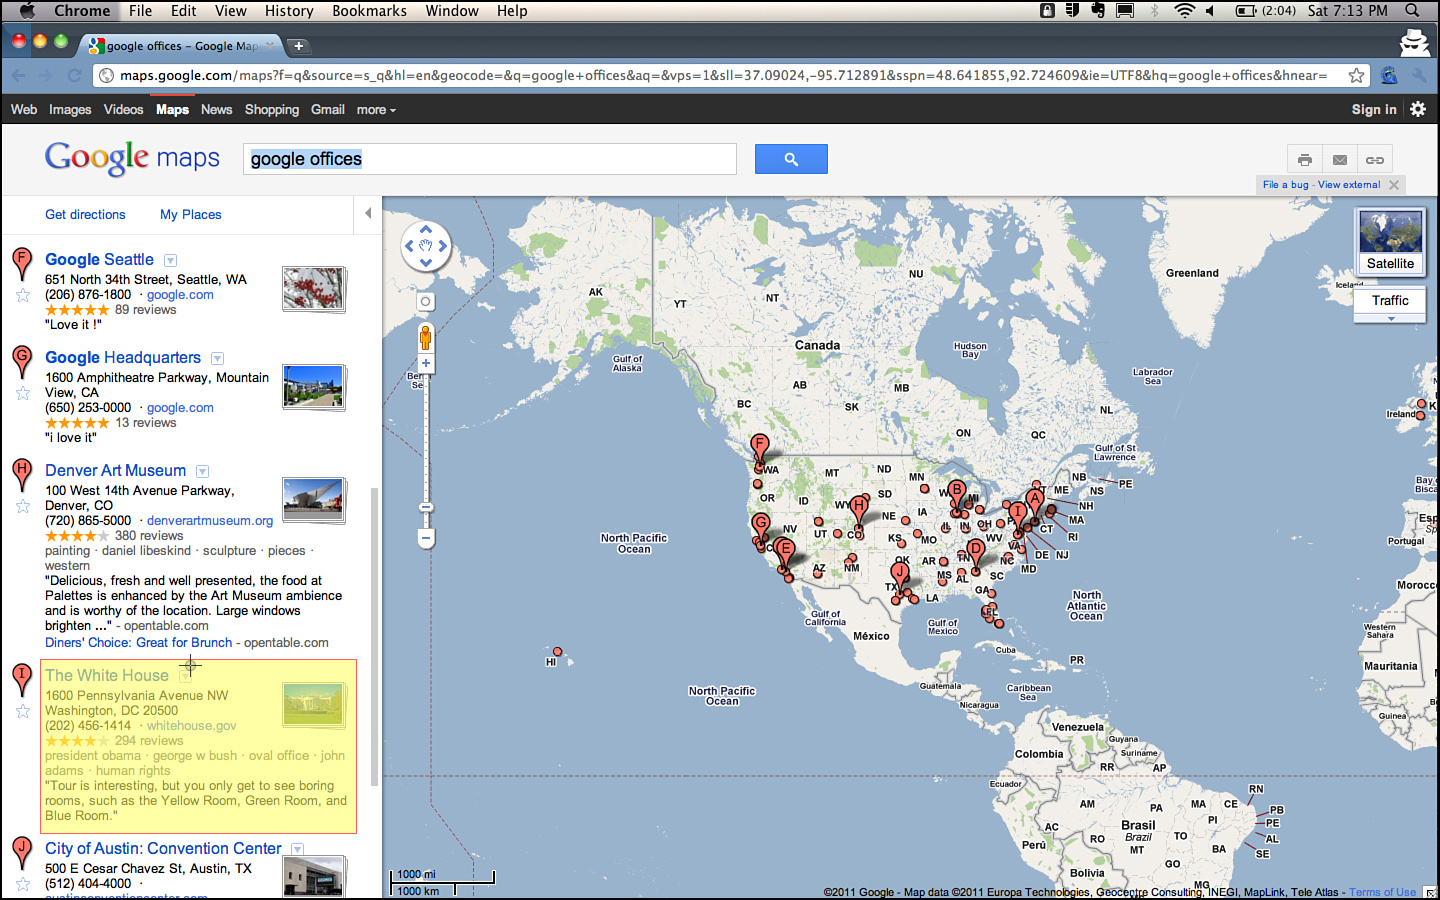
Figure 3.36 BITE highlighting the irrelevant search result in yellow, the White House.
Clicking the highlighted part of the page brings up the bug-filing form (see Figure 3.37) directly on top of the page they file the bug against. There is no tab switching here. They can enter a quick bug title and click Bug It to file it immediately or add additional information. There are a few cool things that are automatically added here by BITE—things that make triage and debugging a lot easier, and most testers don’t take the time to do, or it takes quite a bit of manual labor, distracting the tester from actually testing:
1. A screenshot is automatically taken and attached to the bug.
2. The HTML of the element that was highlighted is attached to the bug.
3. The actions taken since landing on maps.google.com are recorded in the background and recorded as a JavaScript that can be executed to replay what the tester was doing on that page before the bug was found. A link to this is automatically attached to the bug, so the developer can watch a replay live in his own browser. See Figure 3.38.
4. Map-specific debug URLs are automatically attached to the bug (often the URL doesn’t contain enough information for a full repro).
5. All browser and OS information is attached to the bug.
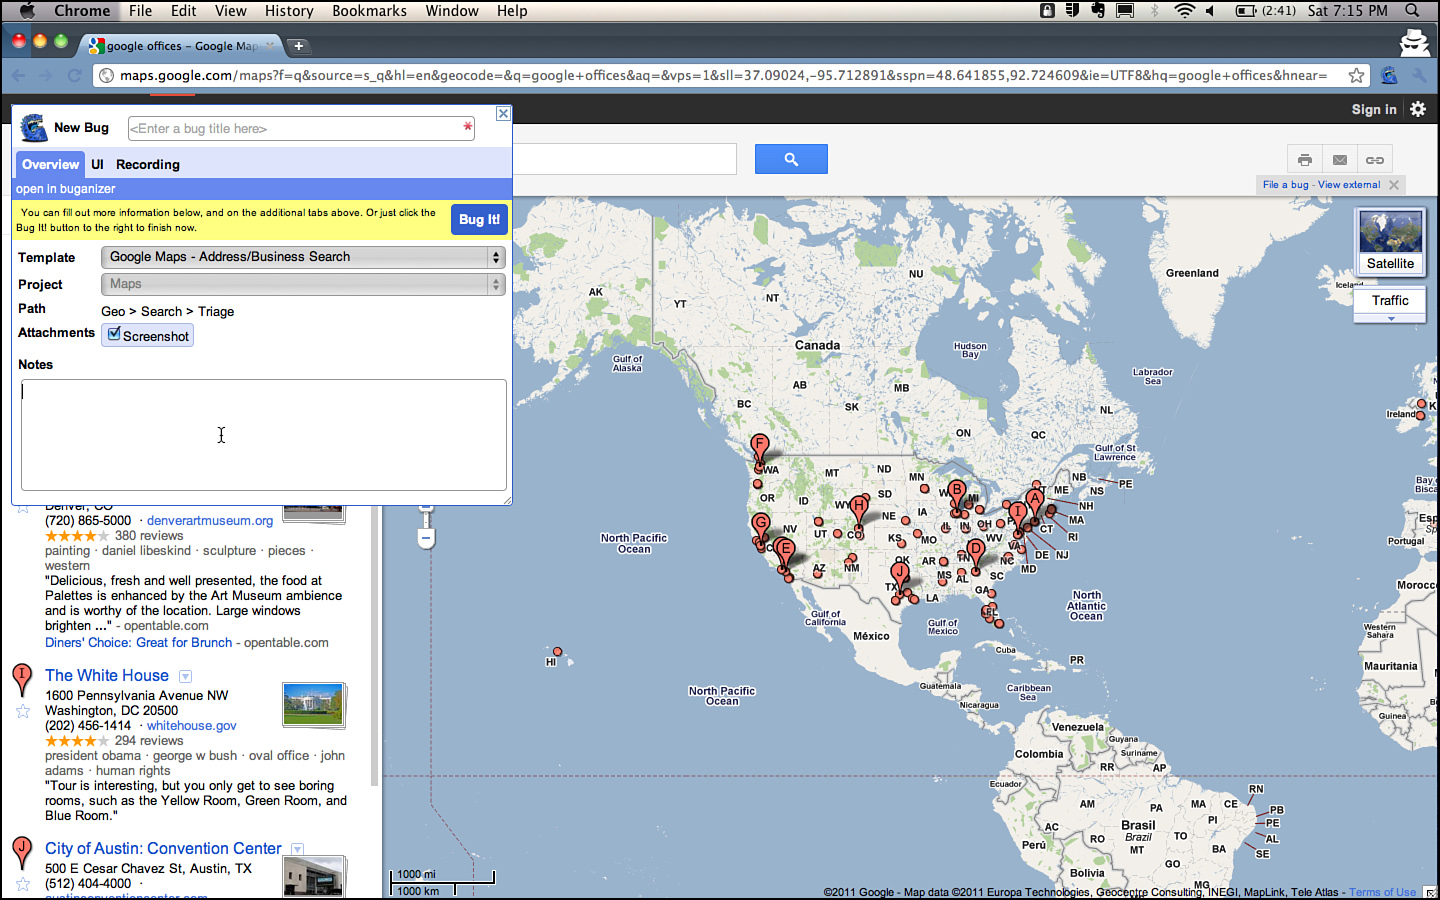
Figure 3.37 BITE: the in-page bug-filing form.
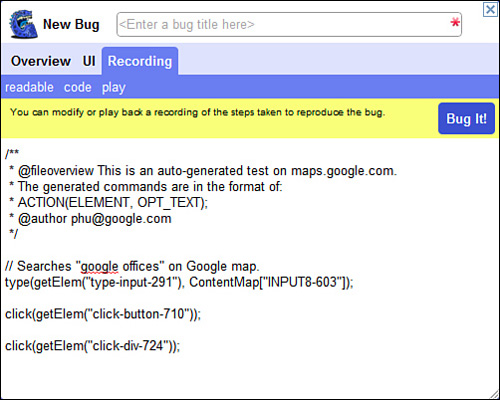
Figure 3.38 BITE: the JavaScript recorded during testing.
The bug is added to the bug database with all this information for triaging. All this leads to quick bug filing.
Viewing Bugs with BITE
As the testers explore the application or runs regression tests, they can automatically see relevant bugs for the page they are on, floating over the application under test. This helps testers know whether a bug has already been filed before or what other bugs have been found, indicating the classes of bus in this part of the application.
BITE displays bugs from both our internal bug database and from the chromium.org issue tracker—where external developers, testers, and users can file bugs about Chrome in general.
The number next to the BITE icon in the browser indicates how many bugs might be related to the current web page. This a simple matter for bugs originally filed through BITE for which we have a lot of data including the actual part of the page where the bug manifested itself. For bugs filed the old fashioned way, directly into issue tracker or our internal Buganizer, we have a crawler that looks at every bug to look for URLs and match bugs to pages, ranking them by how closely they match the URL to the current page (for example, exact matches are shown first, then the ones that match the path, and then only the domain of the current URL). It’s simple, but it works pretty well.
Figure 3.39 shows how a map’s page looks with the BITE bug overlay. One click on the bug IDs takes the engineer to the full bug report page in Buganizer or issue tracker. Figure 3.40 shows a bug overlay on top of YouTube.
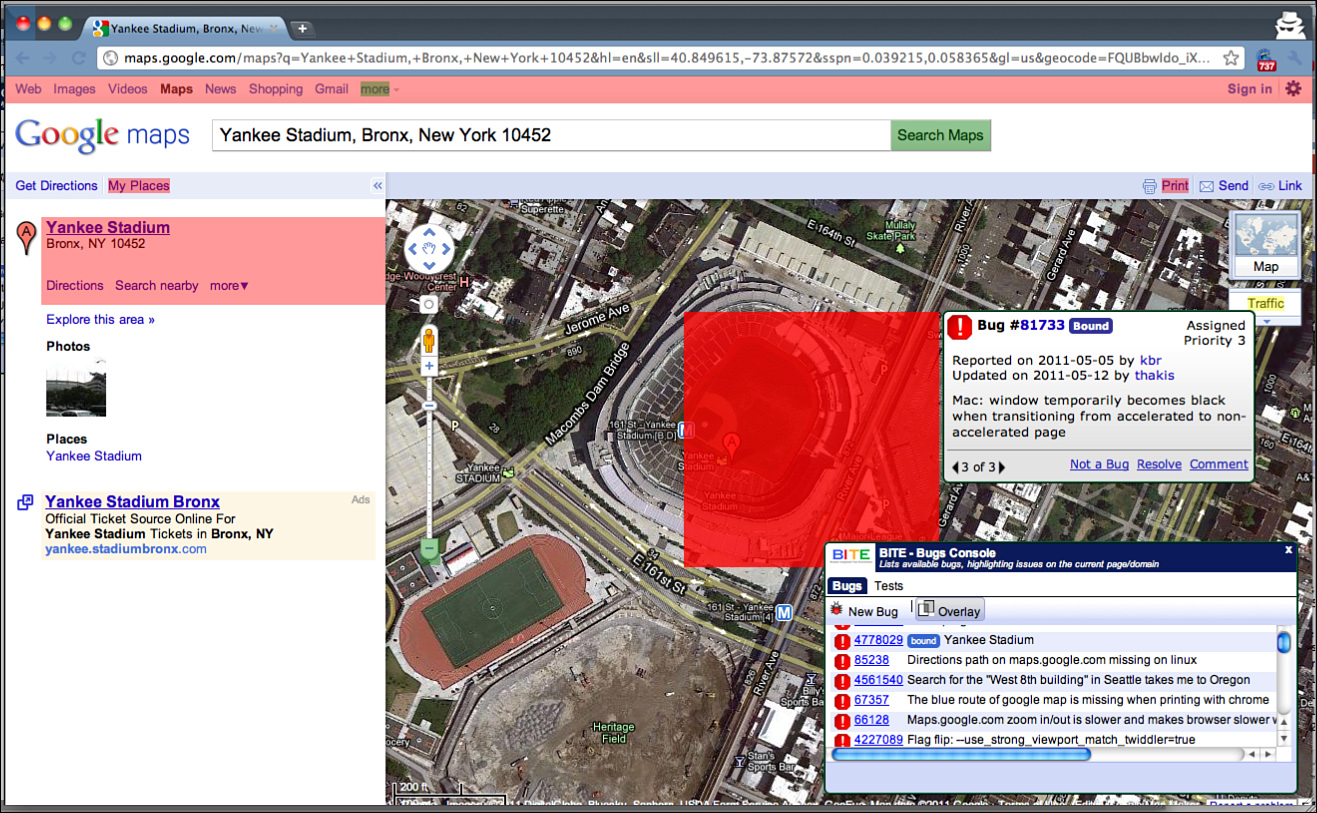
Figure 3.39 BITE: overlay showing bugs related to maps.google.com.
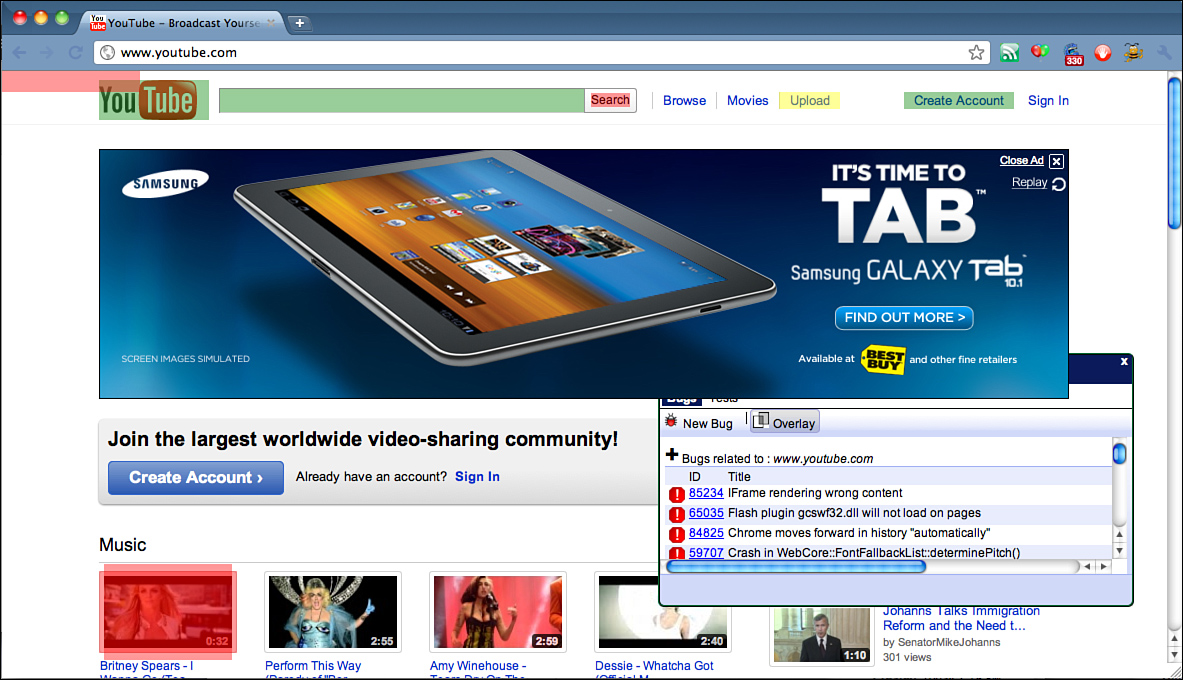
Figure 3.40 BITE: bug overlay on the YouTube home page.
Record and Playback with BITE
A significant amount of SET and TE time is spent developing large, end-to-end regression test case automation. These tests are important because they make sure the product works for the end user with all parts working together. The vast majority of these are written in Java using Selenium to drive the browsers and hold the test case logic. There are a few pain points with this approach:
The test logic is written in a language different from the running application (Java versus JavaScript). This is a common complaint of developers and testers across Google. It slows down debugging and not every engineer wants to learn every language.
The test code lives outside of the browser, so they require a build step and deploying these test binaries to machines. The Matrix test automation infrastructure centralizes this problem, but doesn’t completely solve it.
You need to have a full IDE separate from the browser and the application installed locally and configured for the project you want to test.
TEs spend a lot of time bouncing between the application’s DOM and the Eclipse IDE. They look at the XPaths of interesting elements, then handcode this into their Java code. Build, run, and see if it works. This takes time and can be tiresome.
Google web apps change their DOM frequently. That means that test cases break all the time as elements move around the page and their attributes change. After a while, teams spend much of their time just maintaining the existing tests. All these false positives also lead developers and testers to start ignoring test results and just marking them as flaky so they don’t block check-in.
In response, we worked to build a pure web solution called the Record and Playback framework (RPF), which is based on pure JavaScript, and we worked on storing the test case scripts in the cloud. This also works on Chrome OS, which doesn’t support execution of Selenium or WebDriver test cases.
To record a test, you simply click the Record and Playback menu item in the BITE browser menu. A new recording dialog is then launched. When the record button is pressed, this dialog records all the click activity in the main browser window. A right-click on any element enters validation mode, where the tester can validate either a particular string, image, or an element’s value. The validation can also be the presence of the element and its relative position on the page. This relative positioning is useful when working with the YouTube team as they don’t always know exactly which video should be on the home page, but they do know the general layout of the page to expect.
One of the core aspects of the RPF approach is that it aims to avoid the pain of viewing the application’s DOM and then recalculating the XPaths of the elements as they change. We invested quite a bit of engineering into code that would stop the test; if it couldn’t find an element during playback, it would pause, allowing the TE to simply pick the new element and automatically update the script and keep executing. The team has also invested in what we call “relaxed execution.” Basically, rather than be incredibly strict about whether the element matches the expected XPath, RPF instead looks at all the attributes of the HTML element and its parent and child elements in the DOM. During replay, RPF first looks for an exact match. If no exact match is found, it looks for elements that closely match. Maybe the ID attribute changed, but everything else is the same. The playback can be set to an arbitrary degree of precision in matching, and if the match is within tolerances, the test keeps marching to the next step and simply logs a warning message. We hoped investment in this approach would save a lot of engineering cycles.
We first tried RPF with the Chrome Web Store test team. RPF worked for about 90 percent of their test scenarios, the key exceptions were file upload dialogs that are native OS file dialogs outside of the browser and some aspects of Google Checkout, as it’s not possible to automate some of those money scenarios through web APIs for security reasons. The most interesting thing we found, though, was that the TEs didn’t care all that much about the fancy relaxed matching or pause-and-fix features. It was simply quicker for them to just re-record the test from scratch. In this early trial, we did parallel development of the same tests in both WebDriver and RPF. RPF with this approach was seven times more efficient to generate and maintain tests over Selenium and WebDriver. Mileage might vary, but it was a good early sign.
RPF also lives in BITE for the bug-filing scenarios. For certain sites, BITE automatically starts recording the engineer’s activity. When the engineer finds a bug and uses BITE to file it, BITE appends a link to the generated repro script. For example, on Maps, it records all the searching and zooming activity. A developer viewing the bug, if he has BITE installed, can make a single click and the playback will start. He can watch what the users do when they encounter the bug. If no bug is filed during that session on the website, during exploratory testing or normal usage, the recorded script is simply discarded.
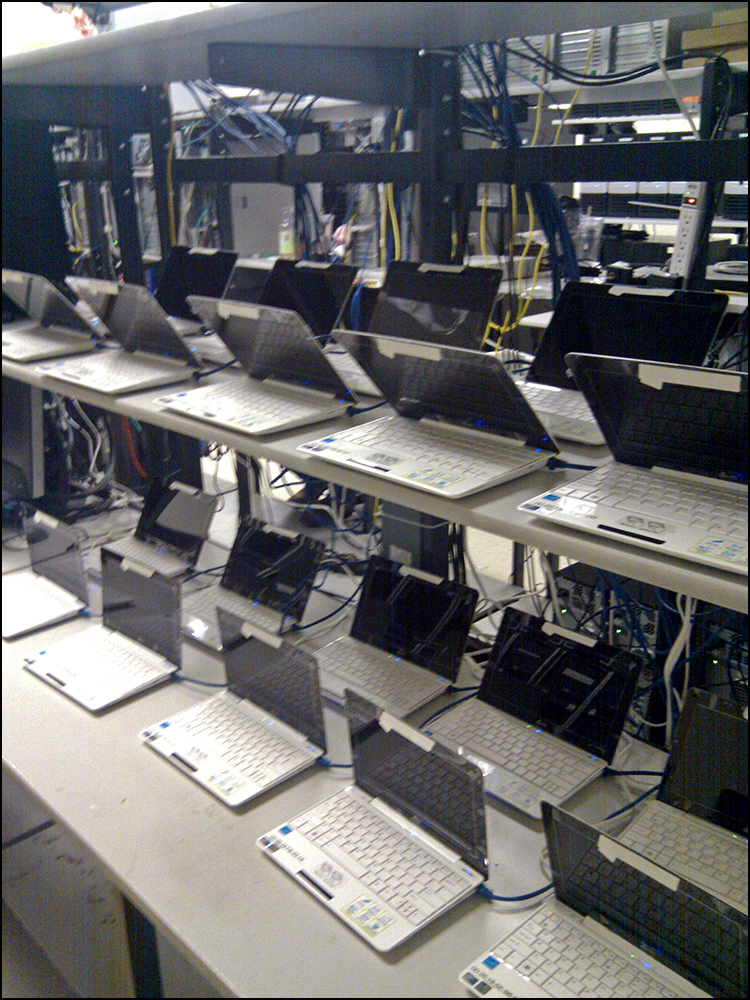
Executing Manual and Exploratory Tests with BITE
Google has tried many ways to distribute tests acoss several testers for a given test pass: painful UI in TestScribe and often via spreadsheets shared with the team (manually mapping peoples’ names to sets of tests they should execute).
BITE supports the tester subscribing to the test sets in the Google Test Case Manager (GTCM) for multiple Google products. When the test lead wants to start a test pass, she can click a button on the BITE server, and tests are pushed out to testers via the BITE UX. Each test can have a URL associated with it. If the user accepts the ask to execute the test, BITE drives the browser to the URL and shows the test steps and validation to be performed on that test page. It is just one click to mark it as PASS, which automatically takes the tester to the next URL to be tested. If the test fails, it marks the test as FAIL in the database and launches the BITE bug reporting UX.
This method has been tried with success with crowd-sourced testers. They executed tests with BITE installed, and the tests were distributed via BITE test distribution. This let us avoid the pain of managing the full set of testers and hard coding who will execute which tests. Testers with quickly executed tests were automatically pushed more to execute. If testers took a break or stopped all together, their tests simply timed out and were pushed to another tester. This has also been used to drive exploratory testing with each high-level Tour description defined as a single test case, and then distributed to testers who can file bugs via BITE as they tour the product.
Layers with BITE
As with all software projects, there is a compulsion to make things extensible. BITE has the capability to host arbitrary scripts and inject them into the page under test. There are a few current layers. For example, one of them lets developers systematically remove elements form the page, looking to isolate the cause of a bug. Work is underway to include scripts from the security team. These layers can be turned on or off with a little console. We are just now exploring what layers engineers might find interesting.
BITE strives to be all things to all testers. We originally started with each of these features as a separate extension, but the team realized that the whole is greater than the sum of the parts, and we spend quite a bit of engineering to bring everything together under the BITE umbrella.
As with the other experiments, the team hopes to open this up to the larger testing community soon.
The BITE project has been open sourced (see Appendix C). Alexis O. Torres was the original technical lead; Jason Stredwick is now the technical lead working with Joe Muharsky, Po Hu, Danielle Drew, Julie Ralph, and Richard Bustamante when they can find time away from their current projects. At the time of this writing, several external companies have ported BITE to their own infrastructure, and there is active work on Firefox and Internet Explorer ports.
Google Test Analytics
Risk analysis, as discussed earlier, is critically important, yet it is often implemented in on-off, custom-crafted spreadsheets, or worse, only in people’s heads. There are a few shortcomings with this spreadsheet approach:
• Custom spreadsheets don’t share a common schema. There is no way to roll up the data and it is confusing for folks looking across multiple projects.
• Some simple but important things such as a four-point rating system, and naming learned in ACC, are sometimes lost in these spreadsheets in the interest of brevity.
• There is limited visibility across multiple teams because there is no central repository and they are only ad-hoc shared on a need-to-know basis.
• The engineering and scripting to connect Risk Analysis to product metrics is expensive and rarely added as a feature in the spreadsheets.
Google Test Analytics (GTA) is an attempt to address these issues. GTA is a simple web application that makes the data entry and visualization of risk a little easier. The UI of GTA works to induce ACC best practices in its design. Keeping the data in a common schema also enables managers and directors to get a single view of risk across their products to help them allocate resources to the highest risk areas.
GTA supports the ACC model of Risk Analysis. Attributes and components are entered into quick-fill forms to produce a grid (see Figure 3.42 and Figure 3.43). The UI enables test planners to add capabilities at the intersections of this grid (see Figure 3.44). Adding risk is simply picking a frequency and impact value from the drop-down lists for each capability. This is all rolled up into the risk view. The summary risk for each area (see Figure 3.45) is simply the average of the risks in that square.24
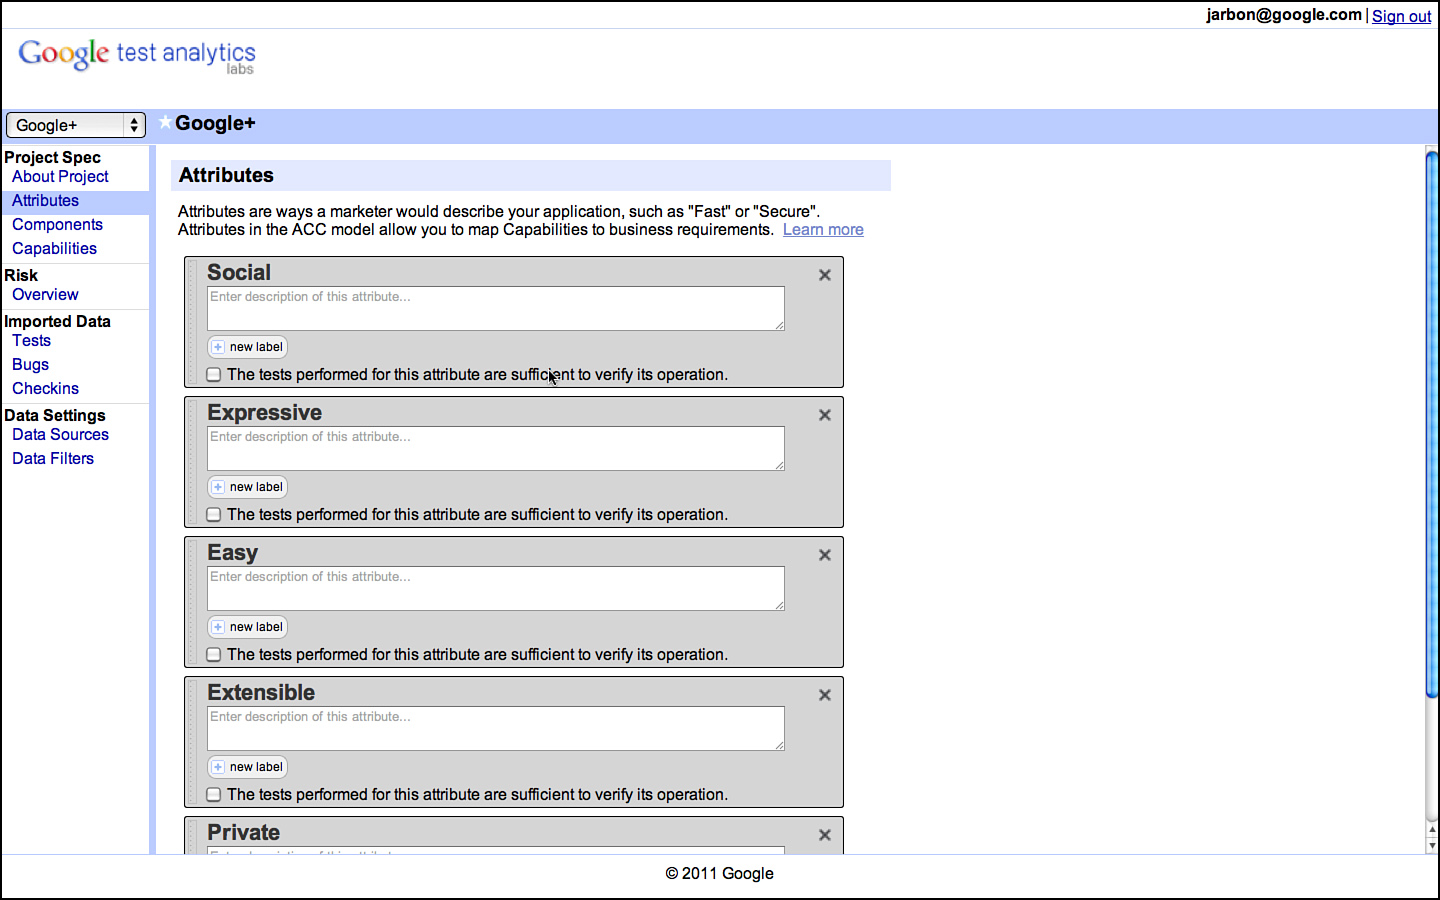
Figure 3.42 Test Analytics: entering attributes for Google+.
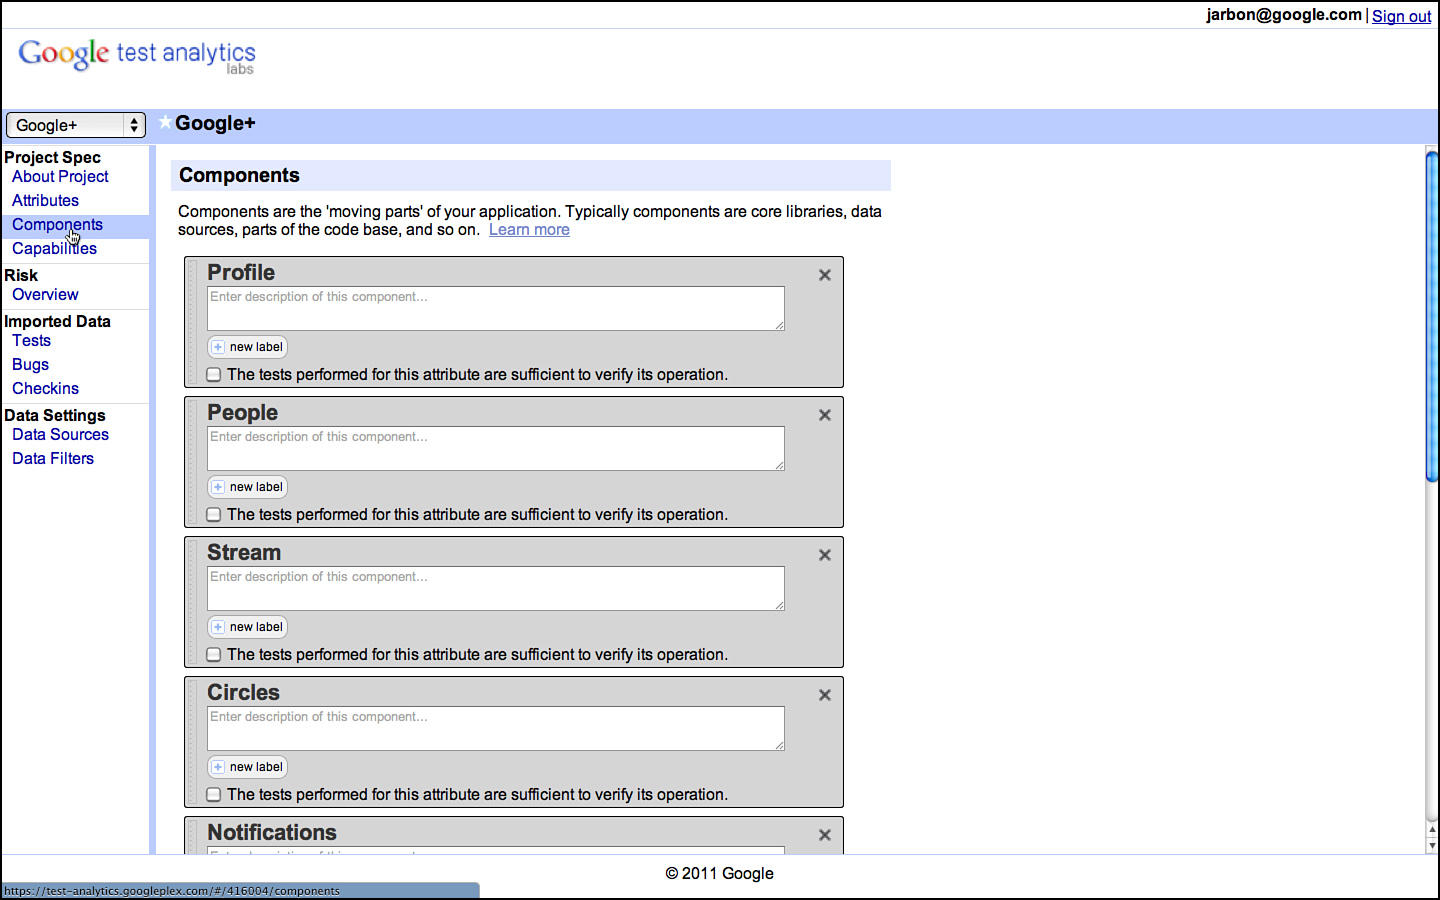
Figure 3.43 Test Analytics: entering components for Google+.
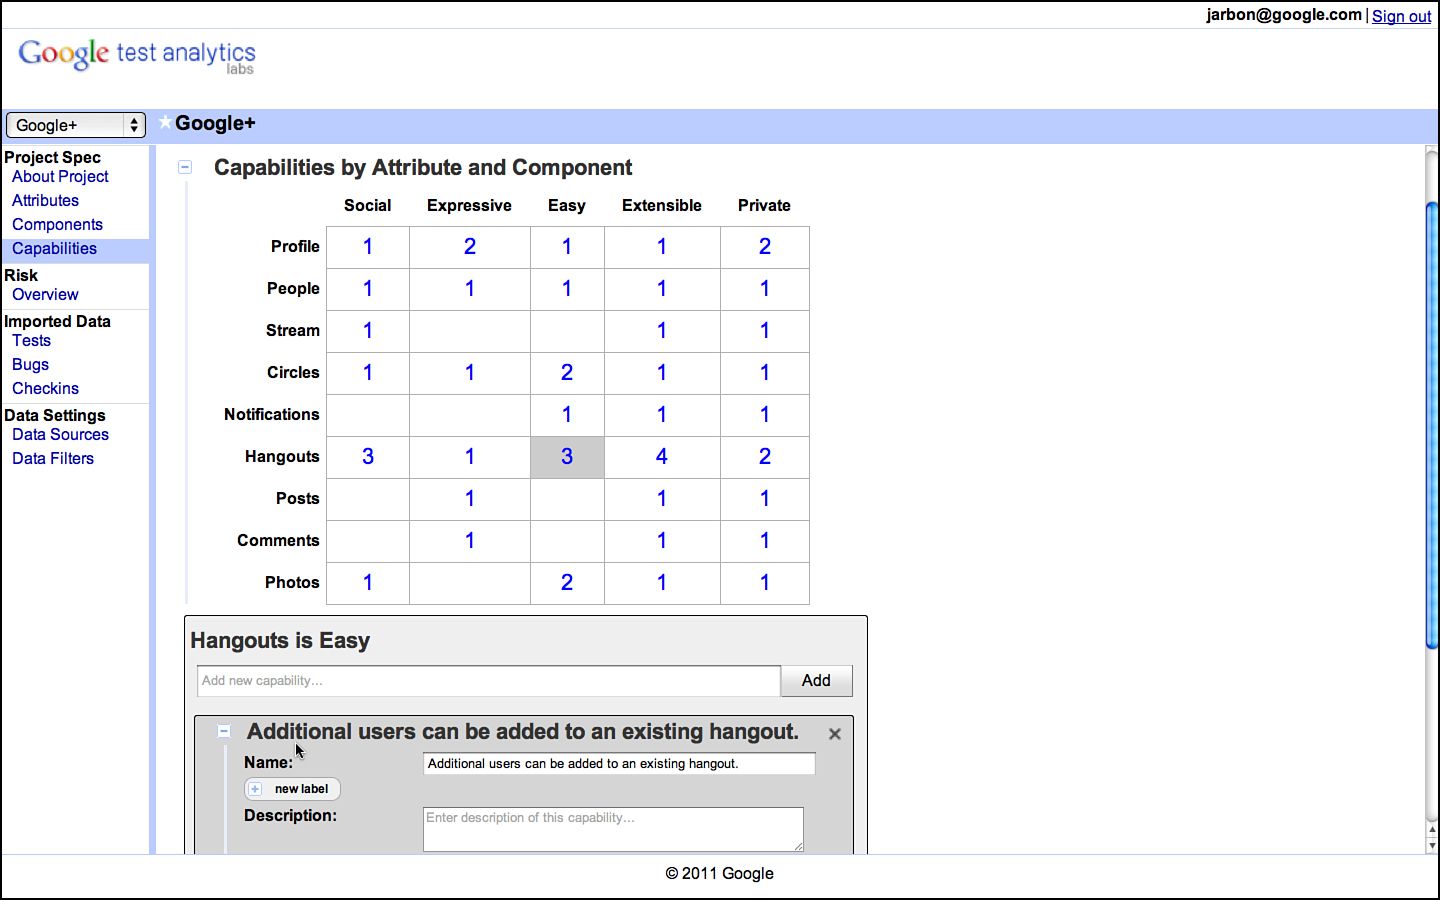
Figure 3.44 Test Analytics: entering capabilities on a grid intersection. Note that counts are simply the number of capabilities at the intersection, not risk.

Figure 3.45 Test Analytics: risk heat for Google+.
An optional and experimental aspect of GTA is the capability to bind the risk calculations to your actual project data. As you add more tests, add more code, and find more bugs, the assessment of risk changes. As TEs, we’ve always tracked this change in risk in our heads; this is just more systematic and data-driven. Test plans, even ACC/risk-based ones, often drive the initial test planning, which is great, but soon become dead documents themselves. You can always change anything in GTA as you get more data about risk, capabilities, and so on, but we should try to automate even this aspect of test planning where possible.
GTA currently supports only binding to our internal databases, but the work to generalize this is underway. In GTA, testers can enter the locations or queries in the bug database, source tree, and test case manager for the different capabilities. At Google, everyone uses the same databases, so it makes this easy. Then as these metrics change, we do some simple linear algebra to update the risk levels. This aspect is currently under a pilot trial with a few application teams at Google.
The formula we use is constantly evolving, so we won’t document it here, but it is basically a measure of change in bug counts, lines of code changed, and the number of passing and failing test cases relative to when the risk assessment was completed. Each component of this risk is scaled to allow for variance in projects as some teams file granular bugs or have high measures of code complexity. Figures 3.46, 3.47, and 3.48 show this for Google Sites.
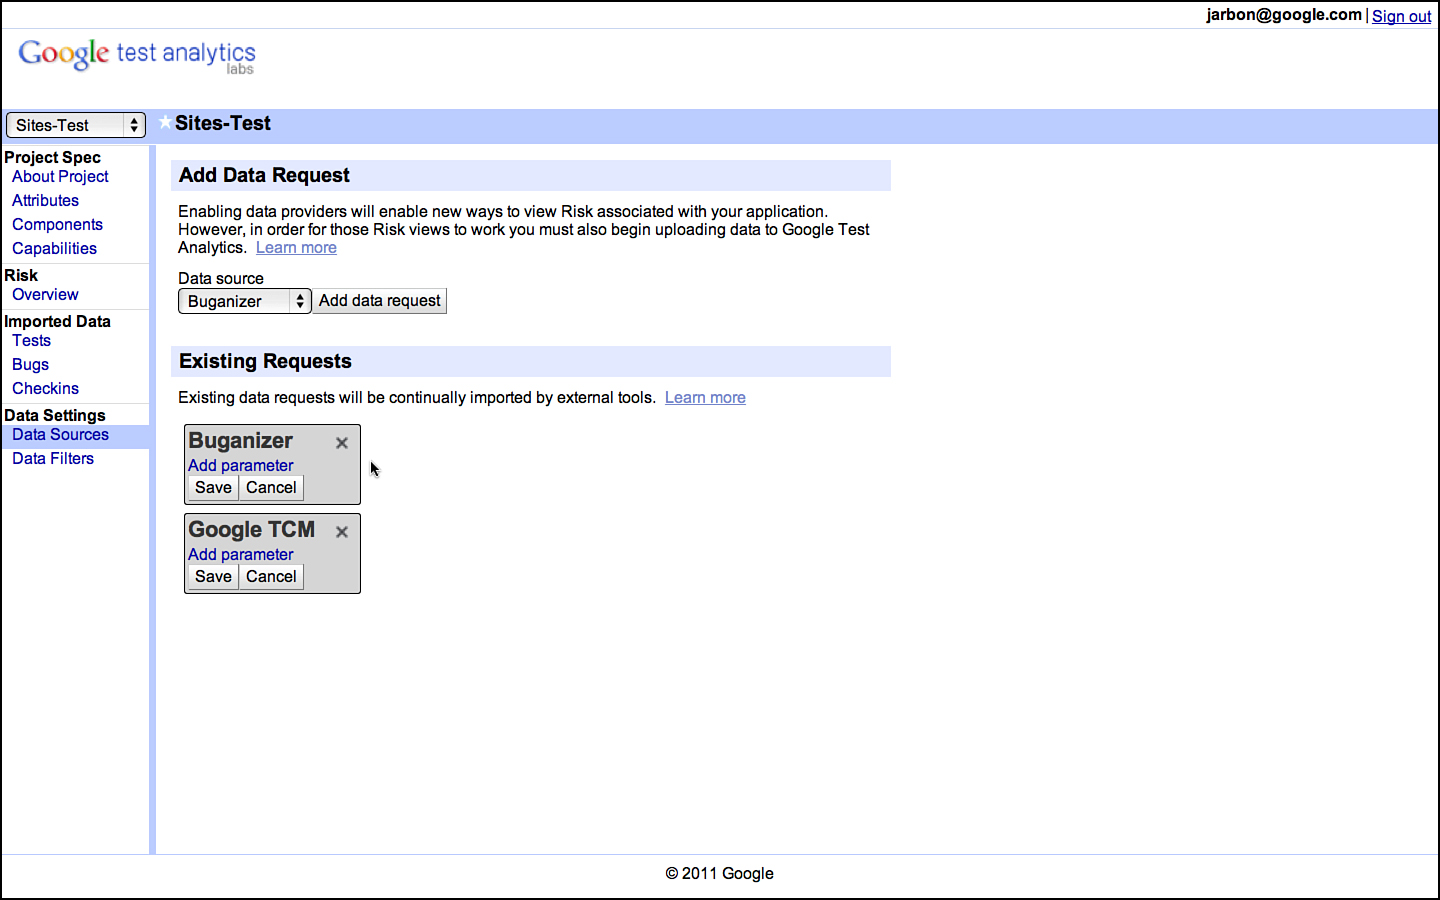
Figure 3.46 Test Analytics: linking data sources to risk.
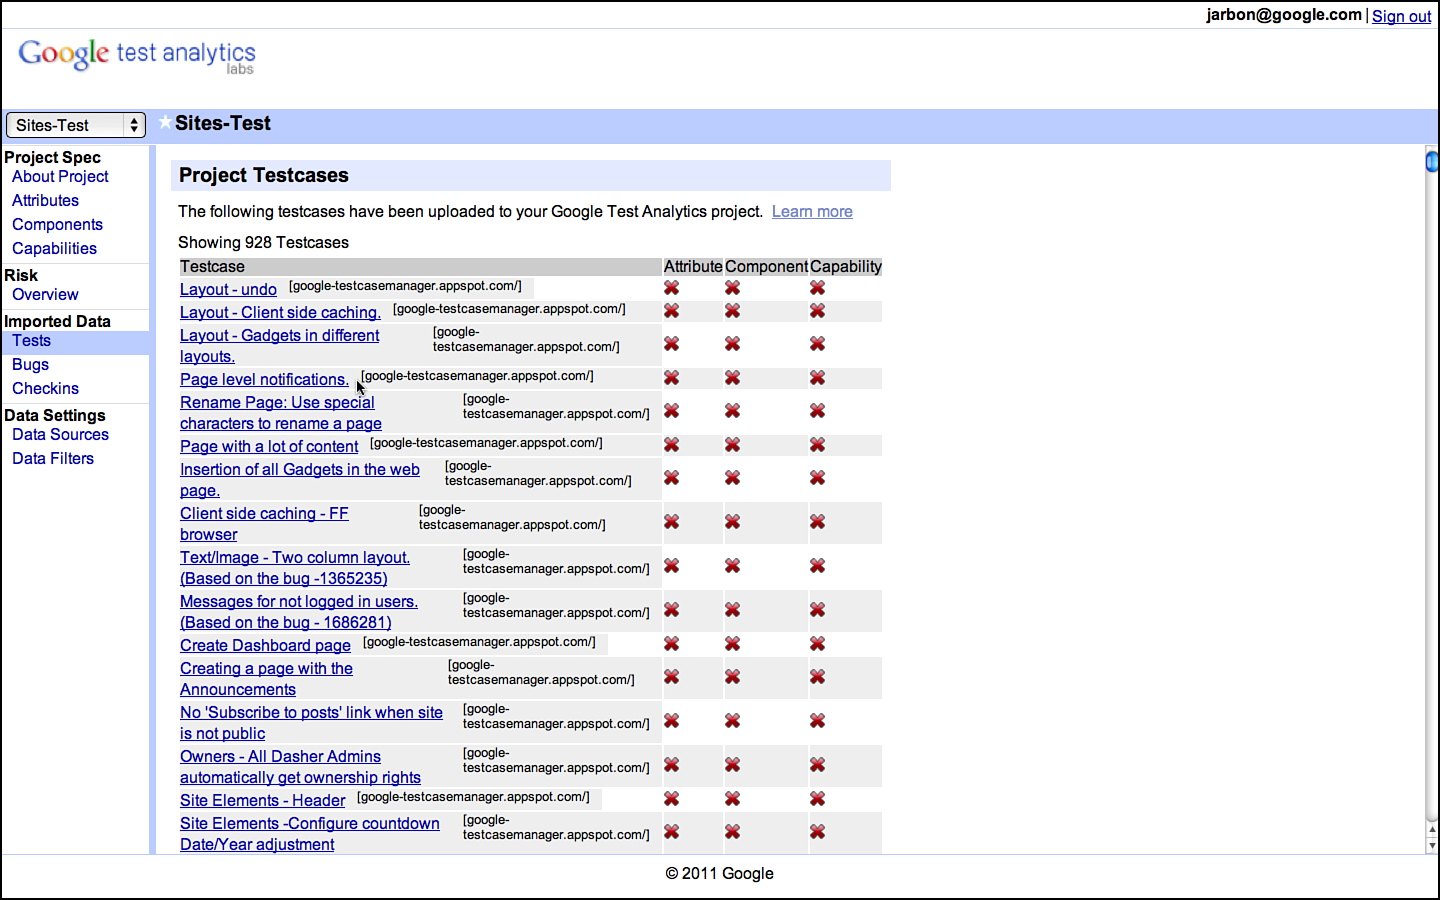
Figure 3.47 Test Analytics: linked tests.

Figure 3.48 Test Analytics: linked bugs.
GTA has an easily missed, but very significant feature. Testers can quickly turn the list of capabilities into a test pass. This was the most asked-for feature from teams. The capabilities consist of a simple list of high-level tests that should be tested before releasing the software. For teams that are small or exploratory-driven, such as Google Docs, this list suffices for a test case database.
The ACC matrix behind these test passes in GTA gives the TEs an interesting pivot in which to assign testers to a test pass. Traditionally testers are simply assigned test passes or test development by component area. ACC makes for an interesting pivot that is useful, though—testing by attribute. We’ve found some success in assigning test folks to focus not on components, but on attributes across the product. If someone is assigned the Fast attribute for a test pass, she can see how fast all the interesting components of the product are in a single pass. This brings a new kind of focus with the ability to find relatively slow components that may have been viewed as fast enough when tested independently.
A note on rolling up risk across projects is warranted. GTA doesn’t have this capability built in just yet, but every project should have its own ACC analysis, and risk should be evaluated according to that project only, not relative to other products in the same company. Someone with a broader view across the products should then apply a scalar for risk across all projects when rolling them up and looking at them in aggregate. Just because you work on a small internal tool for only a few other engineers doesn’t mean you can’t have maximum risk in your ACC assessment. Leave the business of relative risk to others who have visibility across projects. When assessing risk for your product, assess risk as if it was a company’s sole product, so it can always have the potential for maximum impact or high frequency.
We hope to have GTA openly available and open sourced shortly. GTA is currently in field testing with large companies other than Google. We hope to open source this, too, so other test teams can host their own instances in Google App Engine or even port and self-host it on different technology stacks if they like.
GTA aims to make risk analysis simple and useful enough that folks actually use it. Jim Reardon built GTA from the ground up and maintains the open sourced code (see Appendix C). As of the time of this writing, other large cloud-testing companies are looking to integrate this approach to risk into their core workflows and tools,25 and almost 200 external folks have signed up to leverage the hosted version of GTA.
Free Testing Workflow
Google strives to shave every last millisecond out of response times and make its systems as efficient as possible in the interest of scaling. Google also likes to make its products free. TEs are doing the same for tools and processes. Google asks us to think big, so why not try to tackle the notion of reducing the cost of testing to near-zero?
If we could make testing free, it would enable small companies to have more testing and it would enable startups to have some level of testing. If testing were free, it would mean a better Web, and a better Web is better for users and for Google.
Following are some thoughts on what free testing would look like:
• Cost next to nothing
• Instantaneous test results
• Require little or no human intervention
• Very flexible because one size does not fit all
We scoped our aspirations to the web to make the problem tractable, relevant, and inline with most projects at Google. We thought that if we tackled the web testing problems first, by the time we finished, the world would have moved to the cloud anyway, so we could ignore inherently painful things such as drivers and COM. We knew if we aimed for free, even if we ended up short, we would have something interesting.
The current model we have for free significantly reduces friction and cost for testing. We are starting to see it in our own labs and engineering efforts (see Figure 3.49). The basic outline of this testing workflow is as follows:
1. Test planning via GTA: Risk-based, quick, and automatically updated.
2. Test coverage: When new versions of a product are deployed, bots continually crawl the site, index the content, and scan for relevant differences. The bots might not know if it is a regression or a new feature, but they can spot any changes and route these to a human for evaluation.
3. Bug evaluation: When differences in the product are found, they are routed automatically to humans for quick evaluation. Are these differences a regression or a new feature? BITE provides rich context on existing bugs and tests during evaluation of these differences.
4. Exploratory testing: Continual exploratory testing is performed by crowd testers and early adopters. This catches bugs related to configuration, context, and the really difficult bugs that require human intelligence to induce and report.
5. Bug filing: Bugs are filed with just a few clicks of the mouse with rich data about what exactly on the page is broken, screenshots, and debug information.
6. Triage and debugging: Developers, or test managers, get near-real-time dashboards of bug trends, rich bugs with the data they need to investigate the failures, and even one-click repros before their eyes in their own browser of how the tester entered that state.
7. Deploying the new version and returning to step 1. Rinse and repeat.
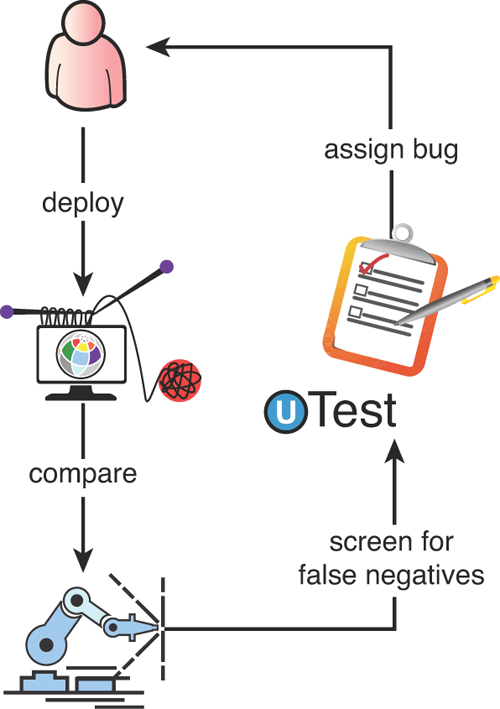
Figure 3.49 End-to-end workflow of free testing.
Web testing moves to a more automated and search-like stack and workflow. The key value of the previous approach to testing is that testers don’t need to grind through hundreds or thousands of regression tests just to find the few features that did change and might have regressed. As these bots can run 24/7 and complete a test cycle in minutes versus hours or days, they can be run more often; thus, they provide earlier detection of regressions.
The best part of this bot workflow is the faster cycle time between a product version being deployed and bugs coming in. The bots can run 24/7, the crowd is available 24/7, so developers can deploy and very quickly have rich feedback on the affects of their code changes. With continual builds and deployments, it is trivial to identify which of a handful of changes could have induced the bugs, and the changes are fresh in the mind of the developer who checked in the regression.
This basic flow works well for web pages, but should also be applicable to pure data applications, client UX projects, or infrastructure. Think about deploying parallel versions of your product or system and think about what the crawl and indexing would look like for that application. It’s likely a similar pattern will work for these testing problems, too, but are beyond the scope of this book.
• Overlay bug information onto a page and even specific elements on that page.
• Overlay test cases onto the page to be tested with a single Pass/Fail button for logging (see Figure 3.50).
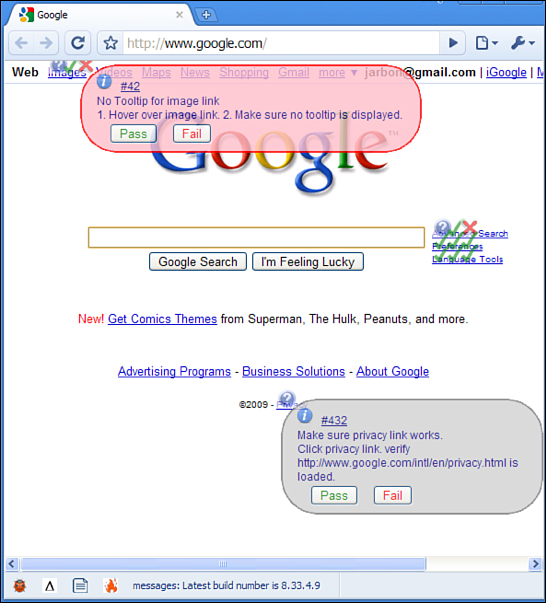
Figure 3.50 Test pass UX.
• Heat map showing where other testers had been before and what values they had used (see Figure 3.51).
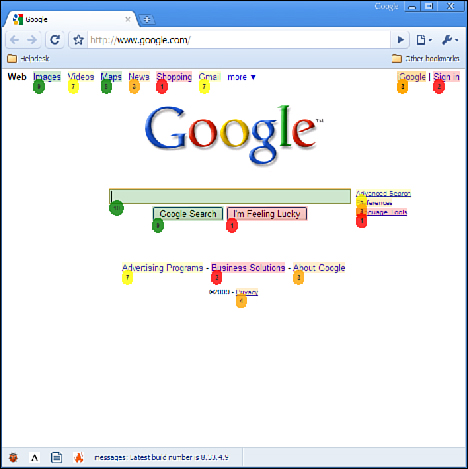
Figure 3.51 Tester coverage heat map.
External Vendors
For all the great testing talent we have at Google, we do realize our limitations. New and ambitious projects at Google can rise from seemingly nowhere and often require specialized testing expertise. We don’t always have the time to ramp up testing specialization or the time to hire someone, because the project can ship before we are ready to add value. Projects at Google are now spanning everything from devices, firmware, and operating systems to payment systems. They include everything from modifying the kernel of an operating system to modifying a rich UI driven by a remote control and to worrying about whether the device works on every television in the market.
We realize our limitations, so we get help from the experts, and sometimes those experts are external vendor agencies. A good example of this is Chrome OS. We realized early that one of the riskiest areas was our Wi-Fi and 3G connection. This part of the operating system and physical devices would vary between manufacturers, and a cloud device without an Internet connection isn’t quite as compelling a product. Also, security updates and software fixes are delivered over the network; network connectivity can block these other important features. At the same time, another company was having 3G “conductive connectivity issues.” This was not something to be left to well intentioned but nonspecialized testing efforts.
Because Google was just getting into the consumer devices space, we didn’t have anyone in house at Google who had the physical test equipment or even knew how to use it if we had it lying around. Our testing at this point was happening by folks trying to manually switch between routers while sitting at a desk next to a rack of about 20 current commercial Wi-Fi routers. In just a few weeks, we had reports from our vendor indicating issues with switching routers and decreased throughput if the user was living in an apartment building with many different routers all within range.28 Other issues related to using the prototype hardware and boards also occurred. Almost immediately we got graphs like those in Figure 3.52 and Figure 3.53 that showed severe drops in throughput. There shouldn’t have been sudden dips in the curve, but there they were. The developers used this data to fix the issues about the time of our internal dogfood.
Figure 3.52 Expected curves for rate versus range.
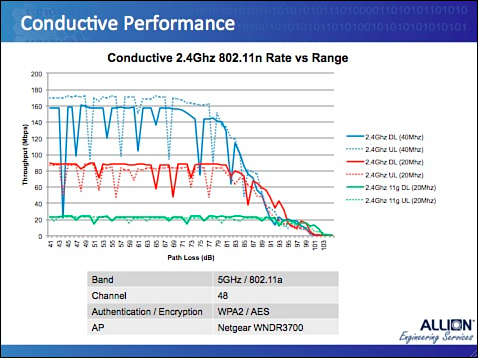
Figure 3.53 Graph of early Chrome OS prototype rate versus range.
Interestingly, even lower-level engineers at Google can initiate external vendor relationships like this. Our ability to move quickly is a major part of our ability to ship quickly. We now have on-site facilities to measure much of this and continue to leverage vendor expertise, but the ability for us to leverage external vendors and spin these efforts up quickly was critical to successful network connectivity in the field when Chrome OS shipped to the world.
We had another unexpected benefit of partnering with external vendors with experience in this space. We asked them to review our list of Hardware Qualification Tests. These are tests that we ask our hardware vendors to run on their side before sending them to Google for further testing, eliminating much of the back and forth when it comes to sending hardware around. While reviewing our tests, they realized some areas were missing and were kind enough to format all the test cases in a form consistent with other hardware qualification tests that they had seen in the past. This help ensured our first drops of the tests to the large PC manufacturers were easily readable and complete. It pays to be humble and ask for testing help from external experts whenever possible.
An Interview with Google Docs TE Lindsay Webster
Lindsay Webster is a TE for Google Docs in Google’s New York City office. Lindsay is a no-nonsense engineer who is known around the company as the go-to tester who can whip a development team into shape with regard to their testing practices. The way she works and the way she impacts both a team and product quality makes her the poster child for the Google TE.
The authors recently sat down with Lindsay to get her take on testing.
HGTS: How do you approach a new project? What are the first questions you ask? What are the first tasks you perform?
Lindsay: For a new project, I first get to know the product from a user perspective. If possible, I become a user myself with my personal account and personal data. I really try to sink myself into the full user experience. The way you look at a product totally changes once you see your own actual data in it. Once I have this user mindset, I do the following:
• Understand the product from end-to-end. If there is a design doc, I’ll review that, and if there are design docs for major features, I’ll review those. Give me a doc and I will read it!
• Once the docs are absorbed I look to the state of the project, specifically the “quality state” of the project. I review the bug count. I see how issues are grouped. I look at the types of bugs that are open, which have been open the longest, what types of bugs were created recently, and also try to get an idea for a find-to-fix ratio.
HGTS: Per developer or for the whole team?
Lindsay: Both! Seriously, you have to get a complete insight into your team to be truly effective.
I also check the code repository for the actual app code. I look for matching unit tests for each sizeable class. Do they pass if I run them? Are they meaningful and complete unit tests? Are there integration or end-to-end tests? Do these still pass? What is their historical pass rate? Are they very basic scenarios or do they cover corner cases as well? Which packages of the code repository see change most often? Which ones haven’t been changed in a long time? The work developers do to document their testing practices is very informative.
I also review any automated tests. Are there any? Are they still running and passing? I’d check the code for these tests either way, though, to understand how they are stepping through the application, if they are complete, and if the assumptions, pass, and fail points are good enough or if they need work. Sometimes automation just covers simple tests. Sometimes there are complicated user scenarios included in the automation suite (this is a very good sign).
Once I hit all the docs, the team is next. I ask them about how they communicate and what their expectations are for testers. If they use mailing aliases, I join all of them, and if there is a team IRC channel or other means of real-time, distributed communication I get involved there.
Asking for testing expectations is where I find out a lot about how and what the dev team doesn’t test.
HGTS: I am at once tired just thinking about all this work and incredibly grateful for testers like you! But once you plow through the docs and the people, there’s only one thing left, the app right?
Lindsay: Yes! Once the recon is done, it is time to get down to business. I always start by breaking the application down into meaningful components of functionality. If there is a little overlap, that’s okay, but I want it high level enough that I am not in the weeds, but low level enough that I am able to get to a point where I am listing subcomponents and features.
Once I have an initial set of functionality buckets, I can prioritize the buckets according to what needs to be tested first. What are the riskiest parts of the application according to the features and capabilities I’ve discovered?
Once organized here, I review the bug repository again, this time with the goal of creating the same kind of buckets in the repository for these components. This will make it really easy to find already existing bugs, which will lead to less duplicate bug reports and more visibility into what the reoccurring issues are.
Next, I start walking through all of these components in the application in a more detailed way, creating user stories for the components as I step through the prioritized list. For more detailed features that require step-by-step instructions in order to conclude pass/fail, I write test cases and link to those from the larger user story for that component. I try to always include screenshots or video and a quick reference to quirky bugs to look for or a quick link to the current bugs for that section.
Once I have a test set, I look for gaps in coverage by checking the bugs again and reviewing the application (again). So much of what testers do is cyclical! This is also where I go down the list of different types of testing and see how we are covered: security, compatibility, integration, exploratory, regression, performance, load, and so on.
After I have this foundation, I usually just maintain it by keeping it up to date: updating any changes to the tests, adding new documentation for new features, and updating screenshots/video for components that change over time. It’s good to watch which bugs make it to production after this because that can also inform where there may be gaps in test coverage.
HGTS: How does the user fit into what you do as a TE?
Lindsay: I try to make myself a user, so users fit in at a very basic level for me. I don’t think it’s possible to really test an application effectively unless you can somehow place yourself in the perspective of the user. That’s why testing can be so much more than checking if a build works; it can be feedback on intuitiveness of the application, industry standards, and just what the right thing to do is, in general.
HGTS: How do developers generally view your work? How do you deal with them if they don’t see testing as valuable?
Lindsay: Developers typically underestimate my work until they have worked with me for a couple of months. Once I have completed all the work I just explained, I schedule a meeting with the team and I present the testing process that I have set up. This face-to-face is really important and a chance for me to describe to the developers just how seriously I am taking their application. It results in a lot of questions and give-and-take. I get good feedback, and they know they are in good hands.
After I present the entire process and the changes, updates, and improvements I have made, any question on the value I bring usually flies out the window.
Another thing that might seem a little counterintuitive but also contributes to the developers valuing my work more is when I openly and transparently state the components or areas I will not own for testing and communicate justifications for why they should own those. A lot of testers avoid advertising or calling attention to the things they won’t be testing for fear of appearing less valuable, but in my experience, it has the opposite effect. Developers respect you for it.
HGTS: Tell us a little about your testing of Google Sites. How did you approach the project? What documents did you produce and what format were they in? How did you communicate your findings and results to developers?
Lindsay: Testing on Sites has been a great challenge because the product is used by such a large number of people, it was an acquired company, and it has been around Google much longer than a lot of other projects.
I ramped up with Sites by using the product, creating sites myself, and just trying to get to know the product in general. I reached out to people who I knew used it a lot. For example, my condo association moved our community website to Google Sites a few months earlier, so I spoke to the board members about that process to find out how it worked for them. Design documents or specification documents aren’t really kept up to date on this team, so I had to just start breaking down the product into digestible pieces and documenting components and subcomponents one by one.
The fact that it is an acquisition does play into how it is coded. Google does things differently and the fact that it was outside what I was used to slowed me down a little. The code wasn’t where I expected it to be. It was structured differently than I was used to. Also, start-ups aren’t known for writing a lot of tests—unit, end-to-end, or automation—so the JotSpot-turned-Google-Sites project has had to bolt that on as they go along and in some places, different styles and approaches were used than others. But this is stuff you learn to deal with as a tester.
With the project having existed so long, this made navigating the bug repository that much more difficult because there were years of bugs. This wouldn’t have been so bad if the repository had a good bug structure, but they hadn’t really built out detailed subcomponents to help categorize issues, so it took a long time to migrate bugs into a detailed component structure.
I put together a centralized site (using Google Sites of course!) to bring all of the documentation for testing Sites to one place: user stories, testing environment info, test team info, testing per release tracking, and so on. I used a spreadsheet (nothing too fancy) to list all of the components and subcomponents to test in prioritized order as a quick way to organize the testing per release.
As I wrapped up all of my testing overhaul work, I did a presentation for the dev team in order to give them a complete view of the testing process. That presentation really helped a lot for the dev team to understand the scope of testing and the challenges. I certainly felt more appreciated for my effort afterwards!
HGTS: Can you describe a great bug you found and how you found it?
Lindsay: “Dates” testing has always proved entertaining for me in applications with date fields. I like to test for future dates and dates that are far in the past, and I usually catch some pretty strange error behavior or even some pretty fun calculation errors that come out of that. One bug that comes to mind was one where future dates in a date of birth field would result in age calculations that were pretty out of whack. Sue me, I think bugs are funny!
HGTS: How do you determine your impact?
Lindsay: Bugs that make it out to customers are an important measure for me to monitor the impact I am bringing to a team. I like that number to be around 0, roughly! Also, I really take to heart what the buzz is about my project. If my project has a reputation for bugs or a crappy UI, say, in user forums (watch user forums closely!), I take that as signal for me to improve the level of impact I have on a project. A project can also suffer from bug debt, old bugs that never get fixed, so I also measure my impact by how many old bugs exist that still affect users today. I make an effort to escalate these and use the time a bug has existed as part of the justification for upping its priority.
HGTS: How do you know when you are done testing?
Lindsay: It’s hard to say. For testing per release, I am usually gated more by the release date than when I would consider testing complete. Also, with the introduction of new browser versions and new devices to access your web app with—even for a web application with no active development—there is still very much a reason to test. I think the gating point for determining when you can stop testing is when you can feel confident that if any bugs do remain, they are in components (or features or browsers or devices) that have a relatively low usage and thus a low impact on users if they are broken in some way. This is where prioritizing the functionality and supported environments for the application really comes into play.
HGTS: How do you get bugs fixed?
Lindsay: Being an advocate for bug resolution is an important facet of my work. I am constantly battling against feature development versus developer time for bug fixes. So I am sure to make user feedback my ally when I am justifying a bug fix. The more user complaints I can find about a bug that might not otherwise be fixed, the more I can prove that the developer’s time is not wasted by fixing the issue instead of starting on that new feature. At Google, we have customer service reps for enterprise products like Sites, so I also make sure to be closely aligned and in contact with these groups so that I can stay in touch with what the reoccurring issues are that they hear about from our customers.
HGTS: If you could waive a magic wand and fix one aspect of your job, what would it be?
Lindsay: Wow, the “one aspect” can’t be “everything” can it? Okay. If I could fix anything, I would have basic, dummy test cases or user scenarios that did not need to be documented: Every tester would automatically know them somehow. CRUD operations apply to everything, so detailing them for every feature becomes cumbersome. I think moving to higher-level user stories instead of using a prescribed test case model has really helped me to be less impacted by this, but I would still appreciate this problem being gone all together.
HGTS: How does your work impact the decision to release a product?
Lindsay: I justify that a feature or release can’t go further by putting it in terms of impact on the user. Thankfully, my teams usually agree. I don’t block a release unless there is something pretty serious. So it’s important for me to maintain that trust with my team that if I feel strongly enough about blocking it, then they probably don’t want it out there either.
HGTS: What do you like best and worst about your role?
Lindsay: I really like the flexibility that having a skill set like this affords me. I am technical but user-facing. What project wouldn’t want someone like me? I can bring value to so many different types of projects. I think launching a product or new feature can also be a little scary for teams, so the fact that I can bring calm and confidence to that with my feedback really makes me feel like a positive, helpful force.
HGTS: What is different about testing at Google versus other companies?
Lindsay: The independence. I have a lot of freedom in choosing the projects that I work on fulltime, and also on a 20 percent basis. The 20 percent time is a concept at Google where we can spend one day a week, or 20 percent of my time in general, working on a project of my choice. This has allowed me to broaden my skill set by working on different types of projects, as well as inspired me and kept me enthusiastic about work when I might otherwise feel like it’s Groundhog Day.
HGTS: How do SETs feel about your work?
Lindsay: SETs can miss the importance of someone tracking the bug repository and testing per release until they get that help and see the difference that it makes in their product. Even if they think automation is covering all testing scenarios (yeah right!), there is no one there doing exploratory testing to develop new test cases that break functionality. Also, there is no one tracking all the bugs uncovered by automation over time and lining those up with or against older smaller bugs and user feedback to advocate getting issues resolved. Because I bring these things to the table, the SETs I have worked with usually really appreciate the changes I bring to a project. But there are some that don’t respect my work as much, but they, just like developers who might feel like that, are the ones who haven’t worked with me or another TE before. Once they do, those attitudes usually change pretty quickly!
HGTS: How do you interact with SETs?
Lindsay: I organize the testing strategy for the whole team, including SETs. Where SETs normally run into an issue of not knowing where to start coding tests or tools, I can show them prioritized documentation of what needs to be tested most and can back that up with bug data as well. I can also give them feedback on how effective their solutions are for preventing bugs with real data. So my interactions tend to be around the organization and feedback that I can bring to an SET’s work.
An Interview with YouTube TE Apple Chow
Apple Chow is a TE for Google Offers and before that a test lead for YouTube in Google’s San Francisco office. Apple likes new challenges and is constantly looking to leverage the latest tools and techniques for testing.
The authors recently chatted with Apple about her thoughts on testing in YouTube.
HGTS: Apple, what brought you to Google? And with a name like yours, surely you thought about employment elsewhere?
Apple: Ha! [email protected] is very tempting! But I came to Google because of the breadth of our product offerings and the opportunity to work with really smart and knowledgeable people. I like to change projects and I love a wide variety of challenges, so Google seemed like the right place for someone like me. I get a chance to make a difference to millions of users across a lot of different product areas. Every day is a new challenge and I never get bored. Of course the free massages are definitely a plus.
HGTS: What did you think of the interview process for TEs and SETs?
Apple: Google focuses on finding generalists who can learn, grow, and tackle a wide variety of problems. This goes for TEs, SETs, and SWEs in my opinion. A lot of places interview for specific roles on a specific team and the people you meet are all going to be people you will work with closely. A Google interview doesn’t work that way. The people interviewing you are from a variety of different teams, so you get a lot of different perspectives. All in all, I think it’s a process designed to get good people who can work on almost any team at Google. This is important, too, because it’s easy to move around within Google so you can always choose a new product area to work in, a new team to work with. Being a generalist is important in this kind of a structure.
HGTS: You have worked at many other tech companies. What would you say was the most surprising thing about software testing at Google?
Apple: A lot of things are different. Perhaps I am biased because I like Google so much, but I would say that our TEs and SETs are more technical than at most other companies. At other large companies I worked for, we had specialized automation teams and then a bunch of manual testers. SETs at Google have to write code; it’s their job. It’s also rare to find a TE who can’t code here. These coding skills allow us to be more impactful early on when unit testing is far more prevalent and there’s nothing really to test end-to-end. I think our technical skills are what make us so impactful here at Google.
Another thing that makes Google unique with respect to test is the sheer volume of automation. Most of this automation executes before manual testers even get hold of the product. When they do, the code they get to test is generally of very high initial quality.
Tooling is another difference. In general, we don’t use commercial tools. We have a culture where tooling is greatly appreciated and 20 percent time makes it so that anyone can make time to contribute to the internal Google toolset. Tools help us get past the hard and repetitive parts of testing and focus our manual efforts to really impact things where a human is actually required.
Then, of course, there is the developer-owns-quality and test-centric SWE culture we have here that makes it easy to relate to SWEs. We’re all in the quality game together and because any engineer can test any code from any machine, it makes us nimble.
HGTS: What things would you say are pretty much the same about testing at Google?
Apple: Software functionality that is hard to automate is just as hard to test or get right as at any other company. When there is a huge rush to get features out, we end up with code that isn’t as well tested as we’d like it to be. No company is perfect and no company creates perfect products.
HGTS: When you were a TE for YouTube, what feature areas were you responsible for?
Apple: I’ve worked with many teams and helped launch many features at YouTube. Some notable mentions would be the launch of the new Watch page that is a complete redesign of the YouTube video page, one of the most viewed pages on the Internet I am happy to say! Another memorable project is our partnership with Vevo. It is a new destination site for premium music content with YouTube powering the video hosting and streaming. It’s a joint venture with Sony Music Entertainment and Universal Music Group. On day one of the launch, more than 14,000 videos went live, and they averaged 14 M views on VEVO premium videos on YouTube.com for the next three months, following the December 8, 2009 launch. I also coordinated test efforts for the major rewrite of the YouTube Flash-based video player during our move from ActionScript 2 to ActionScript 3, and the launch of the new Channel and Branded Partner pages.
HGTS: So what does it mean to be a lead in testing at Google?
Apple: The lead role is a coordination role across the product, across the team, and across any product that our work might impact. For example, for the Vevo project, we had to worry about the YouTube player, the branded watch component, channel hierarchy, traffic assignment, ingestion, reporting, and so on. It’s definitely a “forest and not trees” mindset.
HGTS: How have you adapted the concepts of exploratory testing to YouTube?
Apple: With a product that is so human-oriented and visual as YouTube, exploratory testing is crucial. We do as much exploratory testing as we can.
HGTS: How did the YouTube testers take to the idea of exploratory testing?
Apple: Oh, it was a huge morale booster. Testers like to test and they like to find bugs. Exploratory testing increased the level of engagement and interest among the testers. They got to put themselves in the mindset of the person in the tour and, with those specific angles, got creative with the types of tests they conducted to break the software. This made it more fun and rewarding as adding more tests revealed interesting and esoteric bugs that would have otherwise been missed or discovered through more mundane and repetitive processes.
HGTS: You mentioned tours. Did James make you use his book?
Apple: When James first came to Google, that book was new and he did a couple of seminars and met with us a few times. But he’s up in Seattle and we’re in California, so we didn’t get much hand holding. We took the tours in the book and ran with them. Some of them worked, some didn’t, and we soon figured out which ones were the best for our product.
HGTS: Which ones worked? Care to name them?
Apple: The “money tour” (focus on money-related features; for YouTube, this means Ads or partner-related features) obviously got a lot of attention and was important for every release. The “landmark tour” (focus on important functionalities and features of the system) and the “bad neighborhood tour” (focus on previously buggy areas and areas that we find to be buggy based on recent bugs reported) have been most effective in uncovering our most severe bugs. It was a great learning experience for each one to look at the bugs others in the team had filed and discussing the strategy in finding them. The concept of tours was really helpful for us to explain and share our exploratory testing strategy. We also had a lot of fun joking about some of the tours such as “antisocial tour” (entering least likely input every chance you get), “obsessive compulsive tour” (repeating the same action), and the “couch potato tour” (provide the minimum inputs possible and accepting default values when you can). It was not only helpful to guide our testing; it built some team unity.
HGTS: We understand you are driving a lot of Selenium testing of YouTube. What are your favorite and least favorite things about writing automation in Selenium?
Apple: Favorite: Easy API, you can write test code in your favorite programming languages such as Python, Java, and Ruby, and you can invoke JavaScript code from your application directly—awesome feature and very useful.
Least favorite: It’s still browser testing. It’s slow, you need hooks in the API, and tests are pretty remote from the thing being tested. It helps product quality where you’re automating scenarios that are extremely difficult for a human to validate (calls to our advertising system backend, for example). We have tests that launch different videos and intercept the Ad calls using Banana Proxy (an inhouse web application security audit tool to log HTTP requests and responses). At a conceptual level, we’re routing browser requests from browser to Banana Proxy (logging) to Selenium to Web. Thus, we can check if the outgoing requests include the correct URL parameters and if the incoming response contains what is expected. Overall, UI tests are slow, much more brittle, and have a fairly high maintenance overhead. A lesson learned is that you should keep only a few such high-level smoke tests for validating end-to-end integration scenarios and write as small a test as possible.
HGTS: A large portion of YouTube content and its UI is in Flash; how do you test that? Do you have some magic way of testing this via Selenium?
Apple: No magic, unfortunately. Lots of hard work here. There are some things Selenium does to help and because our JavaScript APIs are exposed, Selenium can be used to test them. And there is the image “diffing” tool pdiff that is helpful to test the rendering of the thumbnails, end of screen, and so on. We also do a lot of proxy work on the HTTP stream to listen to traffic so we know more about changes to the page. We also use As3Unit and FlexUnit to load the player, play different videos, and trigger player events. For verification, we can use these frameworks to validate various states of the software and to do image comparison. I’d like to say it’s magic, but there is a lot of code we’ve written to get to this point.
HGTS: What was the biggest bug you or your team has found and saved users from seeing?
Apple: The biggest bugs are usually not that interesting. However, I recall we had a CSS bug that causes the IE browser to crash. Before that we had never seen CSS crash a browser.
One memorable bug that was more subtle came up during the new Watch Page launch in 2010. We found that when the user moves the mouse pointer outside of the player region, in IE7, the player would freeze after some time. This was interesting because users would encounter this bug if they were watching the same video for an extended period of time and moving the mouse around. Everything got slower until the player finally froze. This turned out to be due to unreleased event handlers and resources sticking around and computing the same things over and over again. If you were watching shorter videos or being a passive viewer, you wouldn’t observe the bug.
HGTS: What would you call the most successful aspect of YouTube testing? The least successful?
Apple: The most successful was a tool to fetch and check some problematic URLs. Although it was a simple test, it was really effective in catching critical bugs quickly. We added a feature to make the problems easier to debug by having it provide stack traces that the engineers could then use to track down problems and develop fixes. It quickly became our first line of testing defense during deployment and brought along considerable savings in testing time. With only a little extra effort, we extended it to hit the most popular URLs from our logs plus a list of hand-picked ones. It’s been very successful.
The least successful is probably our continued reliance on manual testing during our weekly pushes. Given that we have a very small time window for testing (code goes out live the same day it’s frozen) and we have a lot of UI changes that are hard to automate, manual testing is critical in our weekly release process. This is a hard problem and I wish we had a better answer.
HGTS: YouTube is a very data-driven site as much of the content is algorithmically determined; how do you verify that the right videos are displayed the right time and place? Does your team verify the video quality? If so, how do you do this?
Apple: We measure how much and which videos are being watched, their relationship to each other and a whole lot of other variables. We analyze the number of buffer under-runs and cache misses, and we optimize our global-serving infrastructure based on that.
We have unit tests for video quality levels to make sure the right quality is used. After I changed groups, our new team wrote a tool to test this in more depth. The tool is open-sourced29 and it works by having FlexUnit tests that use the embedded YouTube player to play a variety of test videos and make some assertions about the player state and properties. These test videos have large bar codes on them to mark frames and the timeline that are easily recognizable despite compression artifacts and loss of quality. Measuring state also includes taking snapshots of the video frames and analyzing them. We check for the correct aspect ratio and/or cropping, distortion, color shifts, blank frames, white screens, synchronization, and soon—issues found from our bug reports.
HGTS: What advice do you have for other testers of Web, Flash, and data-driven web services out there?
Apple: Whether it’s a test framework or test cases, keep it simple and iterate on the design as your project evolves. Don’t try to solve everything upfront. Be aggressive about throwing things away. If tests or automation are too hard to maintain, toss them and build some better ones that are more resilient. Watch out for maintenance and troubleshooting costs of your tests down the road Observe the 70-20-10 rule: 70 percent small unit tests that verify the behavior of a single class or function, 20 percent medium tests that validate the integration of one or more application modules, and 10 percent large tests (commonly referred to as “system tests” and “end-to-end” tests) that operate on a high level and verify the application as a whole is working.
Other than that, prioritize and look for simple automation efforts with big payoffs, always remembering that automation doesn’t solve all your problems, especially when it comes to frontend projects and device testing. You always want smart, exploratory testing and to track test data.
HGTS: So tell us the truth. YouTube testing must be a blast. Watching cat videos all day ...
Apple: Well, there was that one April Fool’s day where we made all the video captions upside down. But I won’t lie. Testing YouTube is fun. I get to discover a lot of interesting content and it’s my job to do so! And even after all this time, I still laugh at cat videos!