Chapter 8. Tracking and Reporting
Learning Objectives
• Understand Kanban, its effectiveness, and when it is used
• Learn the definition of work in progress (WIP) limits and how they can identify bottlenecks in processes
• Explore different tracking mechanisms used in XP, Scrum, Lean, DSDM, and Crystal
• Understand burn charts, both burn-up for release management and burn-down for sprint tracking
• Examine feature-driven development (FDD) parking lots and how they assist in tracking large and complex projects
• Learn the different strategies for tracking quality through an iteration
• Understand the importance of meetings in tracking progress and course correcting
• Learn the purpose and desired outcome for each meeting—the daily stand-up, the Sprint review, and the retrospective
• Consider the metrics for measuring the success of Agile projects
The previous chapters have led us to this point—where we need to track and report on our progress and results. All of our efforts to prepare the requirements (Chapter 5), plan and groom the activities (Chapter 6), and test our code (Chapter 7) are critical steps toward producing quality software that will meet the customer’s needs and deliver business value. This chapter is focused on tracking and measuring our success and quickly identifying the areas that need attention and improvement. We review the tools that are used in tracking, such as Kanban task boards, burn charts, information radiators, and progress charts. We show how quality is built into the process and then discuss the meetings or ceremonies where progress is measured and adjustments are made, if necessary. We explain how to define success within Agile, including the ever-important metric of customer satisfaction.
Kanban
Kanban is a methodology that we have not focused on because it is fundamentally different from the others that we have discussed. Most of the Agile methodologies deliver working software in a time-boxed fashion, meaning that the work proceeds in iterations, or sprints. Conversely, Kanban operates in a “continuous flow” model, meaning that there is no time box for development; tasks are continuously added to the backlog and removed as they are completed. Kanban has three primary characteristics:
• Visualize the workflow
• A Kanban board maps the steps of the workflow in columns across a board.
• Items, or tasks, are represented on cards or sticky notes and are tracked as they move through the workflow steps.
• Limit work in progress (WIP)
• Assign limits to each column, or workflow step, so that no one group or person can be overloaded with work.
• The WIP limits naturally identify bottlenecks in the process so they can be addressed, in keeping with the Lean principles.
• By understanding the workflow and removing the bottlenecks, the teams will discover the time it takes for a task to move from creation to resolution, thus providing the organization with metrics for lead time (Kniberg and Skarin 2010, p. 20).
How does Kanban compare with Scrum? Scrum is a great fit for products/projects with a time-boxed workflow, such as product development efforts, that can progress in a series of sprints or iterations. On the other hand, Kanban is a better fit for an unpredictable workflow, unplanned work, and development tasks that require deployment in less time than a typical iteration. For example, Kanban is a great fit for help desk tickets and custom software support where small tickets are continually created and require speedy resolution.
Let’s look at Cayman Design for examples. The new calendar option, where customers can buy print calendars with weather-related historical information, is new product development. It makes sense for that work to progress on a sprint cycle, with new features added in each sprint until the entire product is ready for release.
Our product that is in production, however, may have issues that our current customers need addressed, and we have a support team that works those tickets. One customer may report an issue with the browser Chrome; the support team needs to log that ticket, investigate it, write code to correct the issue, and then push that code to production. The customer would not want to wait for that story to be groomed, prioritized, estimated, and put into a sprint and then worked on—they need it fixed right away. This is where Kanban is a great option because it shares all of the Agile elements that make this work so well—collaboration, clear prioritization, small increments of work, fast delivery of working software—and moves it to a continuous workflow.
Kanban Board
Teams often use white boards and sticky notes to create the Kanban board, but any visual tool can be used, from a chalkboard to a large sheet of paper and markers. There are also software programs that create online Kanban boards, which is helpful for distributed teams.
Looking at a specific example, we have five columns on our Kanban board: “backlog,” “not started,” “in progress,” “testing,” and “completed.” Because workflow stages can vary based on the nature of the work, the columns will change to match the needs of the particular team.
• Backlog—The product owner puts all of the requirements (stories) on sticky notes in priority order. The estimated effort of the requirement is also noted. This list could be quite lengthy, depending on the size of the backlog.
• Not started—These stories have been selected by a developer and are therefore assigned, but the development work has yet to begin. This is equivalent to a “pending” queue, or the next items to be worked.
• In progress—These are the requirements that are currently being coded by a developer.
• Testing—This is when the testing is done to ensure that the code is working as intended.
• Completed—The requirements in this column are considered ready to be delivered to a customer.
Work in Progress (WIP) Limit
Kanban allows for limiting the amount of work (stories) in a given stage at any point in time; this limit is commonly referred to as the work in progress (WIP) limit. WIP limits help organizations to identify where there are bottlenecks in their processes. One of the key tenets of Agile is increased transparency, and the Kanban WIP limits bring attention and focus to the areas of the business where things are slowing down so we can quickly address and correct the situation.
For example, on our Kanban board, we have the following WIP limits:
Backlog: No limit
Not started: WIP limit of 5
In progress: WIP limit of 4
Testing: WIP limit of 3
Completed: No limit
By having these limits, we can identify where our bottlenecks are. Let’s walk through an example to see how this works. Take a look at Table 8.1.
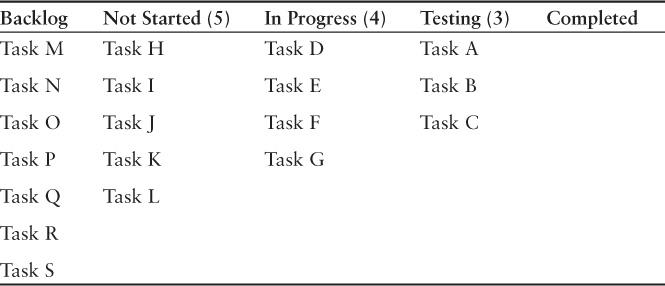
In this rudimentary example, all of the WIP limits have been reached, and each person is working diligently on his or her tasks. If the developer finishes task D, he cannot move it into testing because their queue is already full. He must wait until task A, B, or C is completed in testing and moved to completion before task D can be pulled into the testing queue. To move task D into testing now would violate the testing WIP limit of 3.
Therefore, our developer who has completed task D cannot pull task H in from the “not started” queue, because adding that task to the “in progress” queue would violate the WIP limit of 4.
There are many reasons why this is valuable and reinforces the values of Agile. Perhaps the developers are moving very fast and, as an unfortunate result, they are writing buggy code. Thus, the testing queue is backed up because they cannot get tasks A, B and C to pass testing. The developers are finishing more tasks but they cannot move them to testing yet—and they cannot pick up any new tasks. Therefore, the developers can help the testers with their tasks; the testing queue will get cleared, and the developers will understand that the better code they write, the more smoothly the process will go.
The WIP limits also prevent the product owner (or executives) from forcing too much work on the team. The “not started” queue has a WIP limit of 5, so those represent the stories or tasks that are well defined and prioritized. Just as Scrum limits the amount of work by allowing the team to commit only to what they can reasonably finish in the duration of a sprint, the WIP limits accomplish the same goal by limiting how much work can be in each queue.
In this example, WIP limits are set by the number of tasks, but as you can imagine, not all tasks are equal; some tasks are much larger or more complex than others, so some teams set their WIP limits by the number of story points, which were described in detail in Chapter 6, “Grooming and Planning.” WIP limits could also be based on hours required to complete the task. Setting and enforcing WIP limits can be challenging for teams, so some teams that are new to Kanban start with the workflow and the Kanban board and add WIP limits later, when they are more comfortable with the process.
The WIP limits also help with the third characteristic of Kanban—the ability to measure lead time. Just as a Scrum team will establish their velocity, Kanban teams need to understand the time it takes for a task to flow from beginning to end. The team could then predict that if a task is accepted into the development queue on Tuesday, it will typically be released on Friday, barring any unforeseen circumstances.
The Kanban principles are built into Lean software development, because Lean is very focused on cumulative flow diagrams and visual controls (Anderson 2003, p. 93). Lean principles focus on eliminating waste, specifically “muda,” “mura,” and “muri”; an effective Kanban board will address all three. “Muda” is waste created by an activity in the process that adds no value; value stream mapping, which we discussed in Chapter 6, is designed to identify and eliminate muda. When diagramming the workflow to define the columns in Kanban, muda would be evident as a step that is not valuable. “Mura” is the waste generated by unevenness in operations. With the visibility of the Kanban board, we can easily see the work flowing through the system—or across the board—to isolate inefficiencies where work is uneven. Finally, there is “muri,” which is the overburdening of people or equipment with more work than they can reasonably manage. The WIP limits in Kanban detect muri by clearly identifying bottlenecks in the process where more work is being added than can effectively be delivered (Tera TPS 2012).
Kanban is a wonderful alternative for teams who want to embrace all of the values and principles of Agile but whose work is unpredictable and difficult to plan. In many organizations, both Scrum and Kanban are utilized, depending on the makeup of the work.
Review 1
At this point, the reader should be able to answer Review Questions 1–5.
Tracking
Regardless of the particular methodology being used, tracking progress is critical to Agile. Increased transparency and the desire to eliminate surprises make tracking essential to effectively managing an Agile project. We explore several tracking mechanisms and philosophies in detail.
Extreme Programming (XP)
XP takes tracking so seriously that one of their roles is that of a tracker, as we first described in Chapter 4, “Describing the Different Roles.” The tracker talks to the developers daily and asks two questions—how many ideal days have they worked on a task, and how many ideal days do they have remaining (Beck and Fowler 2000, p. 79). You may recall from Chapter 6 that ideal days or ideal time is the amount of time a task would take under ideal circumstances, with no interruptions, phone calls, meetings, etc.
The authors of Planning Extreme Programming, Kent Beck and Martin Fowler, emphasize that the tracker should talk to each developer about the task status (2000, p. 79); this reinforces the importance of face-to-face communication so the tracker can ensure that he or she obtaining accurate and realistic responses from the developer. Scrum addresses this in a similar fashion, through the use of the daily stand-up meeting, described later in the chapter.
Burn Charts
Burn charts are a mechanism to be transparent about the progress of a release or iteration so the team can decide if they need to alter their approach to the work in order to honor their commitments. By being able to easily see their actual progress charted against the planned progress, they have actionable data to inform their decisions.
Burn-Up Charts
Burn-up charts are a way to depict progress toward a product’s release goal. Typically, time is on the X axis, either in sprints, months, or quarters, and the Y axis represents the release at completion. The Y axis can be either story points or feature descriptions.
In Figure 8.1, the black line is the cadence that we expect to see relative to the number of story points delivered in each sprint; the gray line represents actual story points delivered.

In Figure 8.2, we have a slightly different view. Here we see the black line as the number of story points that we need to achieve to meet our release goals. Our gray “actual” line tracks upward, and we meet the goal after sprint 10.
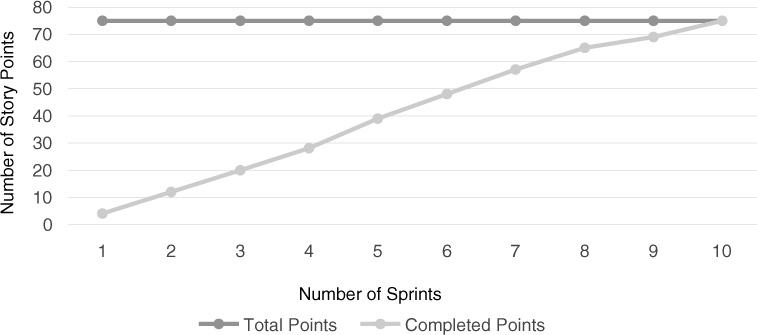
Figure 8.3 shows the feature milestones that we need to complete each quarter to realize the vision for this product. The actual progress is then tracked against these features, as completed.
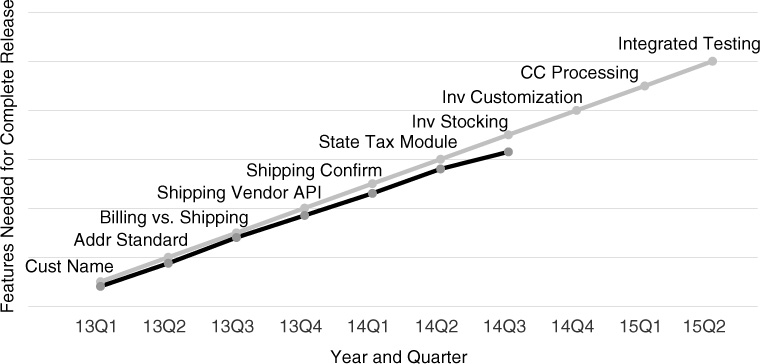
Although Figures 8.1 and 8.2 do reveal the progress that the team is making, the charts may not convey the necessary information to stakeholders. It is interesting to note the team’s velocity and how quickly they are delivering story points, but that does not necessarily mean that the product is producing the right deliverables. Figure 8.3 shows the actual features that are delivered to the marketplace. Executives often prefer this view because they can easily see the feature delivery progress (Cockburn 2004b).
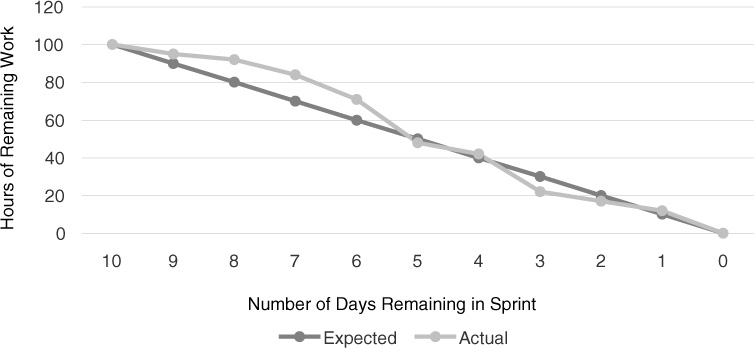
Burn-Down Charts
Burn-down charts serve a different purpose: These are the daily status checks for the team relative to where they expected to be at a particular point in time. This is a critical tracking element within a sprint or iteration to ensure that any necessary course correction is identified and addressed as early as possible.
As described in Chapter 6, a few critical activities take place during the Sprint planning meeting. First, the developers choose the tasks that they want to own. After they select the tasks, they estimate the hours that they believe each task will take them to complete. Before Sprint planning, most activities are at the user story level, and they are estimated in story points. Once Sprint planning is completed, stories are broken down into tasks, and tasks are estimated in hours. Now that the developer is known, and he or she has small increments of work, it is easier to estimate the actual amount of time a task will take. Therefore, the team can see the total number of hours allocated to the sprint and track their actual progress against the target.
The black “expected” line represents the ideal sprint progress if the same level of work was completed every day. You can tell from the chart in Figure 8.4 that our sprint got off of a rocky start because our gray “actual” line was above the “expected” line for several days. Whenever this happens, the team must determine if they are able to finish the expected amount of work within the sprint. In this case, the team recovered nicely, and with three days remaining in the sprint, they were actually ahead of schedule. They finished the last day with all of the work completed.
The next example in Figure 8.5 does not paint as pretty a picture.
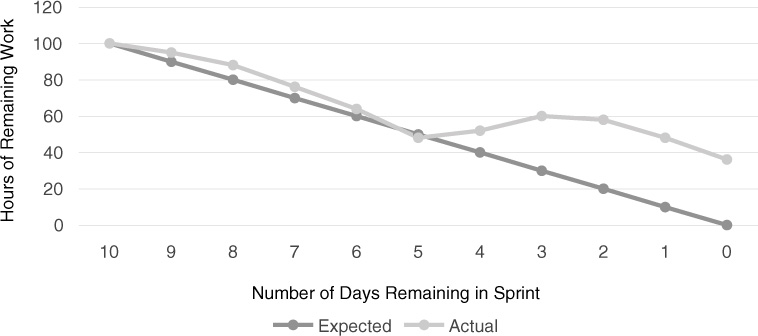
As you can see from this chart, something went horribly wrong on day 5. Perhaps several team members were out sick with the flu; or the team uncovered a significant problem with the database; or a production issue occurred and the entire development team was pulled off the sprint to work on the live issue; or a story ended up being significantly more difficult than originally thought. In any case, the burn-down clearly shows that the sprint is in jeopardy, and we can see this almost immediately. The team has several options to try to remedy the situation. For example, they can reassign tasks to the most competent developers to speed things up, or they can work long hours (with lots of caffeine) to make up the difference (noting that this is not a sustainable way to manage work). They can also negotiate with the product owner about the situation and the best resolution. The product owner should be involved in all discussions because he or she will need to determine which stories are removed from the sprint, if necessary. No one ever wants this to happen, but when it does, having the product owner determine the appropriate work to complete—based on priority and business value—is still far better than not knowing and just having the IT teams fail to deliver.
Although the example represented in Figure 8.5 is not ideal, it is still positive. Without Agile and this level of transparency, we would have situations of unknown risk, dates missed, and customers disappointed.
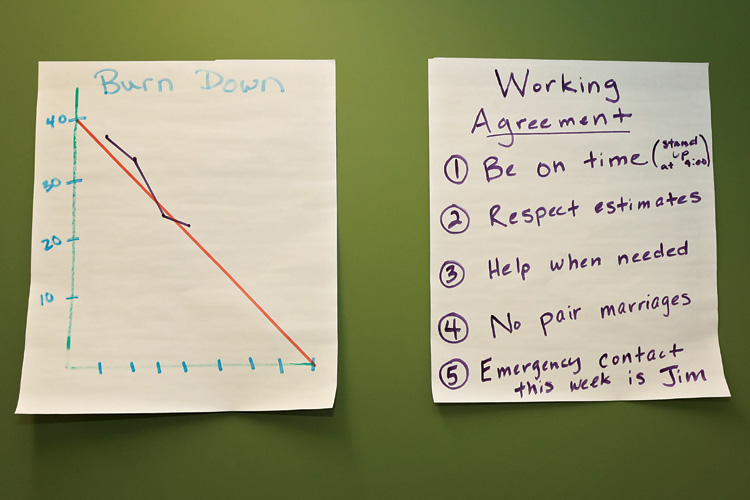
Information Radiators
Information radiators (see Figure 8.6) are anything posted in the team members’ physical space that they will walk by or see on a regular basis. The idea is that the information radiates into the team’s subconscious because they encounter the information regularly. Radiators work in much the same way as advertisements on billboards along the freeway: They encourage you to think about ideas because they are presented to you regularly. For some Agile teams, the information radiator might be some best practices posted on a white board, such as “We will not write new code until all defects are closed.” Other teams may post the daily status in a common area so the team members know what is going on with the project and maintain a sense of urgency. Some teams may even use information radiators to promote a positive culture and post birthdays or promotions for everyone to see. Regardless of how a team decides to use information radiators, they are a helpful tool to promote team communication.
Feature-Driven Development (FDD) Parking Lots
FDD incorporates an excellent way to track progress on larger projects where many activities are contributing to a cohesive whole. For our Cayman Design project, we want to create and sell weather-related calendars to customers; this is a large departure from the other features in our weather app because we have to consider inventory, shipping, and payment details. An example of an FDD parking lot might look like what is shown in Figure 8.7.
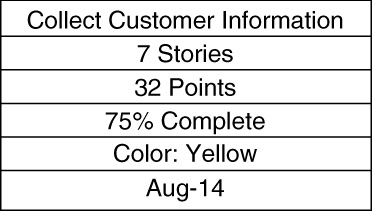
This tells us that the feature “Collect Customer Information” consists of seven stories totaling 32 points. At this moment, we are 75% complete, and the feature is needed by August 2014. The color on the story can indicate its health, this particular story being yellow, meaning it is in jeopardy. Although this is an interesting depiction of information, it is not necessarily more valuable than any of the other Agile tools we have discussed—that is, until you add many other components, and then the picture painted by the FDD parking lot is incredibly useful (see Figure 8.8).
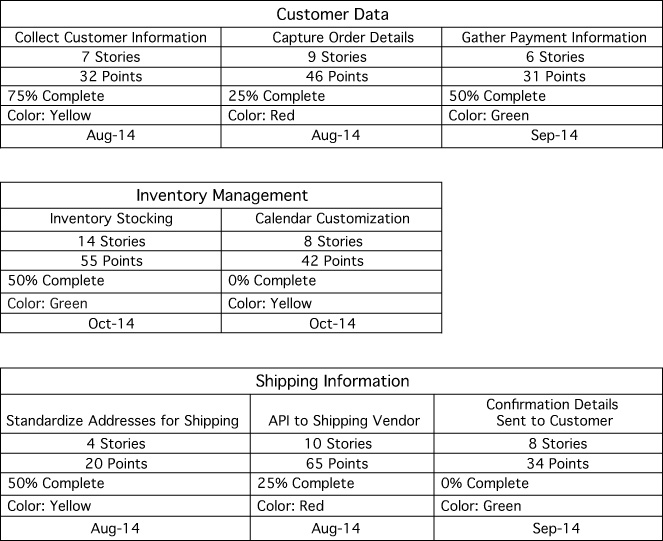
From this parking lot view, you can get an immediate sense for the project health, even though we are looking at a total of 66 stories and 325 points. You can add teams/owners to each parking lot and define a more detailed color scheme as needed for your particular project. FDD’s model-driven approach allows it to scale to support large, complex projects (De Luca 2012; Griffiths 2007; Highsmith 2012).
Other Progress Charts
Gantt (percent complete) and stoplight (red, yellow, or green status) charts have been the most common status-tracking tools in software development projects for many years. Although there is nothing about the Agile methodology that would prevent Gantt or stoplight charts from providing useful information, Agile teams have embraced tracking tools that help the teams focus on their daily status.
Tracking Quality
Agile endorses the idea of writing quality code throughout the development process through pair programming and test-driven development, which we discussed in depth in Chapter 7, “Testing, Quality, and Integration.” Despite these preventive measures, poor quality can still be introduced into the product. There are several approaches to tracking the quality of a product during an iteration.
Build Status
Once a developer has completed testing of his or her code, the first check for quality is to look for errors when the code becomes integrated in the product build on the server. If a previously error-free build is indicating that there are errors, then the development and test team have a very clear indication that there may be a problem with the new code. These defects are found quickly because Agile teams are doing regular builds. It is also easier to narrow down the defect location in the code because typically only small amounts of code are added with each build.
The team can track how many builds introduce errors over time, but this is not commonly measured. The Agile teams that utilize a siren or alarm with a build error often create an environment where defects are avoided at all costs and build errors become a rarer occurrence.
Defects
Defects are a normal part of the product development process. In Waterfall development, quality is sometimes measured as a ratio such as the number of defects introduced per 1,000 lines of new code or the number of defects detected compared to the number that the developers were able to close in a given week. These metrics can also be used while doing Agile development, and in fact some teams create a defect burn-down chart similar to the sprint burn-down chart as a visual representation of the defect closures. If the defect burn-down chart is not trending down, then the team knows that either defect closure is not being prioritized by the developers or the new code is continuing to have more and more problems. In either case, the team should focus immediately on defect closure.
Test Cases
An important part of the testers’ role is to write test cases that will uncover the defects in the code to ensure the highest-quality product is released to customers. These tests should cover both the functionality and the usability of the product.
In Waterfall projects, testers would review the design documents and requirements, write an overall test plan, write individual test cases for the requirements, and then execute the test cases when the developers had finished coding and document the results. If a defect was found during a test case in Waterfall, it would be documented and prioritized, and the tester would track it through resolution.
Agile development works differently because testing is considered more of a whole-team activity that happens throughout the iteration. Lisa Crispin and Janet Gregory’s book, Agile Testing: A Practical Guide for Testers and Agile Teams (2009), uses the Agile testing quadrants (see Figure 8.9) to describe how an Agile tester can think through the different types of tests that need to be performed during the iteration. We covered testing in detail in Chapter 7, but for the purposes of using test cases to assess the quality of the product, it is important to make sure that all aspects of the product (e.g., technical, usability, performance) are sufficiently covered. Savvy Scrum masters know that if very few defects are found during testing, that may mean that the code is of high quality, or it could mean that the product was not sufficiently tested. It is important to question the team if too many or too few defects are found during an iteration.
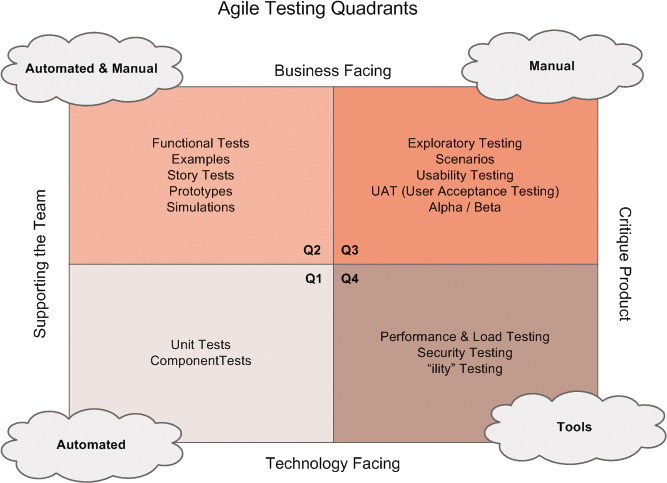
Source: Crispin, Lisa, and Gregory, Janet. 2009. Agile Testing: A Practical Guide for Testers and Agile Teams. Boston: Addison-Wesley, p. 98.
Figure 8.9 Crispin and Gregory’s (2009) Agile testing quadrants
Review 2
At this point, the reader should be able to answer Review Questions 6–10.
Meetings or Ceremonies
Because the teams are working hard during the sprint or iteration to design, code, and test the requirements, we need a mechanism to keep track of their progress and make sure everything is working well on the teams. Similar to how the XP tracker asks each developer how things are going, Scrum, Lean, and DSDM all recommend a daily stand-up meeting, sometimes called the daily Scrum.
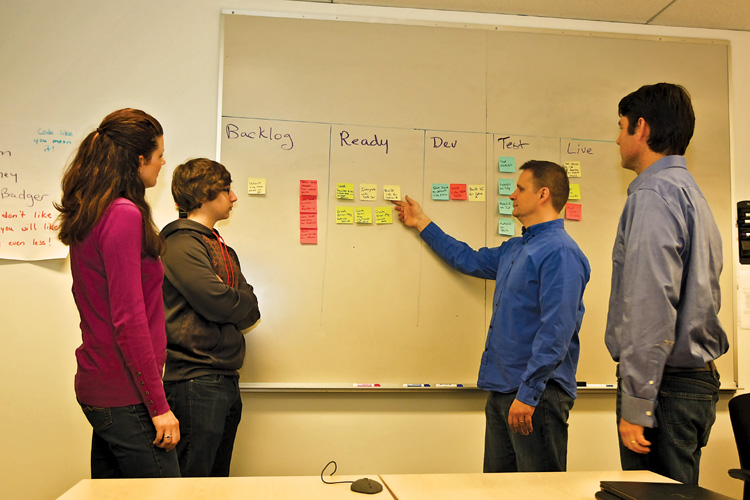
Daily Stand-Up Meeting
Development teams use the daily stand-up meeting (see Figure 8.10) to do a quick status check and prepare the team for the day. These meetings usually take less than 15 minutes and provide an opportunity to understand the team’s progress in the iteration. Each team member answers three key questions during the daily stand-up meeting:
• What did I do yesterday? This is an opportunity for a developer to share what tasks were closed yesterday or if something was more difficult than expected or will require more time.
• What am I planning to do today? This information helps the team know the developer’s area of focus for the day and also if he or she will be unavailable for some portion of time because of meetings or personal considerations. By understanding what a teammate is working on, the other team members can align their work, if necessary.
• Is there anything blocking my progress? This could be anything that is preventing advancement, from a technical issue to the lack of a test environment to a clarification question with the product owner. The key is to share challenges to keep things moving forward in the iteration. The output of this discussion serves as the action items for the Scrum master. As you will recall from Chapter 4, one of the Scrum master’s primary roles is to clear roadblocks or impediments.
Some people view the daily stand-up as a status meeting, but it is much more than that: A status meeting is simply informing others on your progress in a static and single-threaded way, but the daily stand-up meeting is an opportunity for team calibration. If one team member reports struggles with a task, then other team members can jump in and help. This help might be sitting together to solve the problem or offering to take ownership of other tasks to allow the teammate to continue working on the troublesome task. Within Agile, the team succeeds or fails together. To ensure that commitments are kept, the team needs to band together to deliver on all tasks. The daily stand-up meeting provides a forum for teammates to calibrate on the work remaining and support each other to success.
There are a few other important parameters for the daily stand-up meeting. First, the meeting is open to everyone, meaning that stakeholders and extended team members are welcome to attend, but only the “pigs,” as described in Chapter 4, may talk. The reason for this distinction relates to the goal of the meeting—it is about team calibration. Although a stakeholder may have an opinion to share, the daily stand-up meeting is probably not the right forum. Also, because the daily stand-up is designed as a short meeting, where the participants actually stand up to prevent the meeting from lasting longer than necessary, it is not the right place for problem solving. When a developer or tester is answering the three questions, it is often easy to start brainstorming and problem solving as part of the discussion. The Scrum master needs to control the meeting and push certain discussions “offline,” meaning that they should be discussed after the meeting.
When introducing the daily stand-up to new Agile teams, there can be hesitation about a daily meeting. People often believe they do not have time to meet every single day, and they initially view it as unnecessary overhead. However, if the daily stand-up meeting is run well, with a focus on information sharing and team calibration, it can accelerate a team toward meeting their goals. High-performing teams often find that other longer and more tedious meetings can be avoided by conducting an effective daily stand-up.
Sprint Review or Demo
A Sprint review, or Sprint demo, is a meeting hosted by the team that is open to a wide audience including extended team members, stakeholders, and potentially even external customers. The sprint review provides the opportunity to showcase the working software to inform and educate the organization on what has been completed and to gather feedback to ensure that the product is delivering on expectations.
The session is not intended to be a large, professional meeting with a lengthy presentation. In fact, most teams limit the “prep” time for the demo to two hours or less; we want the teams to spend their time writing great code, not producing pretty PowerPoint slides.
The person who leads the discussion varies by team and may even vary by Sprint review. Often the product owner will describe the user stories that were tackled during the sprint, and the Scrum master will demonstrate the working software. On other teams, the product owner runs the entire meeting, because having a nontechnical person work through the software demonstrates its usability. On still other teams, the developers do the demonstration because they feel a great sense of ownership for the value that they have created with the software. Within Extreme Programming (XP), many teams have the customer (product owner) lead the demonstration because the entire team wants to showcase their work, and the customer should demonstrate the progress that has been made on the features (Beck and Fowler 2000, p. 83).
If the feedback is particularly negative, the team will need to evaluate whether they should make the new feature publicly available. Positive feedback validates that the new feature is ready for deployment. In Chapter 4, we mentioned that one of the product owner’s responsibilities was to “accept or reject” the completed user stories; this should be done either before or at the Sprint review meeting. If the stakeholders offer opportunities for improvement, those can be documented as potential new requirements. The product owner is responsible for collecting all of the feedback and determining what items will be addressed in future sprints and their relative priority. Stakeholders should not assume that all feedback will be incorporated. The product owner should evaluate the business value of each suggestion and compare it against the items in the product backlog.
Retrospectives
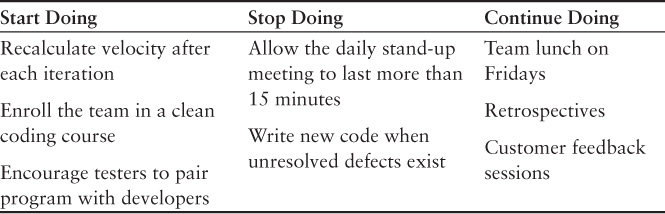
Retrospectives are an important part of Agile software development as a forum for open communication among team members and as a tool for continual improvement. The Agile Manifesto emphasizes team retrospectives in this principle: “At regular intervals, the team reflects on how to become more effective, then tunes and adjusts its behavior accordingly.” A retrospective is a team meeting at the end of an iteration where the team has the opportunity to inspect and adapt their teamwork (Derby and Larsen 2006, loc. 144). One method for facilitating the discussion is to pass out note cards and ask participants to jot down their observations into categories; the categories could be “stop doing,” “start doing,” and “continue,” as in Table 8.2 (Cohn, http://www.mountaingoatsoftware.com/agile/scrum/sprint-retrospective).
Retrospectives allow the teams to discuss the workflow and how that can be enhanced, but the bigger value comes in the sense of teamwork and trust that is emphasized during this meeting.
Gathering the team together to talk about how they are getting along can be awkward and uncomfortable, but it is the surest way to improve things. There are a number of ways to manage retrospectives to make the conversation more natural, while ensuring that the key concerns are addressed effectively. In their 2006 book Agile Retrospectives: Making Good Teams Great, Esther Derby and Diana Larsen present a number of ideas for teams to use to frame the conversation in a way that is nonconfrontational but allows the key issues to be addressed. Agile’s concept of team self-organization, collaboration, and continuous improvement makes the retrospective a critical meeting to have for the growth and development of the team.
One idea from the book is brilliant in its simplicity. The authors call it “Prioritizing with Dots,” and it helps to prioritize the items that the team wants to work on; here is a synopsis (Derby and Larsen, 2006, loc. 1319).
Have team members write down specific action items that they would like the team to address on a sticky note, note card, white board, etc. Post each suggestion with no judgment or priority. After every idea is on the board, give each participant three small stickers; these could be small sticky notes, colored dots, or even labels from the printer. Each person places the three stickers on any action item(s) he or she considers most important; all three stickers could be put on a single item, for example, or they could put one each on three different items. When the exercise is completed, the team knows that the action item with the most stickers is the top priority. Based on the sticker allocation, you can decide how many action items you want to address. There is nothing magical about the number three—each person could vote five times or eight; teams should use whatever number works best to achieve their goals.
Retrospectives are an important vehicle for the team to continuously grow together as an entity, which will make their work environment more productive and more enjoyable.
Measuring Success in Agile
How do you know if an Agile project is successful? This topic has sparked a great deal of debate, because some Waterfall metrics drive the wrong behavior and thus are inappropriate. Rally Software has developed a nice framework for measuring performance, in which they suggest four categories of measurement (Maccherone 2013):
• Do it fast
• Do it right
• Do it on time
• Keep doing it
These parameters align well with the core values and principles of Agile. In the “do it fast” category, we can measure the teams’ productivity and their responsiveness. In the “do it right” category, we are measuring quality and customer satisfaction. When we “do it on time,” we demonstrate a predictable cadence for when working software is delivered. Under “keep doing it,” we want to measure employee satisfaction, which is a critical component of sustainability as referenced in the Agile principles.
Truly, the absolute best measure of success for Agile teams is customer satisfaction. If your organization is delivering high-quality software that meets the needs of the users and is delivered quickly and predictably, then your customer satisfaction scores should be steadily (or dramatically) improving.
Review 3
At this point, the reader should be able to answer Review Questions 11–15.
Conclusion
Tracking and reporting are critical to Agile projects because of the focus on transparency and continuous improvement. Kanban is an Agile methodology that tracks items through the workflow and uses the Lean principles to remove bottlenecks or waste. Tracking mechanisms within all of the Agile methodologies will help the teams determine when and how to adjust to ensure delivery on their commitments. Burn charts, information radiators, FDD parking lots, and quality tracking measures all provide valuable information to the teams. The meeting structure also reinforces the tracking and reporting measures, with the daily stand-up providing real-time feedback on progress and allowing the team to calibrate on the remaining work. The Sprint demo or review is a forum for stakeholders to see the working software and provide feedback. Finally, the Sprint retrospective helps the team to inspect and adapt their relationships and team effectiveness. It is important to measure the overall performance of an Agile project, and customer satisfaction is a meaningful way to ensure that the organization is delivering business value to the marketplace.
Summary
• Kanban is an Agile methodology that is better suited for work that is unpredictable or difficult to plan, such as help desk tickets and custom software requests.
• Kanban focuses on three goals—visualize the workflow, limit the work in progress (WIP), and measure the lead time.
• Limiting the work in progress, referred to as setting WIP limits, helps teams to identify and correct bottlenecks in the workflow.
• There are three types of waste, according to Lean principles. Muda is waste created by steps that add no value. Mura is waste created in the unevenness of the process. Muri is the waste created by overburdening the people or systems in the process.
• Burn charts provide the team with real-time status on progress and deliverables.
• Burn-up charts are designed to map incremental delivery against the release targets. Burn-down charts are used within a sprint to ensure that tasks are being completed in a timely fashion that will lead to a successful iteration.
• Information radiators are any data, metrics, or values that are helpful to the team, displayed visibly in the work area so the information “radiates” throughout the space.
• Feature-driven development (FDD) uses parking lots to provide visibility to large, complex projects so stakeholders and team members can easily see how the project is progressing.
• Tracking quality is important in Agile, and teams need to track the build status to ensure that no new defects were introduced. Bug or defect resolution is important to track to ensure quality is purposefully measured and reported.
• The daily stand-up meeting allows the team members to discuss what they completed yesterday, what they are working on today, and what, if anything, is standing in their way.
• The daily stand-up meeting is designed to be only 15 minutes each day, and only the team members (the pigs) are allowed to talk.
• The daily stand-up meeting is an opportunity for the team to calibrate on their work to ensure that all deliverables are met by the end of the sprint.
• The Sprint review or demo is the opportunity to showcase working software to stakeholders to solicit their feedback. Data gathered in the demo is considered by the product owner for possible adjustments to priorities and user stories in the backlog.
• Sprint retrospectives are an opportunity for the team to get together to discuss the team dynamics and effectiveness.
• Measuring success in Agile projects can be challenging, because many of the old Waterfall metrics no longer apply or would actually drive the wrong behavior.
• Although there are many ways to measure success through productivity, speed to market, responsiveness, and predictability, the number one measure of success is customer satisfaction. If we are producing working, high-quality software quickly in response to market needs, customer satisfaction should reflect our success.
Review 4
At this point, the reader should be able to answer Review Questions 16–20.
Interview with Kent McDonald

Kent J. McDonald is an Agile coach who has helped many organizations understand and solve the problems they face. He is actively involved in the both the Agile software development and Business Analysis communities, as he has seen where companies succeed and fail in their Agile implementations. By sharing those stories at BeyondRequirements.com, TechWell.com, and ProjectConnections.com and through his speaking and coaching engagements, he is actively helping businesses move forward. Kent’s influence is global, as he recently served as the conference chair for the highly acclaimed Agile 2013 conference for the Agile Alliance.
Kristin and Sondra: In your experience, which status-tracking method is best for teams who are new to Agile?
Kent: They go by a variety of names—information radiators, big visible charts, story board. My friend Chris Matts calls them visualization boards. Basically, make the work visible by taking large white boards—it’s helpful to have them on wheels—that are split into columns; the location of a card representing a story indicates that story’s status. Teams that I have worked with will often have two boards—a discovery board that indicates the progress of getting stories ready for an iteration, and a delivery board which reflects the progress of stories in an iteration.
Kristin and Sondra: How should teams calculate their initial velocity estimate?
Kent: There are a couple of methods that I know of. One is based on commitment-based planning. The product owner (PO) and team get together along with a stack of sized stories. The product owner picks the first story, reads it, team discusses it, and then decides whether they can commit to delivering it in that iteration. Product owner then picks the next story, reads it, team discusses, then PO asks team, “Can you commit to this story along with the one(s) you already committed to?” This process continues until the team says they are full and cannot bring on any additional stories. The team can then add up the story points for those stories and use that as their initial velocity, until they have some iterations of actual experience.
Kristin and Sondra: Is there a point where a team works at a consistent velocity?
Kent: That is desirable, and can usually happen if the composition of the team stays consistent. If you are constantly changing the members of the team, the velocity will never stabilize and velocity, which is intended to be a guide for planning purposes, is basically useless. That is one argument for keeping the same team together and bringing work to the team.
Kristin and Sondra: How should a team determine their work in progress (WIP) limit?
Kent: Most teams I’ve worked with recently work in an iterative fashion, so the WIP limit ends up being the number of stories they bring into an iteration. If I were looking to create a WIP limit for given stages in the team’s process (say Dev in Progress), I would base the WIP limit on the number of people who would be working on stories in that column. Say you have four people on your team and you have decided to pair on everything; you may set your WIP limit for Dev in Progress at 2.
Kristin and Sondra: How do most of the Agile teams you work with allocate time for defect resolution?
Kent: This partly depends on what your definition of “defect” is. First off, I don’t consider problems that are identified with stories under development in the current iteration as defects; fixing these things is just part of getting to “done.” Assuming that you are doing all your testing in the same iteration in which the story is developed (which is what you want to have happen), then the only defects are those that escape into production. I usually treat defects as another story and add them to the backlog for consideration with other stories. If the defect is dramatically impacting the operation of the system, those defects may get pushed up to the top of the backlog. If the team is also dealing with production support and has items come up that have to be addressed quickly (for example, cannot be included in the backlog), then the time the team spends addressing those production issues usually gets factored into the velocity. The team’s actual velocity may be a few points lower than optimal because the team had to spend some time fixing production issues. If the team sees this happening quite a bit, the important question is not how to allocate time to resolve defects, it’s looking at the team’s process to figure out where defects are typically introduced and correct that issue.
References and Further Reading
Anderson, David J. (2003). Agile management for software engineering: Applying the theory of constraints for business results. Upper Saddle River, NJ: Prentice Hall.
Anderson, David J. (2010). Kanban: Successful evolutionary change for your technology business. Sequim, WA: Blue Hole Press.
Beck, Kent, and Fowler, Martin. (2000). Planning Extreme Programming. Boston: Addison-Wesley.
Cockburn, Alistair. (2004a). Crystal clear: A human-powered methodology for small teams. Boston: Addison-Wesley.
Cockburn, Alistair. (2004b). Earned value and burn charts. Blog entry, June 22. http://alistair.cockburn.us/Earned-value+and+burn+charts.
Cohn, Mike. Sprint retrospectives. http://www.mountaingoatsoftware.com/agile/scrum/sprint-retrospective.
Cohn, M. (2010). Succeeding with Agile: Software development using Scrum. Boston: Addison-Wesley.
Crispin, Lisa, and Gregory, Janet. (2009). Agile testing: A practical guide for testers and Agile teams. Boston: Addison-Wesley.
De Luca, Jeff. (2012). FDD implementation. http://www.nebulon.com/articles/fdd/fddimplementations.html.
Derby, Esther, and Larsen, Diana. (2006). Agile retrospectives: Making good teams great. Frisco, TX: Pragmatic Bookshelf. Kindle edition.
Griffiths, Mike. (2007). Summarizing progress with parking lot diagrams. http://leadinganswers.typepad.com/leading_answers/files/summarizing_progress_with_parking_lot_diagrams.pdf.
Griffiths, Mike. (2012). PMI-ACP exam prep, premier edition: A course in a book for passing the PMI Agile Certified Practitioner (PMI-ACP) exam. Minnetonka, MN: RMC Publications.
Highsmith, Jim. (2002). Agile software development ecosystems. Boston: Addison-Wesley.
Highsmith, Jim. (2012). Managing larger projects with feature-driven development. http://www.nebulon.com/pr/cutterlargefdd.html.
Kniberg, Henrik. (2012). Lean from the trenches: Managing large-scale projects with Kanban. Dallas, TX: Pragmatic Bookshelf.
Kniberg, Henrik, and Skarin, Mattias. (2010). Kanban and Scrum—Making the most of both. Raleigh, NC: Lulu.com.
Maccherone, Larry. (2013). The seven deadly sins of Agile measurement: Sins #2 and #3. Blog entry, July 31. http://www.rallydev.com/community/agile/seven-deadly-sins-agile-measurement-sins-2-and-3.
Palmer, Stephen, and Felsing, Mac. (2002). A practical guide to feature-driven development. Upper Saddle River, NJ: Prentice Hall.
Poppendieck, Mary, and Poppendieck, Tom. (2003). Lean software development: An Agile toolkit. Boston: Addison-Wesley.
Sutherland, Jeff, and Schwaber, Ken. (2013). The Scrum guide. https://www.scrum.org/Portals/0/Documents/Scrum%20Guides/2013/Scrum-Guide.pdf#zoom=100.
Tera Prudent Solutions Pty Ltd. (2012). Waste reduction by MUDA, MURA and MURI. http://www.tera-tps.com.au/Pdf/MUDA.pdf.
Review Questions
Review 1
1. How is Kanban different from the other Agile methodologies, specifically Scrum?
2. What do the columns on a typical Kanban board represent?
3. Why would a team implement a work in progress (WIP) limit?
4. What are the three forms of waste from the Lean principles?
5. What types of work is Kanban well suited for?
Review 2
6. What are “information radiators,” and how do they help Agile teams?
7. What is the difference between a burn-up chart and a burn-down chart?
8. How do you know from a burn-down chart if you are behind schedule?
9. What is an “FDD parking lot”?
10. How can a team track their defect resolution?
Review 3
11. What three key questions are answered by team members during a daily stand-up meeting?
12. Who typically gets assigned action items during a daily stand-up meeting?
13. What does the daily stand-up meeting provide to the team beyond simply giving status?
14. What is the purpose of a Sprint demo or review?
15. Why is it important for a team to hold a retrospective session?
Review 4
16. What is the best indicator of success in Agile?
17. Who should lead the Sprint demo or review?
18. If the daily stand-up meeting allows you to assess the effectiveness of the sprint and the Sprint demo allows you to assess the effectiveness of the product, what are you assessing in the Sprint retrospective?
19. Who writes and executes the test cases?
20. How is stakeholder feedback collected in the Sprint review, and what is done with that feedback?