Hour 7. Debugging Tools
Programs are easy to write. Correct programs are a different story. Locating program bugs can be difficult. When you are working with tools that compile or interpret your programs, debugging tools will be built in to the compilation or interpretation process, making your life much easier. Although the compiler or interpreter locates syntax errors for you, logic errors often take extra time to locate, and you must be the one to locate such problems before your users locate the problems. For example, when a payroll amount comes out incorrectly due to a bug, you will need to locate the problem as soon as possible.
Although your debugging skills will improve as your programming skills improve, you can help reduce bugs that appear and make debugging simpler by learning to write programs in a way that will make them easier to maintain and update. When you write clear and concise code, you’ll debug your programs faster. Many sophisticated debugging tools exist in today’s programming languages. This hour shows you how to access debugging tools available to JavaScript developers so that you can try them yourself. Although in comparison to some of the more comprehensive development suites JavaScript debugging is rather limited, you do get good exposure to the capabilities of debuggers by working through the process. The highlights of this hour include
![]() Looking in the past to the first computer bug
Looking in the past to the first computer bug
![]() Learning the difference between logic and syntax errors
Learning the difference between logic and syntax errors
![]() Seeing the importance of writing clear and concise code
Seeing the importance of writing clear and concise code
![]() Using the JavaScript console to help locate errors
Using the JavaScript console to help locate errors
![]() Stepping through a program one line at a time
Stepping through a program one line at a time
The First Bug
The term bug has an interesting origin. The late U.S. Navy Admiral Grace Hopper was one of the early pioneers of computer hardware and software. She helped to design and write the first COBOL compiler for the military. COBOL (Common Business-Oriented Language) was a language later used by most business programmers of the 1960s and 1970s. Admiral Hopper was working on a military computer system in the early 1950s and, while printing a report, the printer stopped working. Admiral Hopper and her coworkers set out to find the problem.
After spending a lot of time without finding any problems in the program or in the data, Admiral Hopper looked inside the printer and noticed that a moth had lodged itself in a printer’s relay switch, keeping the printer from operating properly. As soon as the bug (get it?) was removed, the printer worked perfectly. The moth did not fare as well, but it did go down in computer history as the first computer bug.
Note
Michael Crichton may have used Admiral Hopper’s true story as the basis for his nail-biting suspense novel Andromeda Strain, a story that had a small printer problem that almost caused disaster.
Accuracy Is Everything
You are now well aware that the computer is a machine that cannot deal well with ambiguity. A programmer’s plague is the collection of errors that show up in code. Perhaps as you’ve entered JavaScript programs in the earlier hours, you’ve run across problems that occurred as you mistyped a character or two. Bugs can creep into code. Programmers must ensure that they do not write programs that contain errors, although this is not always as easy as it might seem.
When breaking the programming problem into detailed instructions, programmers often leave things out or code the wrong thing. When the program runs, errors appear because the programmer didn’t plan for a particular event, used an incorrect calculation, or typed a line of code incorrectly.
Tip
Some of the most common bugs you will encounter, and often the most difficult to spot, involve mistyping or omitting punctuation marks, including forgetting that second quotation mark, brace, or parenthesis, or not ending a JavaScript statement with a semicolon. If your program doesn’t run the way you intended (or run at all), double-checking all your special characters like these is often a good place to start.
The debugging process is what a programmer goes through to exterminate the bugs from a program. As a programmer writes a program, he or she often runs the program in its unfinished state (as much as it can be run) to catch as many bugs as possible during the program’s development. Incrementally running the program as more and more of the code is completed helps eliminate bugs from the finished program. Still, the majority of the bugs can be found only after the program is completely written.
Beginning programmers often fail to realize how easy it is for bugs to creep into code. Expect them and you will not be surprised. Many early programming students have taken a program into the instructor saying, “The computer doesn’t work right,” when in reality, the program has a bug or two. When you begin to write programs, expect to have problems you will have to correct. Nobody writes a perfect program every time.
Depending on the length of a program, the time it takes the programmer (or programmers) to correct problems is often almost as long as the time taken to write the program originally. Some errors are very difficult to find.
There are two categories of computer bugs: syntax errors and logic errors. To learn the difference, take a few moments to find the two errors in the following statement:
There are two errrors in this sentence.
Tip
Found only one problem? Need a clue? Not yet; look again for two mistakes before going further.
The first error is obvious. The word errrors is misspelled; it should be spelled errors. The second problem is much more difficult to find. The second problem with the statement is that the entire premise of the statement is incorrect. There is only one error in the statement and that error is the misspelled word errrors. Therefore, the logic of the statement itself is in error.
This problem demonstrates the difference between a syntax error and a logic error. The syntax error is much easier to find. As you learned in Hour 1, “Hands-On Programming,” syntax errors often appear as misspelled programming language commands and grammatical problems with the way you use the programming language. Logic errors occur when your program is syntactically correct, but you told it to do something that is not what should really be done.
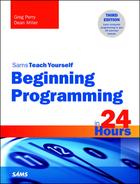
Compilers and interpreters locate your program’s syntax errors when you try to compile your program. This is another reason syntax errors are easier to spot: Your computer tells you where they are. When a computer runs into a syntax error, it halts and refuses to analyze the program further until you correct the syntax error. Listing 7.1 shows a JavaScript program that does not work because of a syntax error. It’s one of the first programs you wrote, one to compute the area of a circle. However, a character has been removed from the original code to create the error. Figure 7.1 shows the blank page of code because of the error. At the bottom of the screen, the JavaScript console has been opened in Google’s Chrome web browser (use the menu and navigate to Tools -> JavaScript Console, or type Control-Shift-J.) The console will be covered in more detail later in the lesson, but you can see it has identified a syntax error in the code and gives you the line number (13) of the listing where the problem exists. It doesn’t clearly tell you the problem, but it’s a start.
LISTING 7.1 Even a simple program can have an error in it.
<!DOCTYPE html>
<html>
<head>
<title>Calculating the Area of a Circle</title>
</head>
<body>
<script type="text/javascript">
// Filename: AreaCircle1.html Program that calculates and
// prints the area of a circle and half circle
document.write("The area of a circle with a radius of 3 is ");
document.write(3.1416 * 3 * 3);
document.write("<br>The area of one-half that circle is );
document.write((3.1416 * 3 * 3) / 2);
</script>
</body>
</html>
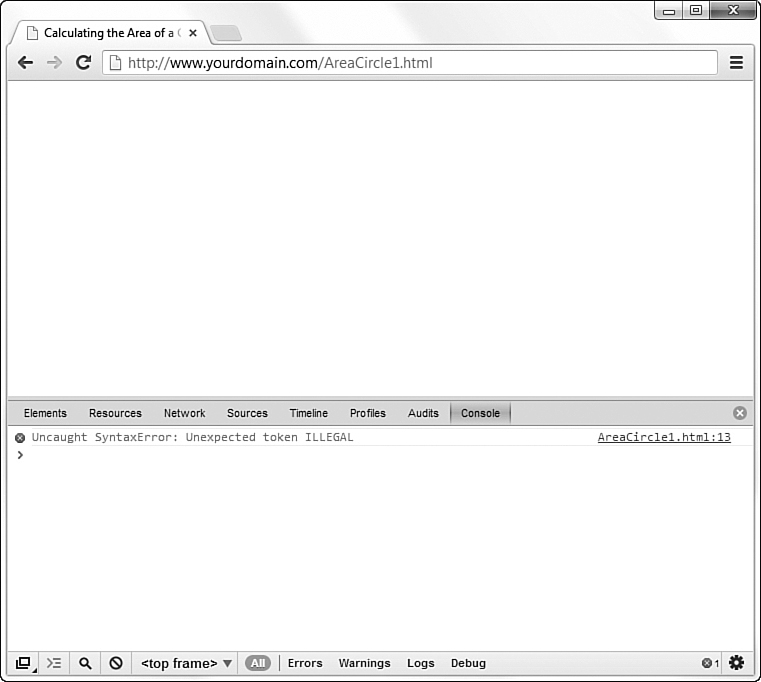
FIGURE 7.1 The JavaScript console can be helpful in identifying errors in your code. The console in Chrome is shown here.
Other browsers contain different views of the JavaScript console, as seen in Figure 7.2, which is the console in Firefox.
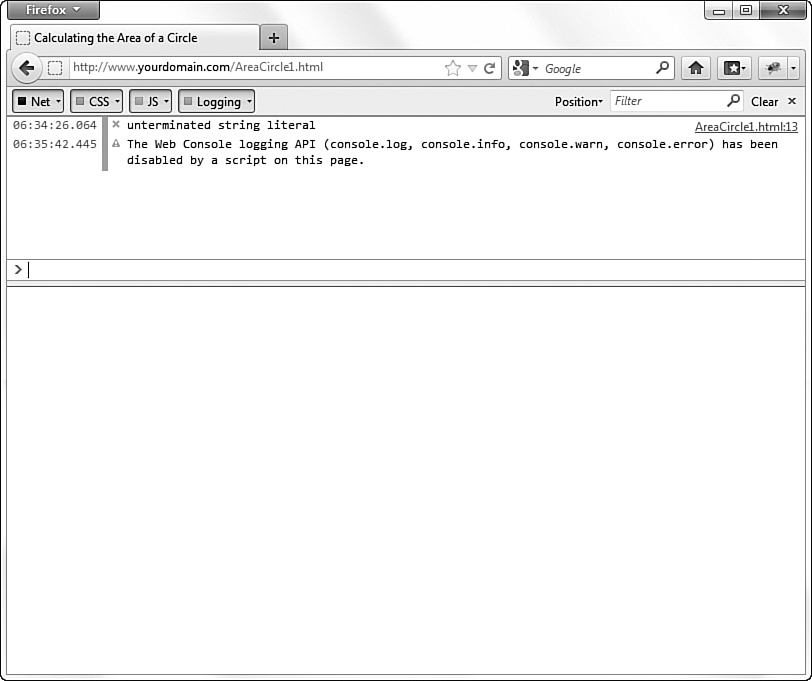
FIGURE 7.2 The JavaScript console can be helpful in identifying errors in your code. The console in Firefox is shown here.
Additionally, browsers such as Chrome and Firefox allow you to install add-on programs, including additional feature-rich debuggers such as Firebug, shown in Figure 7.3. You can learn more about Firebug at http://getfirebug.com/.
FIGURE 7.3 The JavaScript console can be helpful in identifying errors in your code. The Firefox add-on called Firebug is shown here.
Suppose you’re writing a program to print invoices for your company’s accounts receivable department. Because of an error, the computer prints all the invoices with a balance due of −$1,000. In other words, according to the invoice, every customer has a $1,000 credit. Your computer did its job, acting out your program’s instructions. The program obviously contained no syntax errors because it ran without stopping. The logic errors, however, kept it from working properly.
Extensive testing is critical. The programmer wants to get all the errors out so the program will work correctly when the user finally uses it. The larger the program, the more difficult this is. Exterminating program bugs is just part of the daily job programmers tackle.
There is a third kind of error called a runtime error. Runtime errors are actually almost always caused by logic mistakes because the programmer failed to predict and therefore handle a potential problem. Runtime errors can occur if a program attempts to write to a disk without first checking to ensure that the disk is mounted. A runtime error can occur, for instance, if the program divides by zero (division by zero is undefined mathematically). The more you program, the more you will learn to head off potential runtime errors that can occur.
Write Clear Programs
As you write programs, keep in mind the future maintenance that will be required. Sometimes, a program might be in use for a long time before a bug appears because a certain combination of factors occurred. Perhaps an unexpected data value appears, such as a negative value in an age field that should never be negative. Perhaps an operating system update causes a program to stop working.
Not only might bugs appear down the road, but programs often also need to be modified as the needs of the program change. When you write your programs, write clear and concise code. Every time you write a new line of code, consider whether a comment is needed to explain that line or to introduce a new section. Add extra whitespace characters to your program.
Consider the C program shown in Listing 7.2. The program is a valid, legal, C program that works on many C compilers that you might use. Yet, the program is horribly written. The program works and contains no syntax or logic errors, but the program is virtually impossible to maintain easily. The program is rather short but even advanced C programmers will have to hesitate to decipher the code if they are to make changes to it.
LISTING 7.2 This C program contains no errors but is extremely difficult to maintain.
/* Filename: CFIRST.C Initial C program that
demonstrates the C comments and shows a few variables
and their declarations */
#include <stdio.h>
main() {int i,j;/* These 3 lines declare 4 variables */
char c;float x;i=4;/* i and j are assigned integer values */
j=i+7;c='A';/* All character constants are enclosed in
single quotes */x=9.087;/* x requires a floating-point
value since it was declared as a floating-point variable */x=
x*4.5;/*Change what was in x with a formula */
/* Sends the values of the variables to the screen */printf("%d %d %c %f",i,
j,c,x);return 0;/* End programs and functions this way*/}
Whether you know C or not, you must admit that Listing 7.2 is bunched together and difficult to read. By adding whitespace and extra lines, the program automatically becomes easier to understand even for non–C programmers as Listing 7.3 demonstrates.
Tip
You’ll find that much of C programming is clear to you thanks to your JavaScript experiences. If you want to learn C, you will still have to learn about some of the way C works, including some of the lines in Listings 7.2 and 7.3, but you’ll certainly have a head start.
LISTING 7.3 This C program with better spacing is far clearer to understand.
/* Filename: CFIRST.C
Initial C program that demonstrates the C comments
and shows a few variables and their declarations */
#include <stdio.h>
main()
{
int i, j; /* These 3 lines declare 4 variables */
char c;
float x;
i = 4; /* i and j are assigned integer values */
j = i + 7;
c = 'A'; /* All character constants are
enclosed in single quotes */
x = 9.087; /* x requires a floating-point value since it
was declared as a floating-point variable */
x = x * 4.5; /* Change what was in x with a formula */
/* Sends the values of the variables to the screen */
printf("%d %d %c %f", i, j, c, x);
return 0; /* End programs and functions with return */
}
Practice Debugging with JavaScript
Popular web browsers such as Chrome and Firefox contain debugging tools that can help you locate and correct problems in your JavaScript. As you saw earlier in the lesson, you can invoke the JavaScript console in your web browser while any page has been loaded. The console will inform you of syntax errors the moment you run a program that contains at least one syntax error. To see this in action, follow these steps:
2. Type the following code exactly as written here:
<!DOCTYPE html>
<html>
<head>
<title>Bug Hunt!</title>
</head>
<body>
<script type="text/javascript">
document.write("This program contains some buggs.");
Document.write("This line may have a problem.");
</script>
</body>
</html>
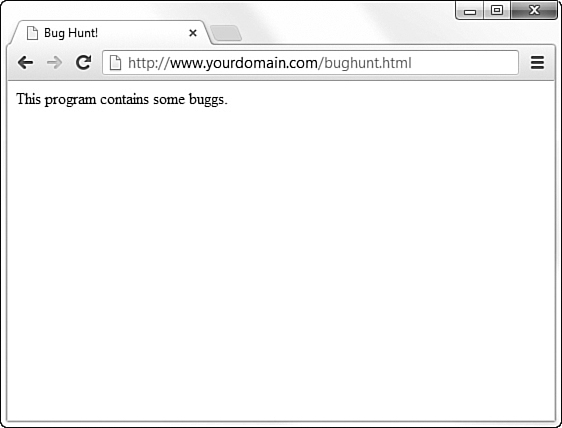
3. Save the file as bughunt.html and then open it in your browser. You will see only the first line of code, as shown in Figure 7.4.
4. Now, invoke the JavaScript console by going to the menu and selecting Tools -> JavaScript Console or by typing Control+Shift+J. You should see the console with an error displayed, as shown in Figure 7.5.
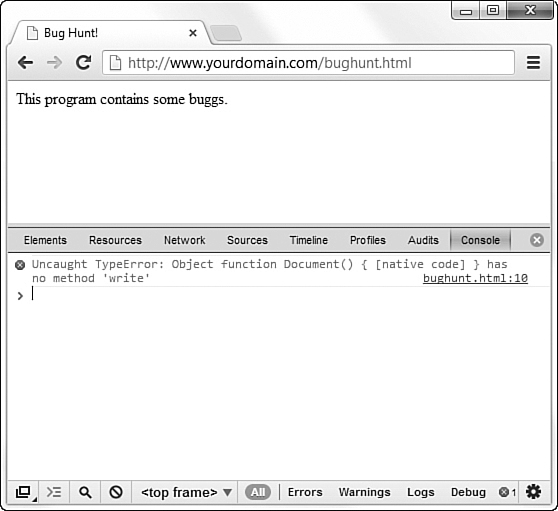
5. The console shows the error is:
Uncaught TypeError: Object function Document() { [native code] } has
no method 'write'.
This line of code may be hard to understand, but even if you find it confusing, it can cause you to reexamine the line where things have gone wrong, and perhaps get you to realize the incorrect capitalization of Document.
Note that JavaScript has no problem with the first line, even though the line has a misspelling (the word buggs contains an extra letter g) because the problem is not part of an instruction to JavaScript. The problem is an error of misspelling and appears inside the quoted string. JavaScript prints exactly what is in the string because the string is a properly-formed string, just misspelled.
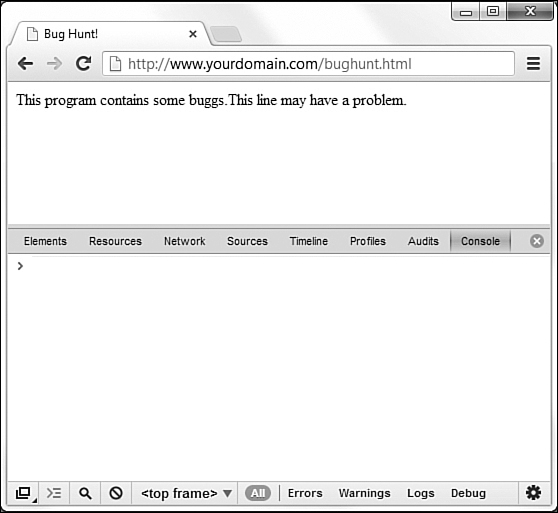
If you fix your error and reload the page, you will see the bug has been cleared and nothing new appears in the console log, as in Figure 7.6.
Let’s go through a runtime error. Create a new text file and type the following code exactly as written here:
<!DOCTYPE html>
<html>
<head>
<title>Bug Hunt 2!</title>
</head>
<body>
<script type="text/javascript">
var i = 0;
var j = 9;
document.write("i divided by j is "+i/j);
document.write("<br>j divided by i is "+j/i);
</script>
</body>
</html>
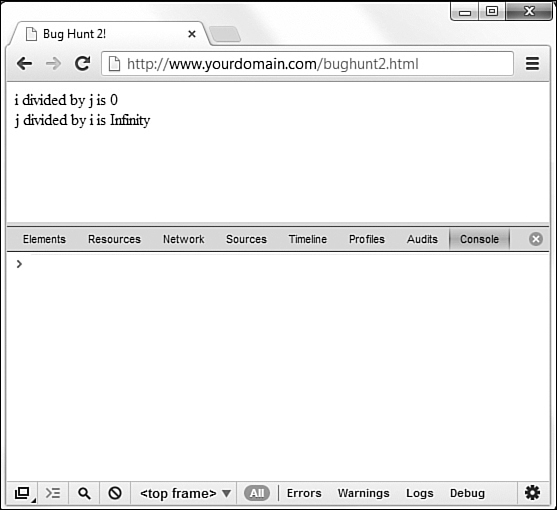
Save the code as bughunt2.html and upload it to your website or load it in your browser. In the the first line, dividing 0 by 9 gives you the correct answer, 0. But when you try and flip the numbers and divide 9 by 0, you get Infinity.
As you can see in Figure 7.7, nothing appears in the console because this type of bug (a runtime error) doesn’t stop the execution of the program. Instead, it just provides you with an unexpected result. In cases like this, the console can’t help you—you have to use your eyes and your brain to realize that isn’t the result you expected or want.
JavaScript’s Console Log
As you’ve seen, every time a JavaScript error occurs, it is printed in the console. For as long as you have that console open, you can see a running log of the errors; if you reload the page with the same error, it will print the error again. However, you can also specifically print your own error messages to the console log.
Using the Console API (application programming interface), you can insert your own logging statements so as to help you better understand the errors that are occurring. In Listing 7.5, you can see some of these API methods in use, displayed in Figure 7.8.
LISTING 7.5 Logging into the Console in JavaScript
<!DOCTYPE html>
<html>
<head>
<title>Console Logging</title>
</head>
<body>
<script type="text/javascript">
console.log("Hello World!");
console.error("Server is not responding",500);
console.warn("Danger, Will Robinson!");
document.write("Look down there in the console. Nothing to see here.");
</script>
</body>
</html>
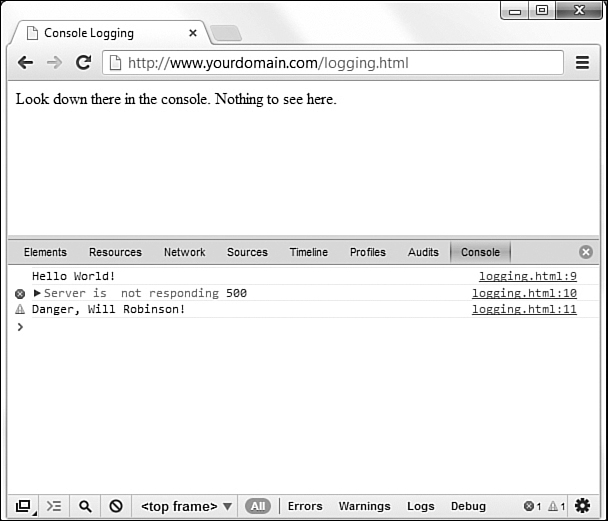
The general console.log() statement places the text you type within the parentheses directly into the log. Using console.error() allows you to specify the string and server error type to display; this appears with an additional warning icon in the console log itself. Finally, in this example, you see the use of console.warn() to display text with a yellow warning icon (as opposed to the red icon, or no icon at all).
Although this example is simple—it’s not even logging within the context of a real program, after all—you can begin to see the usefulness of being able to set specific logging statements to display at different points in your program.
Additional Debugging Techniques
As mentioned earlier in this lesson, when you use programming environments more powerful than the JavaScript console, such as sophisticated development suites or even just integrated development environments (you’ll learn more about these in Hour 24, “The Future of Programming”), most of the debugging aids are similar to those that you now know. These additional tools allow you to change source code during debugging to see how your changes immediately affect the output. Also, you can change variables as the program runs.
The following list is a partial sample of some of the features you’ll find in most of today’s debugging systems:
![]() Analyzing variables at runtime and viewing those variables in a window separate from the output.
Analyzing variables at runtime and viewing those variables in a window separate from the output.
![]() Changing contents of variables during the execution of the program so that the rest of the program acts as though the code had assigned those values.
Changing contents of variables during the execution of the program so that the rest of the program acts as though the code had assigned those values.
![]() You can set breakpoints throughout the program so that the program runs at normal speed until your preset breakpoint is reached. At that time, you can single-step through the rest of the code.
You can set breakpoints throughout the program so that the program runs at normal speed until your preset breakpoint is reached. At that time, you can single-step through the rest of the code.
![]() You can set watch variables that halt the program’s execution when the watch variables receive a specific value or range of values.
You can set watch variables that halt the program’s execution when the watch variables receive a specific value or range of values.
![]() You can skip statements that you don’t want to execute during debugging.
You can skip statements that you don’t want to execute during debugging.
In addition to the usual fare of debugging features, many tools allow you to retrace your steps through a program. When you need to see exactly which parts of a program have executed up to a breakpoint, you can look at the call stack. The call stack appears in a dialog box and shows all procedures that have executed in the program to that point. If you double-click a procedure name, the code window opens to that procedure, and all variable values are still intact so that you can see what values have been computed.
Be sure to explore the development tools available to you for your programming language and development environment of choice—they are numerous!
Summary
This hour showed how you can use debugging tools to locate problems in your programs. You used the JavaScript console to learn the skills related to debugging, but those same skills will transfer rapidly to other languages and tools. Learning how to debug pays dividends when you need to track bugs. Although the debugging tools cannot locate specific logic bugs on their own, they make locating logic bugs easier for you to do.
Q&A
Q. How can single-stepping help me debug a program when it takes so long to step through a large application?
A. By executing a program one line at a time, you can analyze variable and control values at your pace. Remember that you don’t have to single-step through every statement, but only the statements that you want to analyze. After you view values, you then can run the rest of the program or set a breakpoint later in the code and run the program at normal speed to that set breakpoint. Single-stepping not only helps you ensure that data values are correct, but you can also monitor the execution of a program to make sure that the program’s statements execute in the order that you intended.
Q. Can I debug a compiled program?
A. Unfortunately, the debugging tools only work with source code. The source code is needed to display variable names and locate program statements. As a good programmer, you will keep a copy of all source code you compile into user’s programs so you can locate and fix bugs that you or the user find later.
Workshop
The quiz questions are provided for your further understanding.
Quiz
1. True or false: The first bug in a computer program was literally a bug.
2. What is one of the most common causes of a bug?
3. What are the two main categories of bugs?
4. What are the differences between the two?
5. How do you open the JavaScript console in Chrome?
6. Name three methods that allow you to write to the console.
7. What does single-stepping mean?
8. What are watch variables?
9. If your program compiles without errors and executes without stopping at a runtime error, are you assured that the program is bug-free?
10. Do all web browsers have a JavaScript console?
Answers
1. True (a moth, to be precise).
2. Mistyping a bit of punctuation in your code, such as a semicolon.
3. The two types are syntax errors and logic errors.
4. A logic error is a mistake in program logic, whereas a syntax error is a mistake in program grammar or spelling.
5. Menu -> Tools -> JavaScript Console, or type Control+Shift+J
6. console.log(), console.error(), console.warn()
7. To single-step means to walk through the program’s execution one statement at a time, analyzing the results of each statement.
8. Watch variables are variables you set up to monitor during a program’s debugging session.
9. Just because a program compiles and runs does not mean that you have fully debugged the program. Sometimes, an error appears long after the program is in use due to a special set of data values that are entered.
10. Yes, but it may differ in appearance from browser to browser.