
Appendix A. Perl Built-ins, Pragmas, Modules, and the Debugger
A.1 Perl Functions
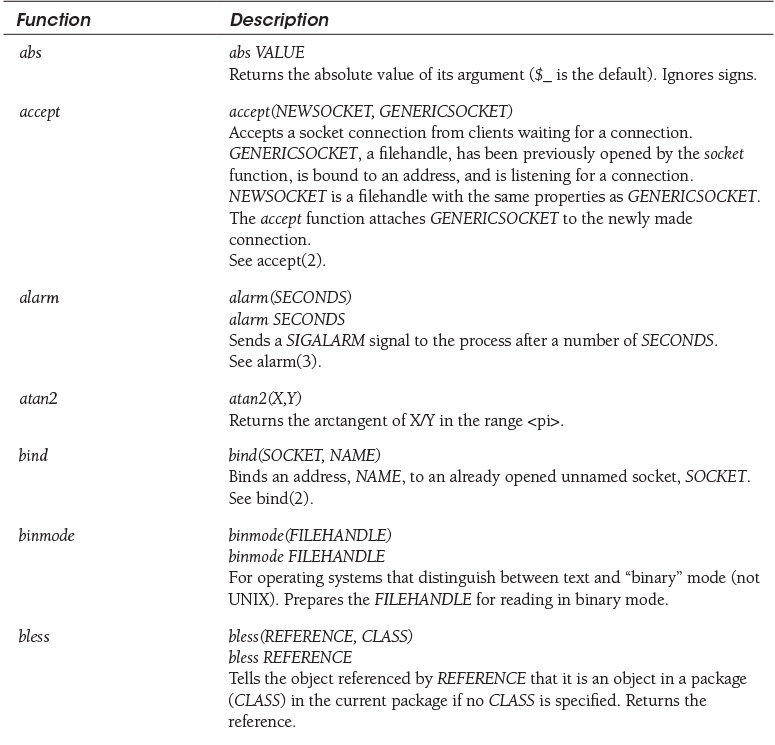
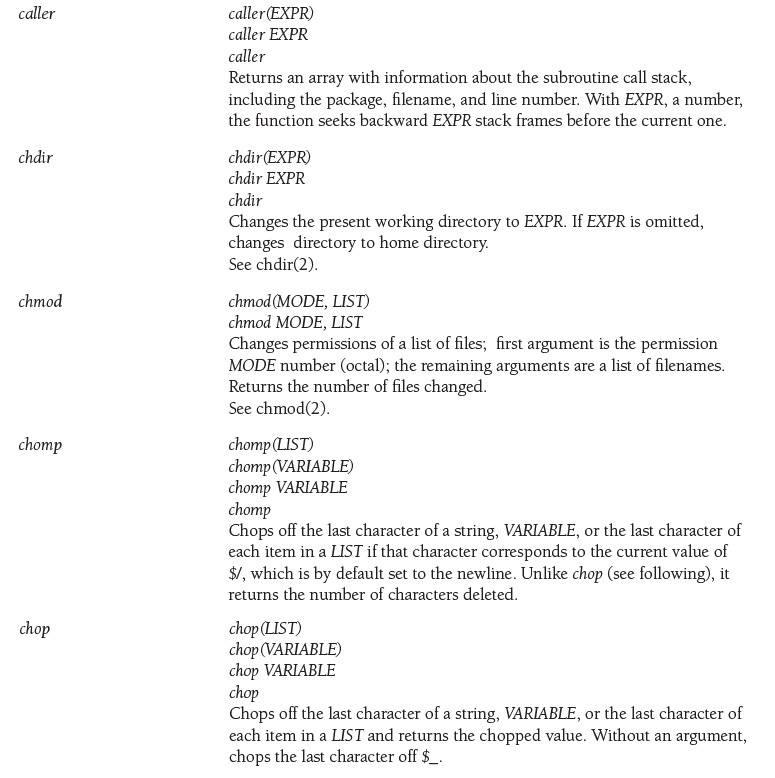
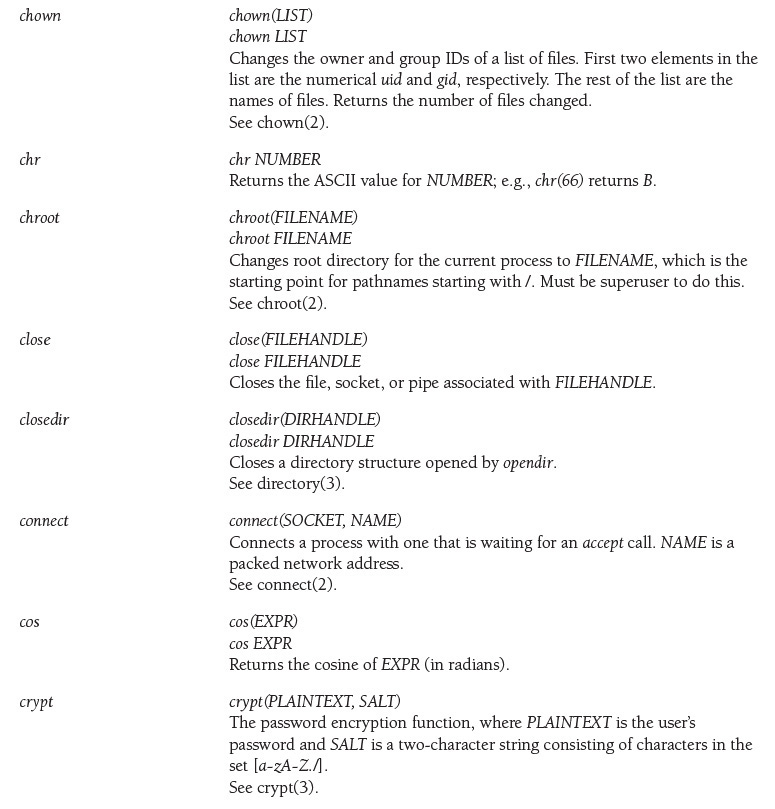
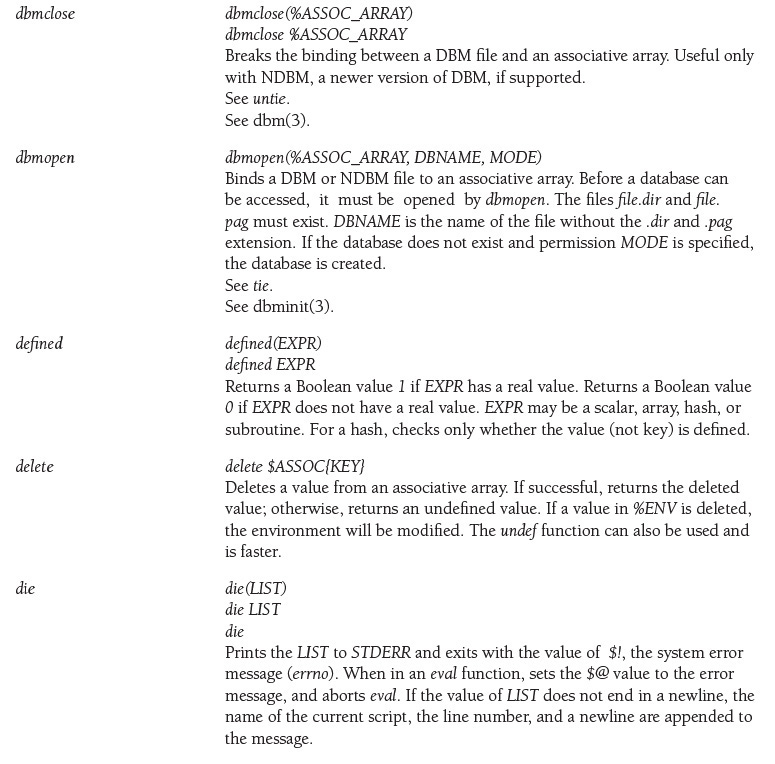
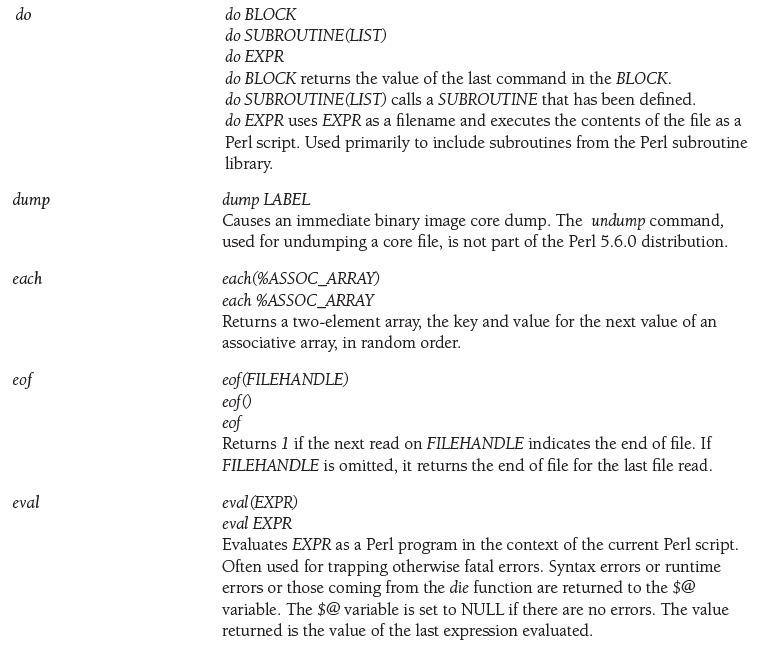
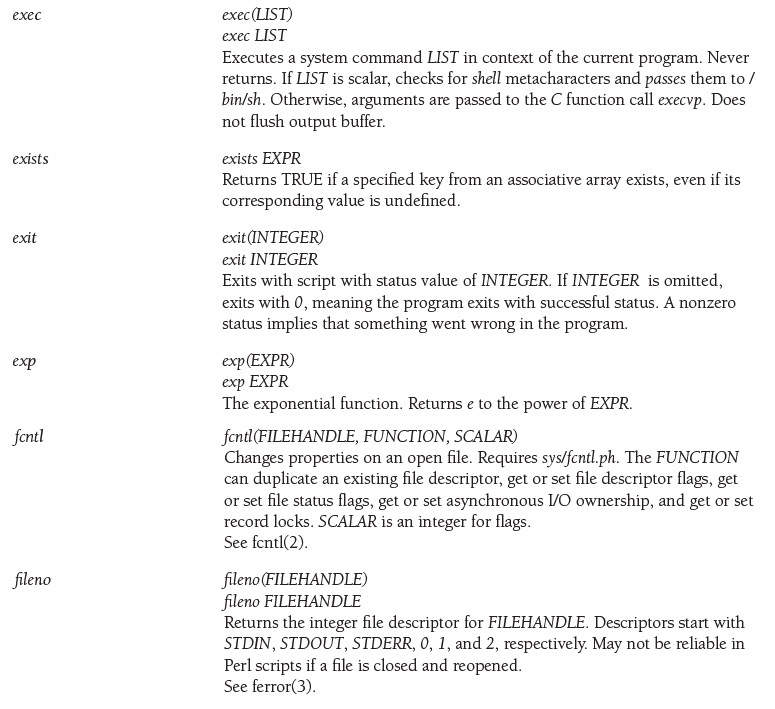
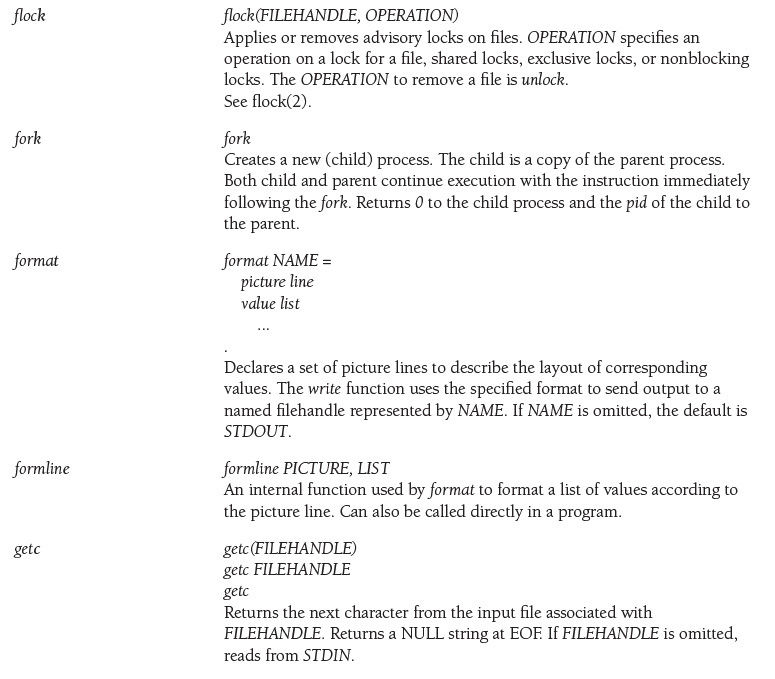
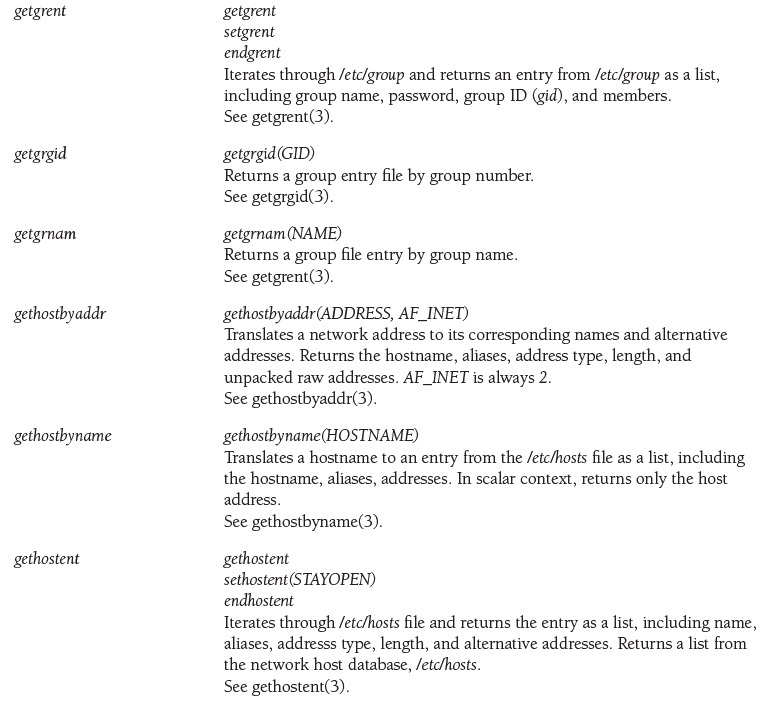
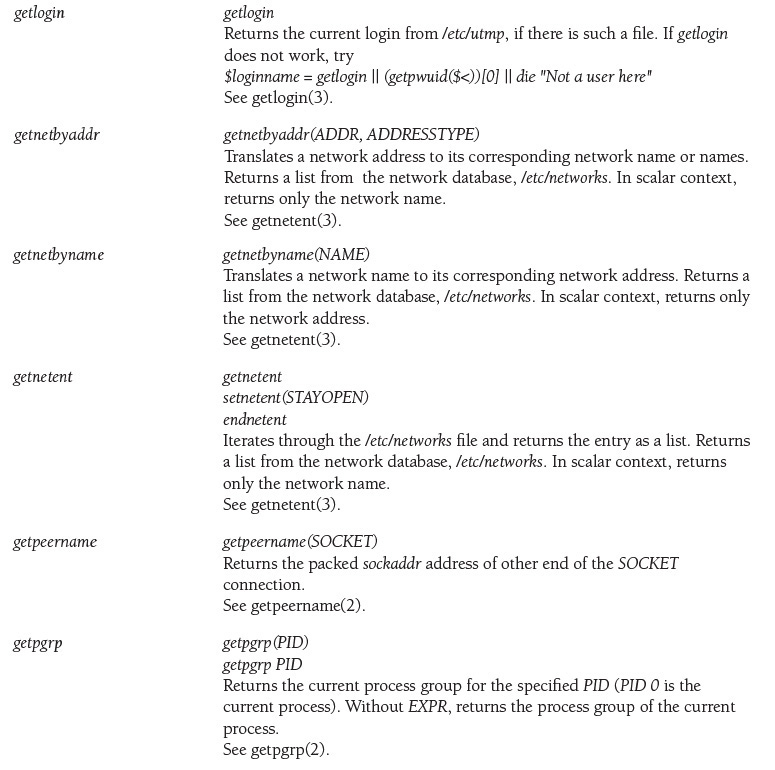
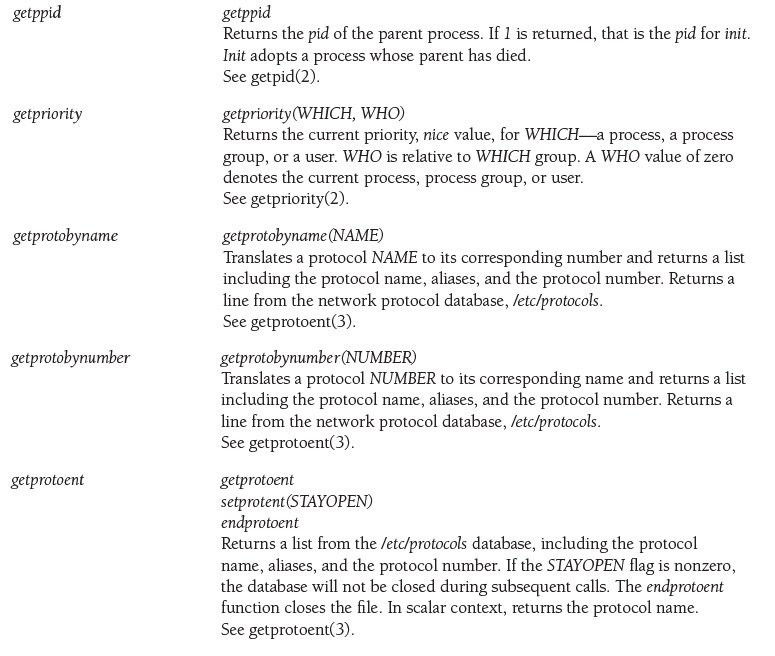
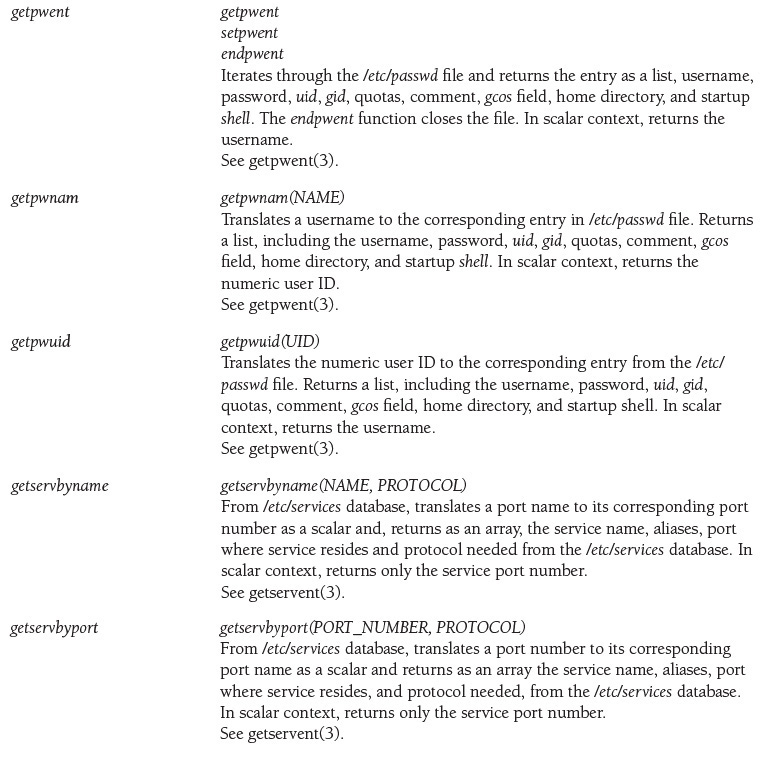
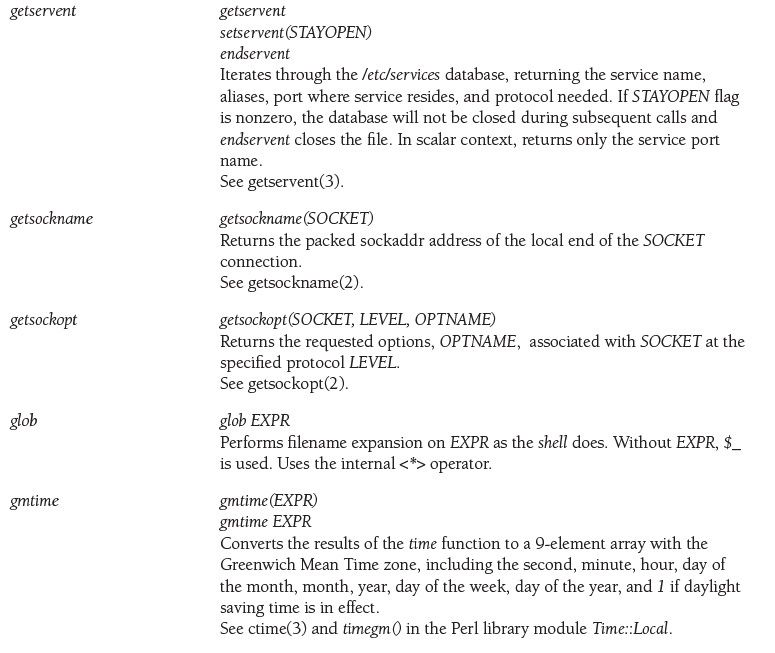
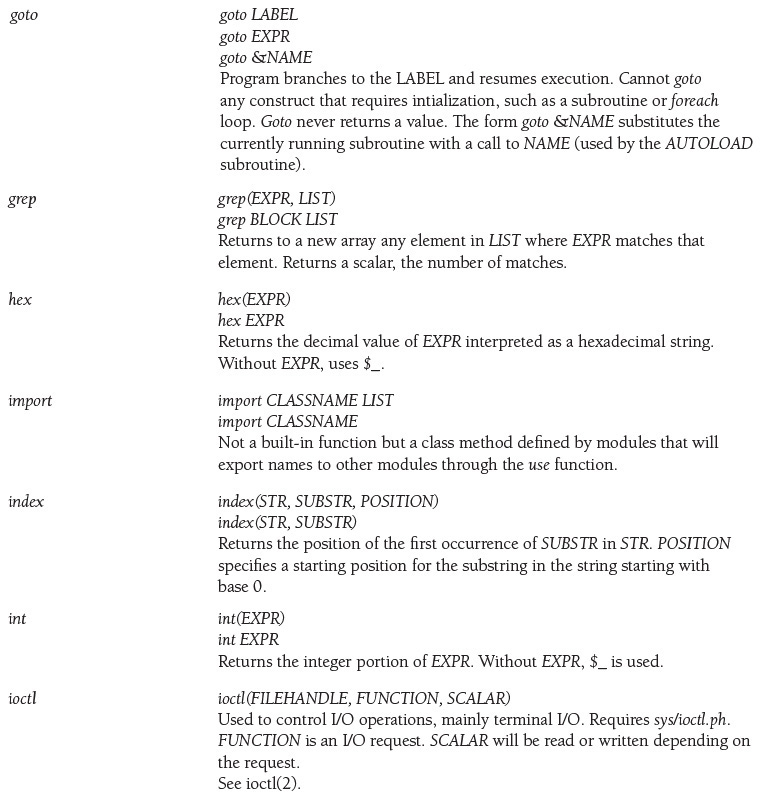
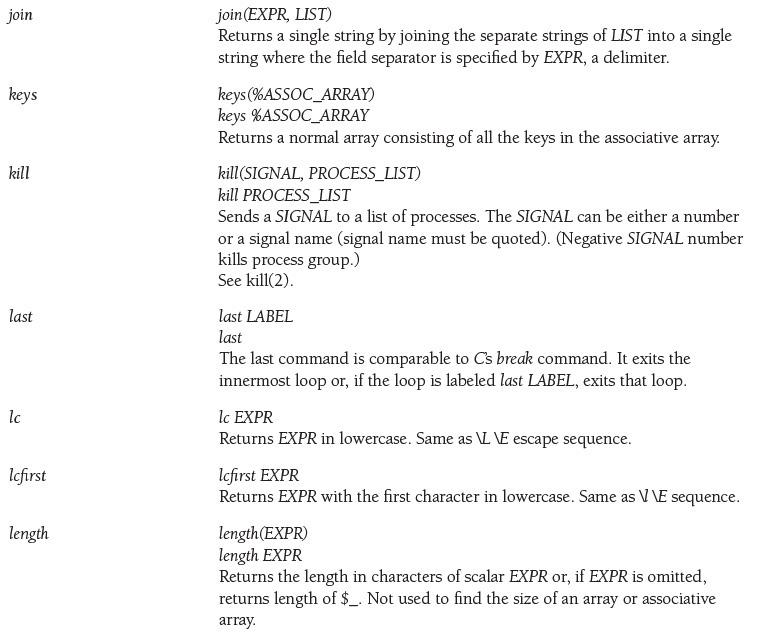
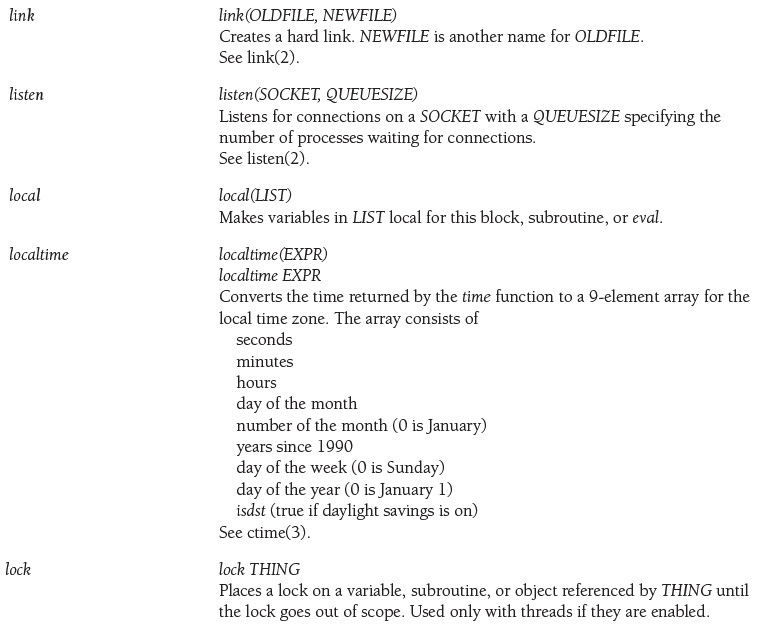
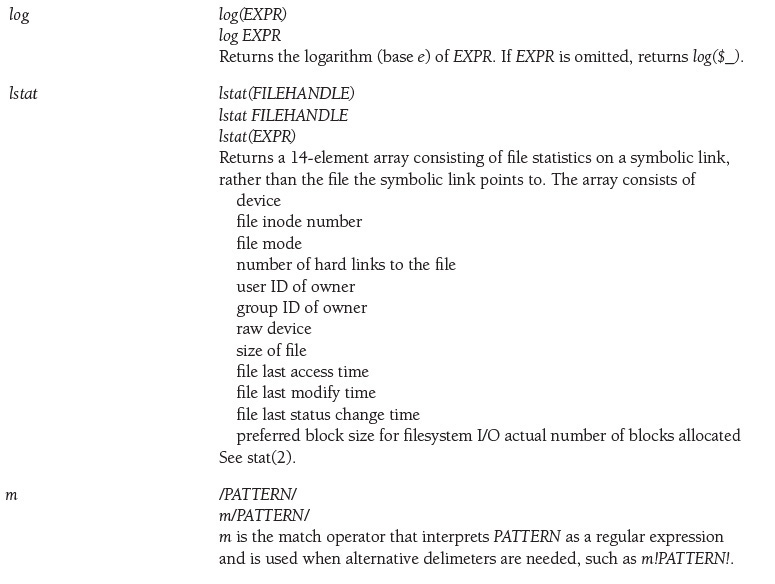
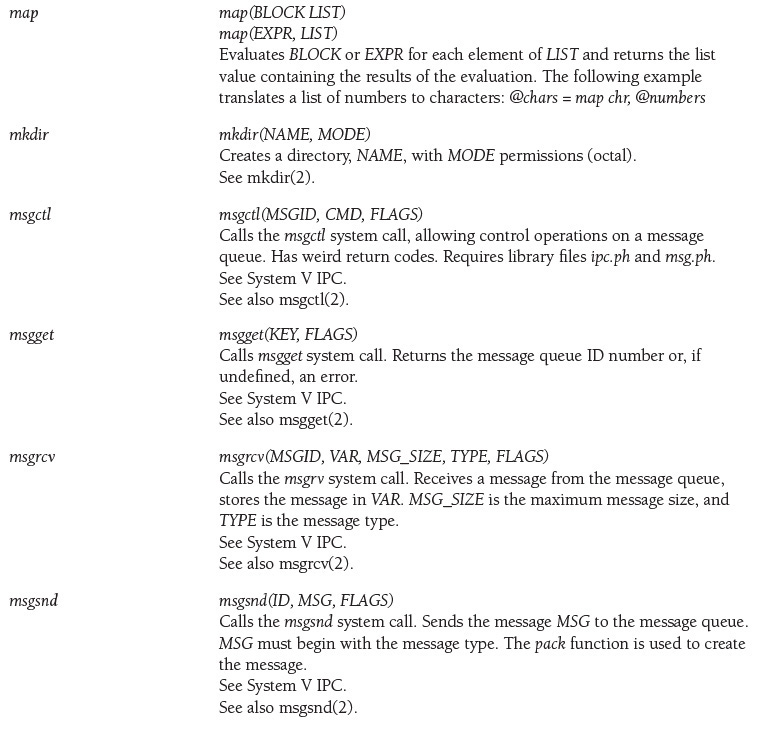
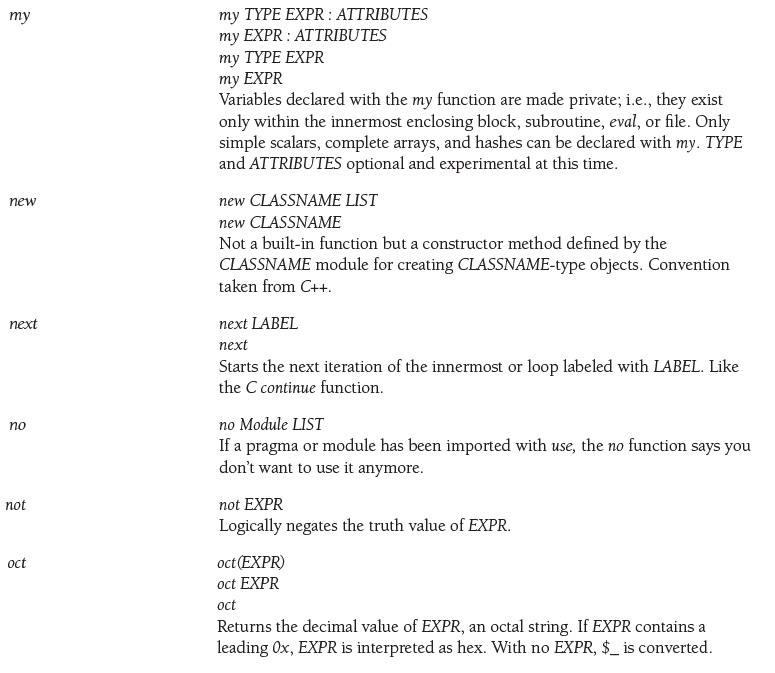
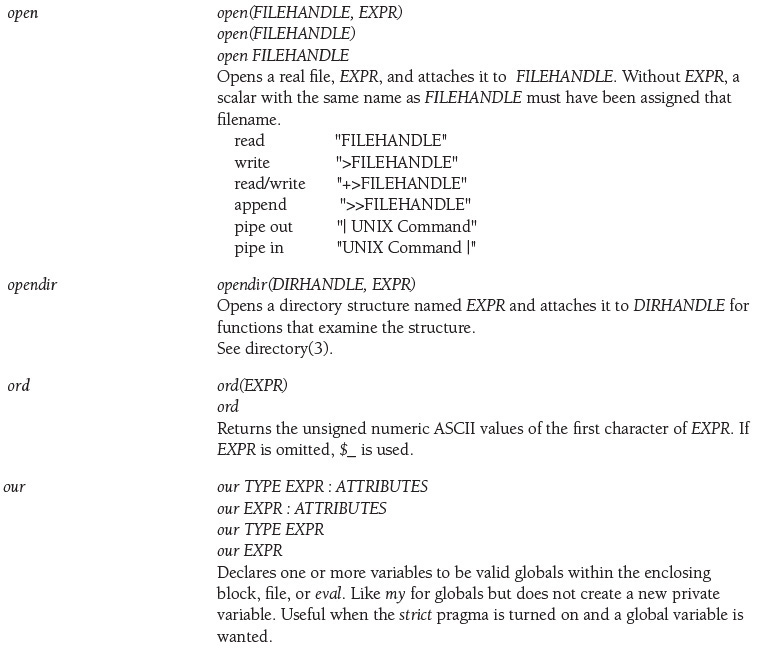
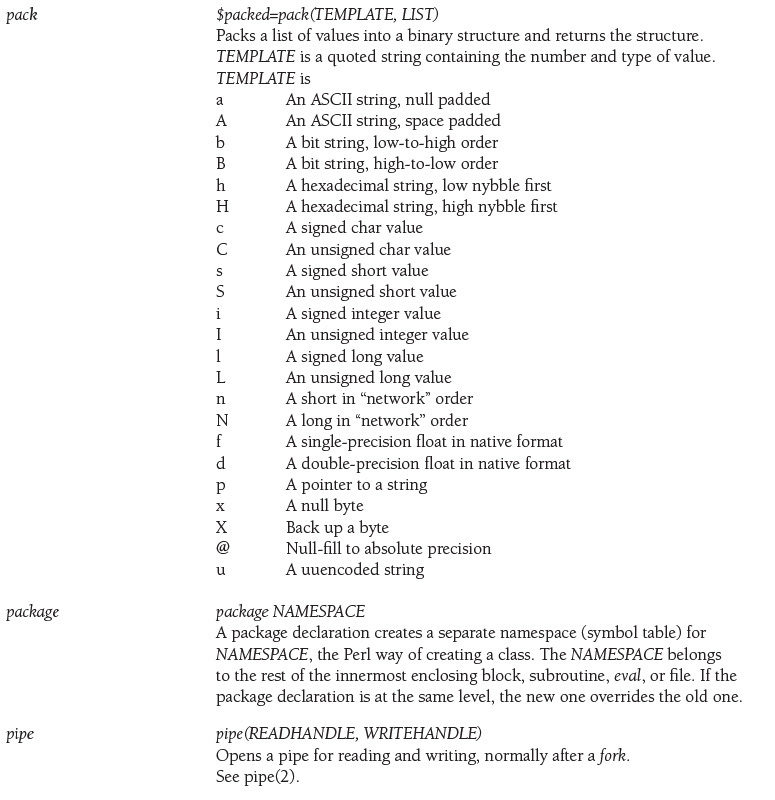
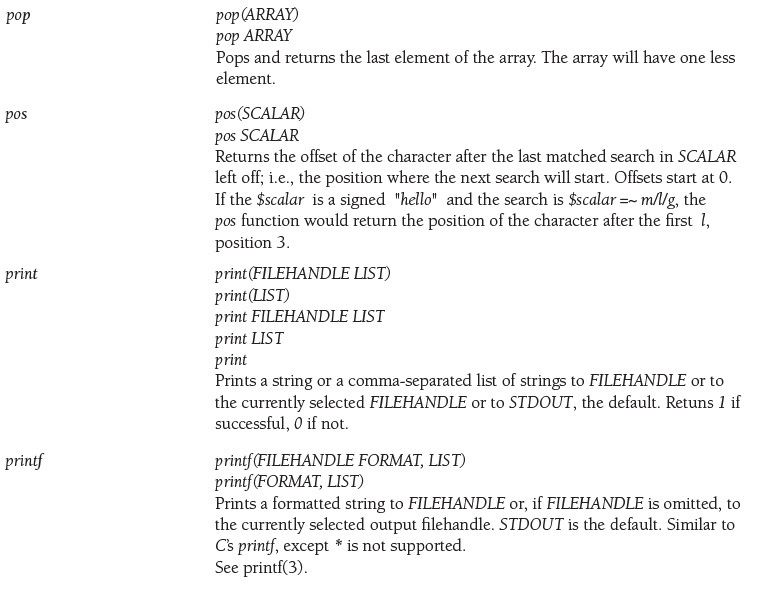
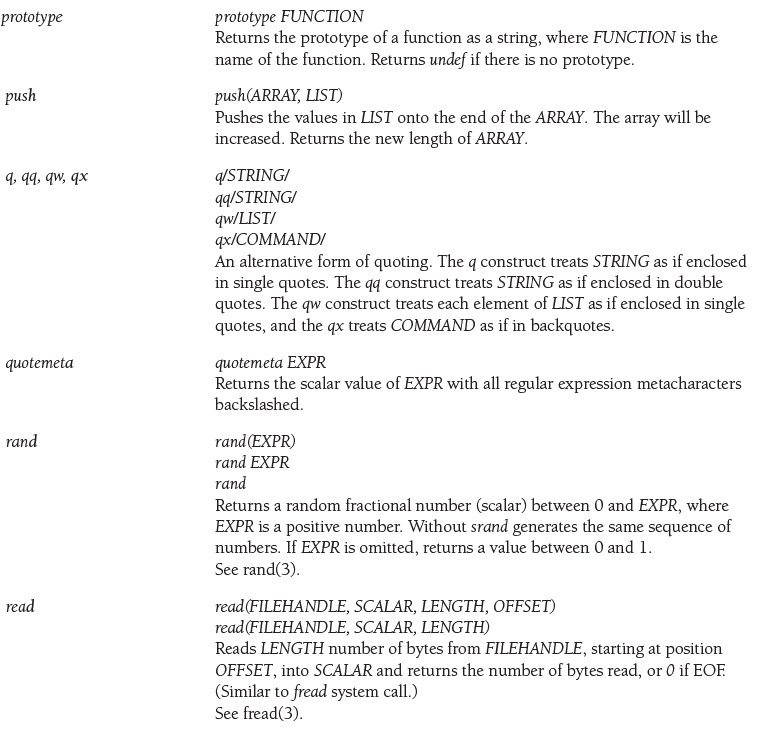
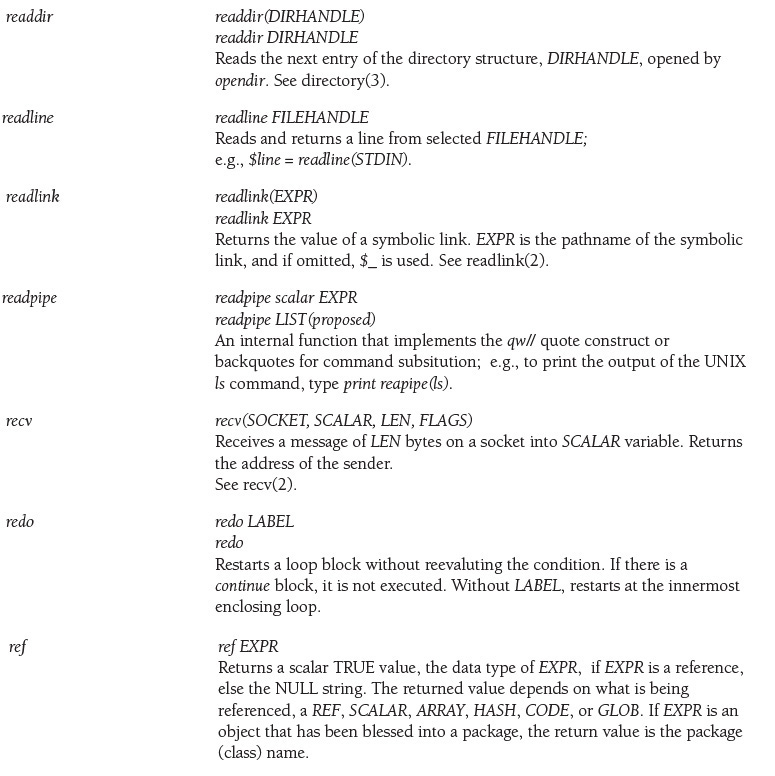
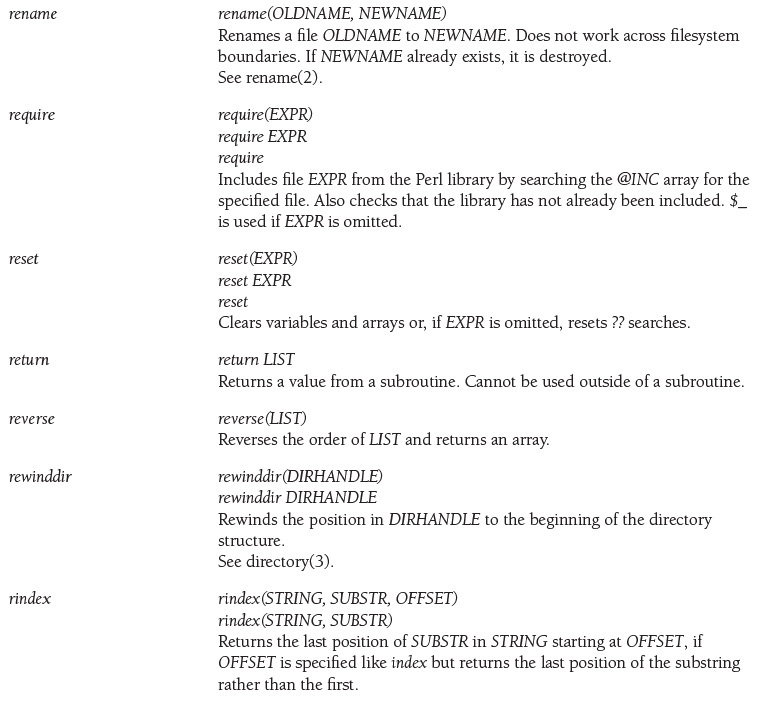
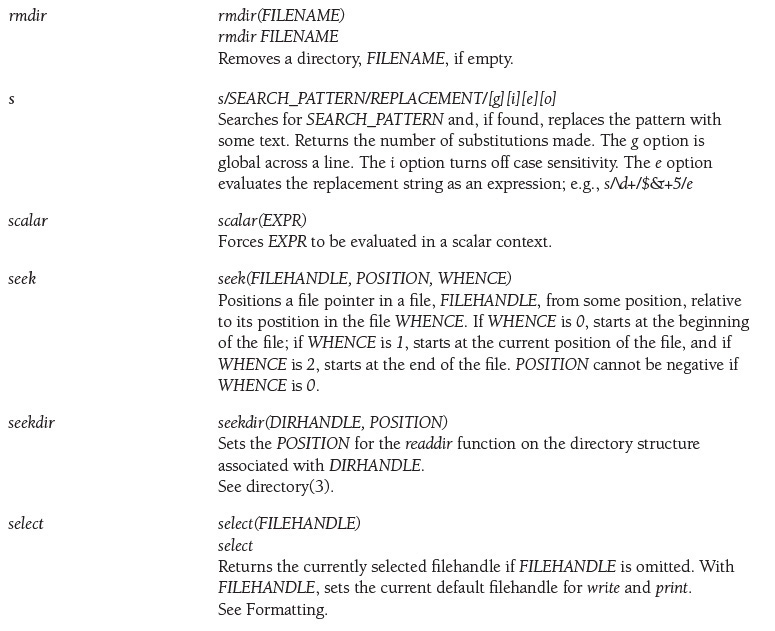
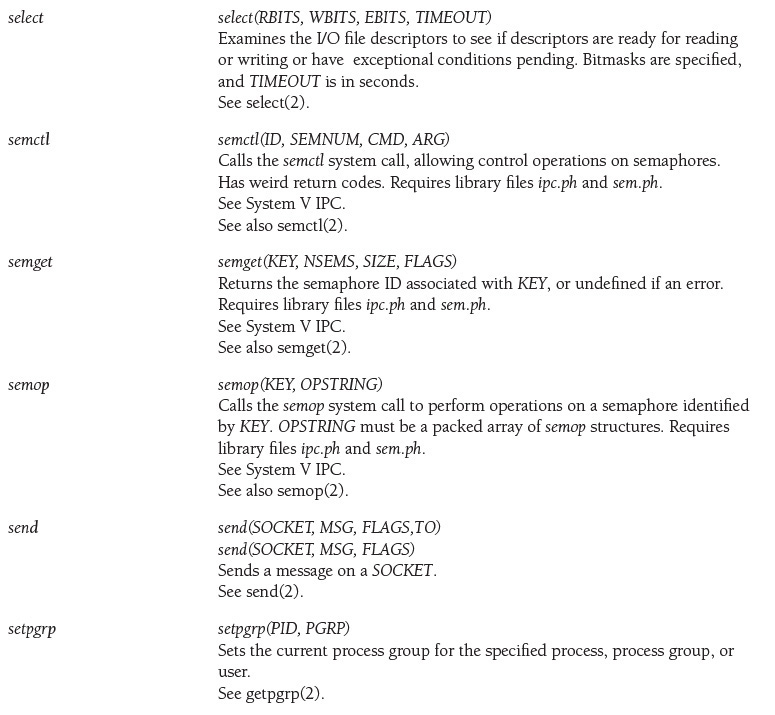
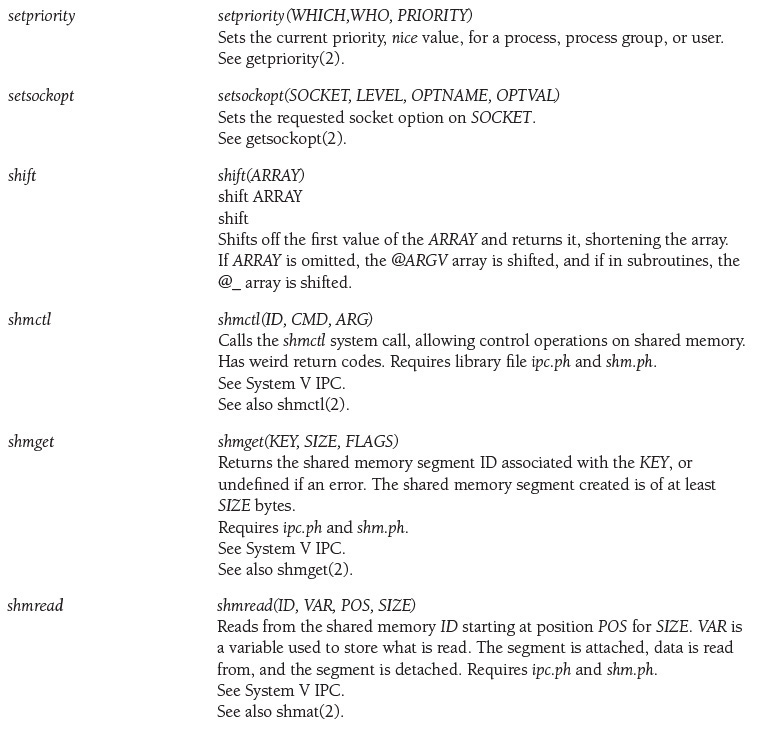
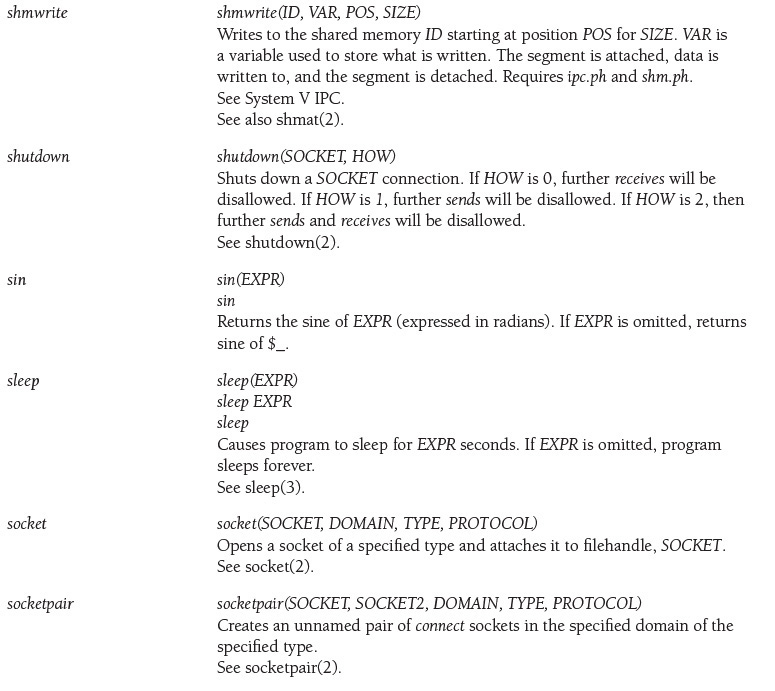
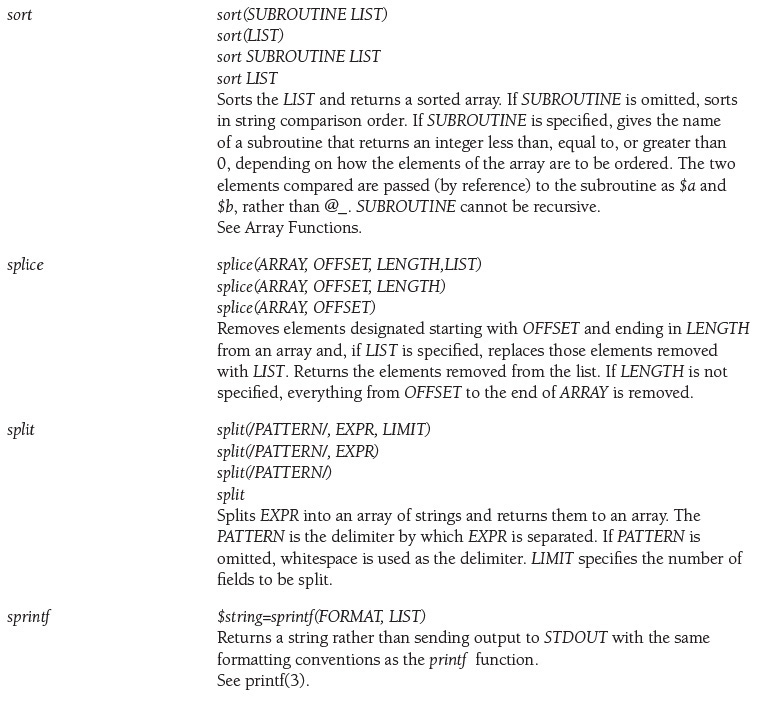
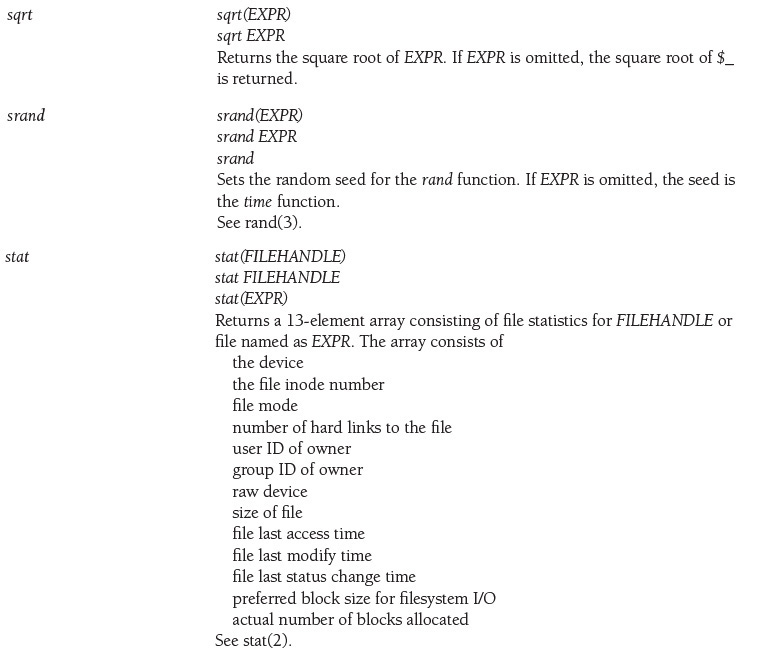
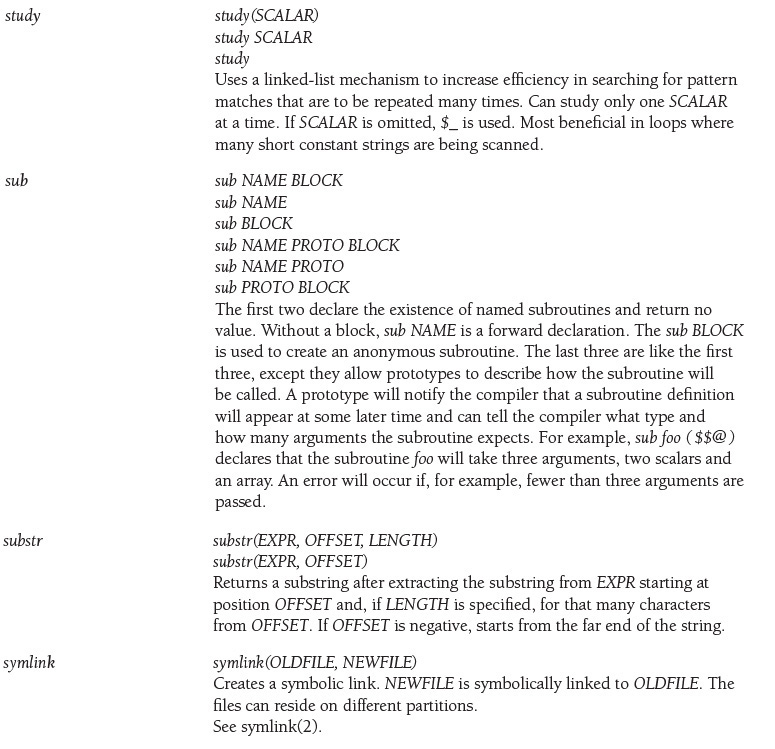
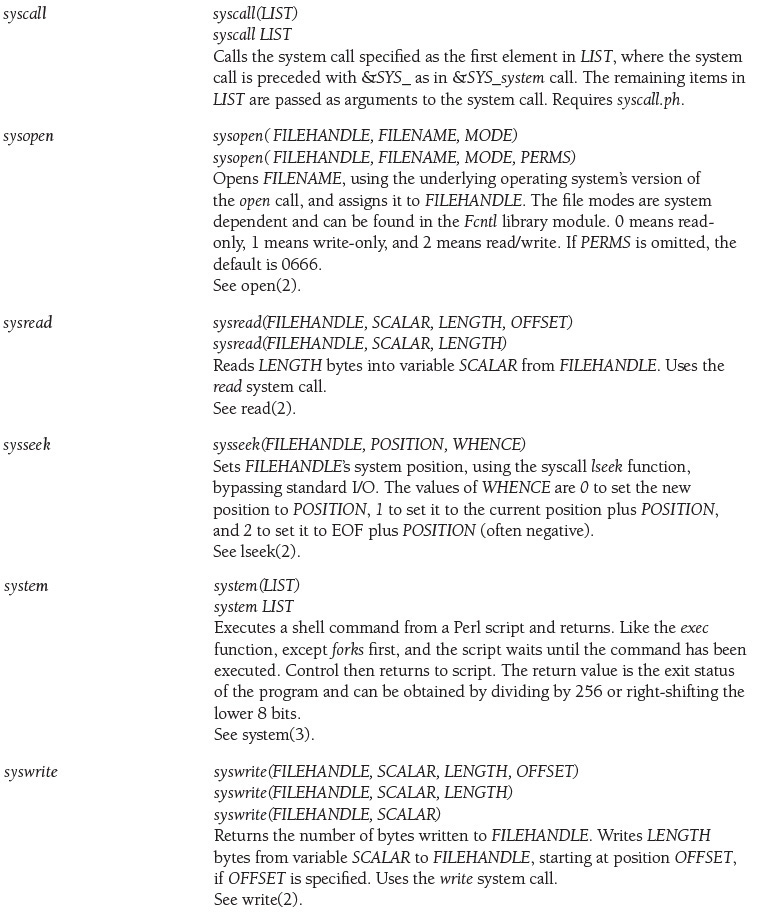
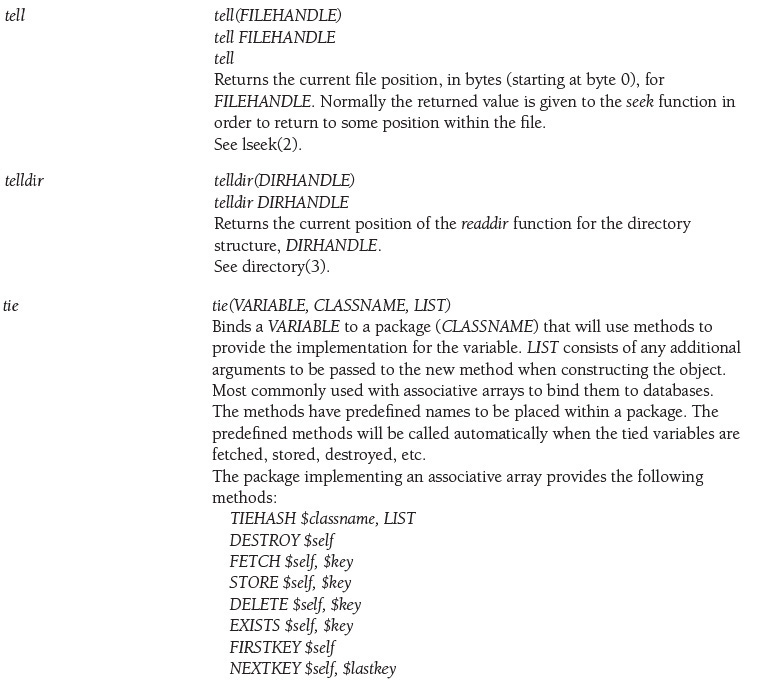
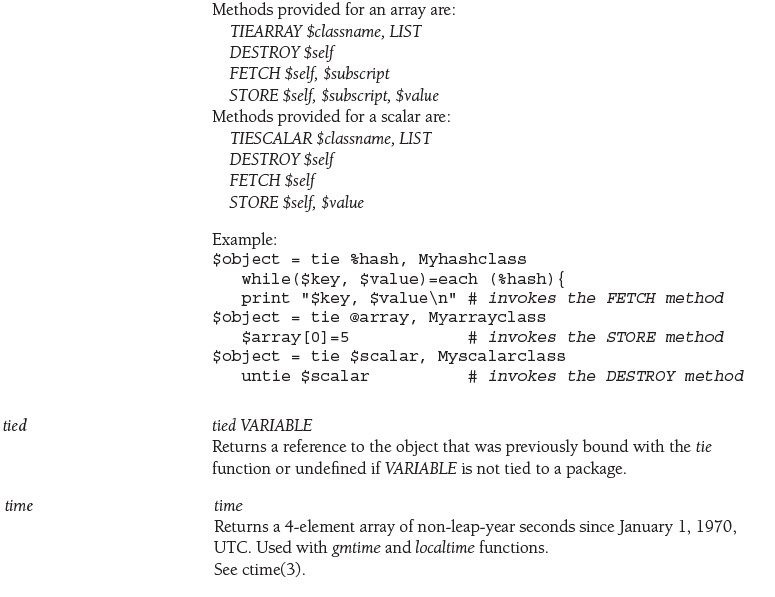
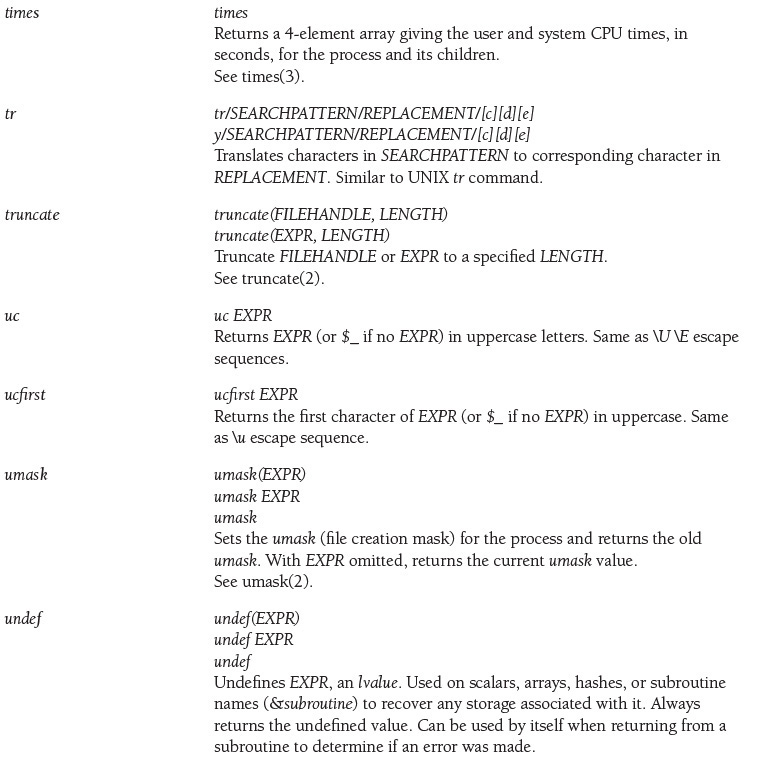
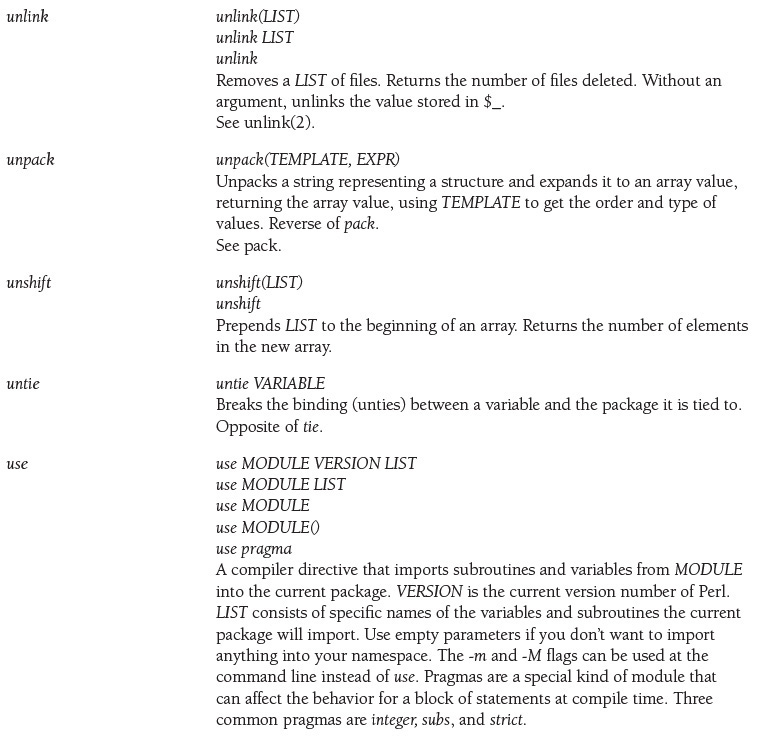
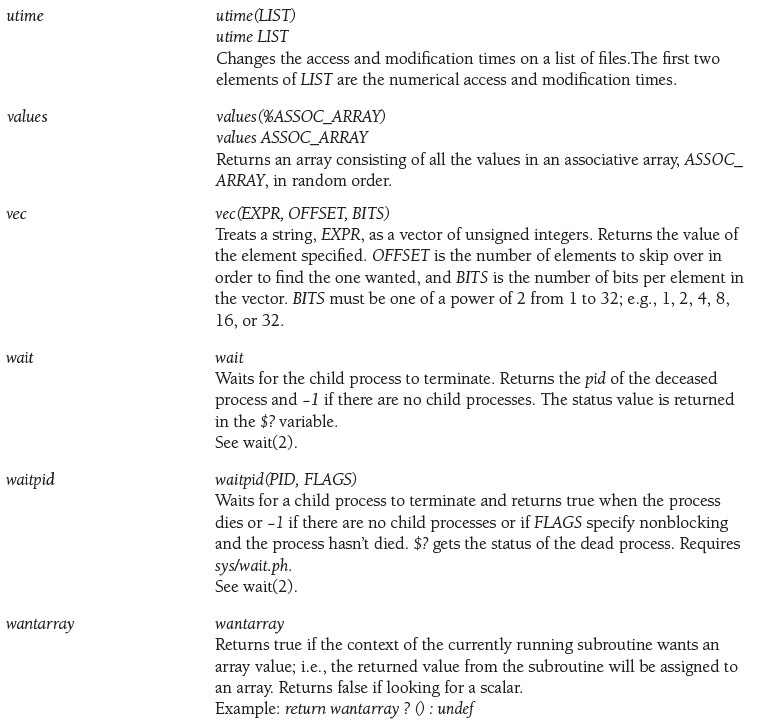
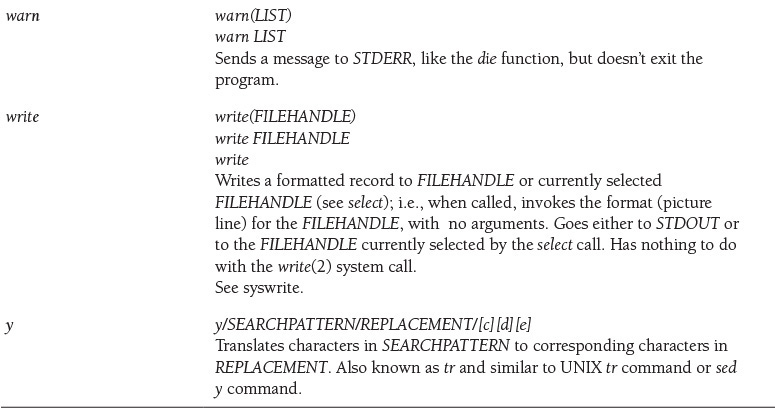
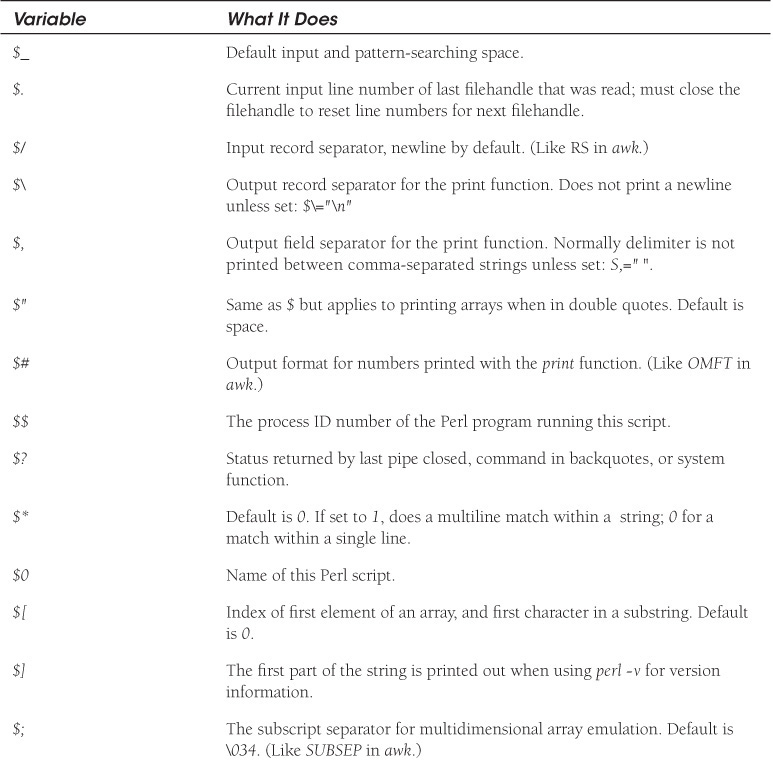
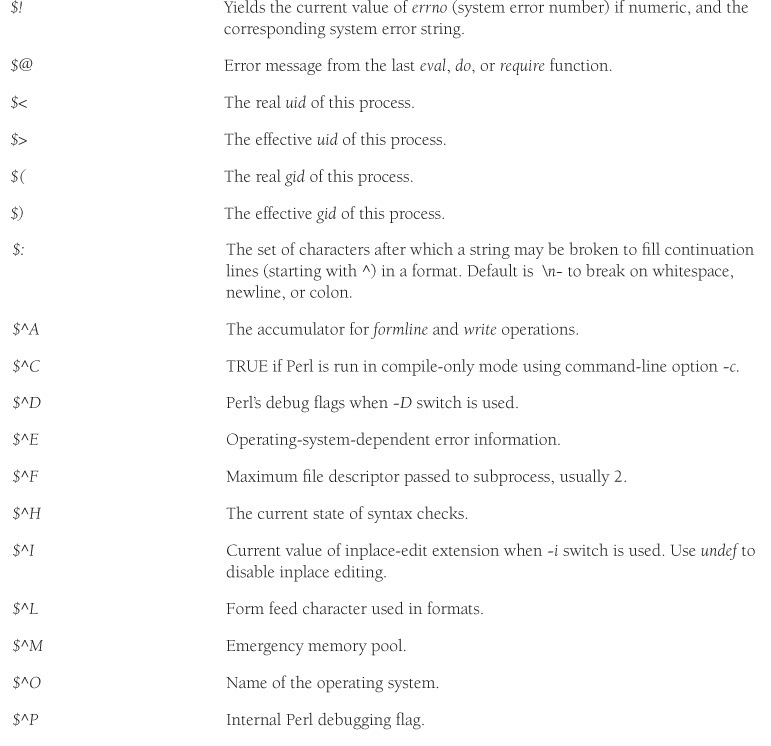
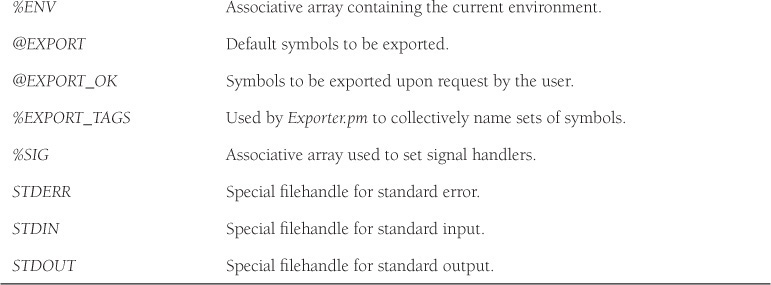
The following is a complete list of Perl functions and a short description of what they do.
Note: The text in parentheses is a reference to the like-named UNIX system call found in Section 2 of the UNIX manual pages. The like-named UNIX library functions are found in Section 3 of the UNIX manual pages.

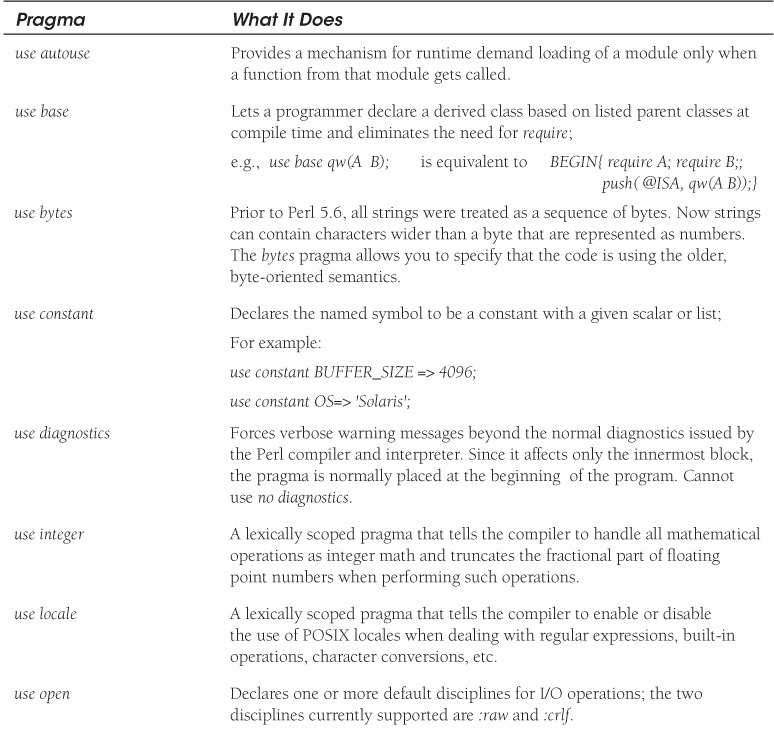
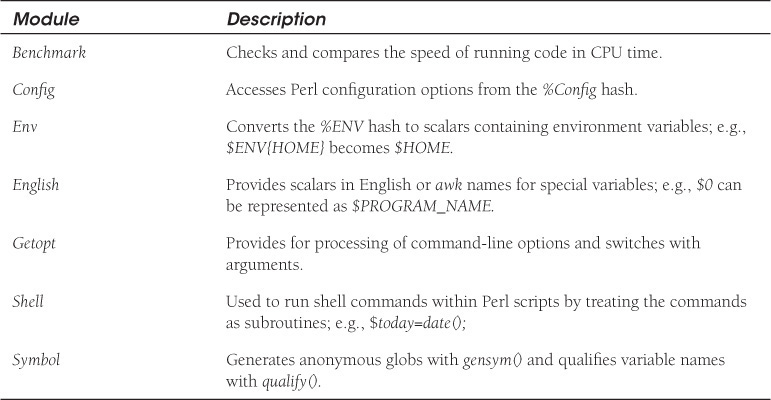
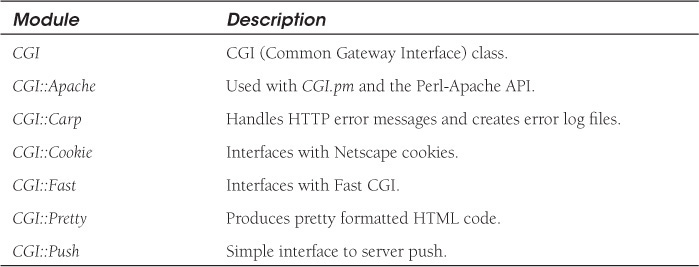
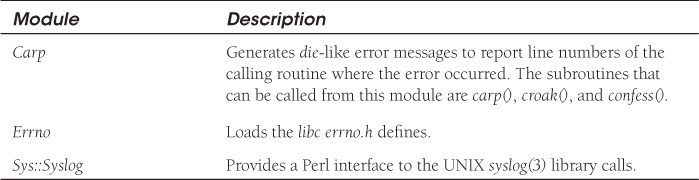
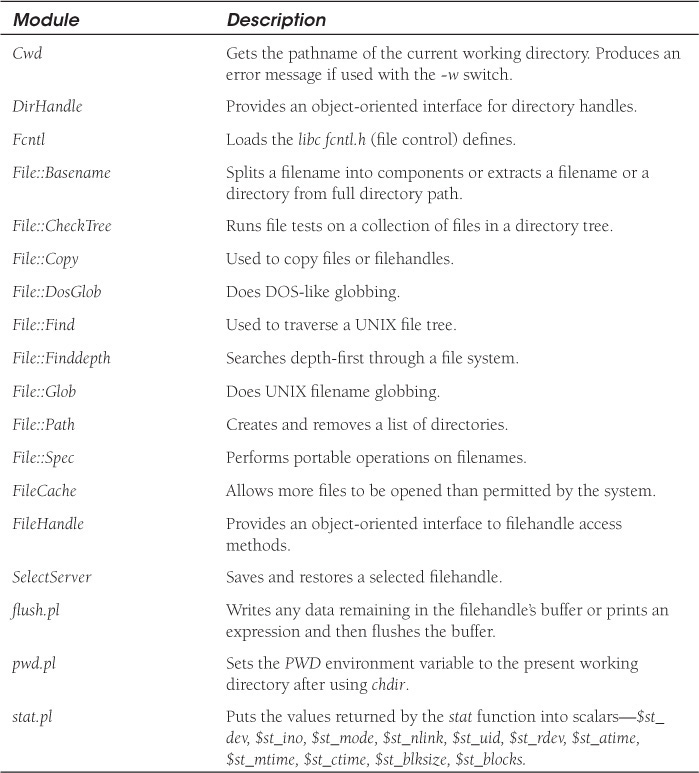
A.3 Perl Pragmas
A pragma is a special “pseudo” module that hints how the compiler should behave. The use declaration allows the importation of compiler directives called pragmas into your Perl program. Pragmas determine how a block of statements will be compiled. They are lexically scoped; the scope is limited to the current enclosing block and can be turned off with the no directive. Pragma names are conventionally lowercase. Table A.5 is a partial list.


A.6 Debugger
A.6.1 Getting Information About the Debugger
Information on how to use the debugger is found by typing at your command line:
perldoc perldebug
Here is a sample of the output:
NAME
perldebug - Perl debugging
DESCRIPTION
First of all, have you tried using the -w switch?
A.6.2 The Perl Debugger
If you invoke Perl with the -d switch, your script runs under the Perl source debugger. This works like an interactive Perl environment, prompting for debugger commands that let you examine source code, set breakpoints, get stack backtraces, change the values of variables, and so on. This is so convenient that you often fire up the debugger all by itself just to test out Perl constructs interactively to see what they do. For example:
$ perl -d -e 42
In Perl, the debugger is not a separate program the way it usually is in the typical compiled environment. Instead, the -d flag tells the compiler to insert source information into the parse trees it’s about to hand off to the interpreter. That means your code must first compile correctly for the debugger to work on it. Then when the interpreter starts up, it preloads a special Perl library file containing the debugger.
The program will halt right before the first runtime executable statement (but see following regarding compile-time statements) and ask you to enter a debugger command. Contrary to popular expectations, whenever the debugger halts and shows you a line of code, it always displays the line it’s about to execute rather than the one it has just executed.
Any command not recognized by the debugger is directly executed (eval’d) as Perl code in the current package. (The debugger uses the DB package for keeping its own state information.)
For any text entered at the debugger prompt, leading and trailing whitespace is first stripped before further processing. If a debugger command coincides with some function in your own program, merely precede the function with something that doesn’t look like a debugger command, such as a leading ; or perhaps a +, or by wrapping it with parentheses or braces.
<continues here>
----------------------------------------
A.6.3 Entering and Exiting the Debugger
To invoke the Perl debugger, use the -d switch. It allows you to examine your program in an interactive-type environment after it has successfully compiled. After each line, the script will stop and ask for a command. The line you will be looking at is the next line that will be executed, not the previous one. The prompt contains the current package, function, file and line number, and the current line. Following is a list of the debug commands.
Once you start the debugger, all the debugging commands are listed by typing h at the debug prompt, or h h if you can’t read what is displayed.
To exit the debugger, type q for quit or R for restart.
$ perl -d exer.1
Loading DB routines from $RCSfile: perldb.pl,v $$Revision: 4.0.1.2
$$Date: 91/11/05 17:55:58 $
Emacs support available.
Enter h for help.
main'(exer.1:3): print "Today is ", 'date';
DB<1> h
T Stack trace.
s Single step.
n Next, steps over subroutine calls.
r Return from current subroutine.
c [line] Continue; optionally inserts a one-time-only
breakpoint at the specified line.
<CR> Repeat last n or s.
l min+incr List incr+1 lines starting at min.
l min-max List lines.
l line List line.
l List next window.
- List previous window.
w line List window around line.
l subname List subroutine.
f filename Switch to filename.
/pattern/ Search forwards for pattern; final / is optional.
?pattern? Search backwards for pattern.
L List breakpoints and actions.
S List subroutine names.
t Toggle trace mode.
b [line] [condition] Set breakpoint; line defaults to the current
execution line; condition breaks if it evaluates to
true, defaults to 1.
b subname [condition] Set breakpoint at first line of subroutine.
d [line] Delete breakpoint.
D Delete all breakpoints.
a [line] command Set an action to be done before the line is executed.
Sequence is: check for breakpoint, print line if
necessary, do action, prompt user if breakpoint or
step, evaluate line.
A Delete all actions.
V [pkg [vars]] List some (default all) variables in package (default
current).
X [vars] Same as "V currentpackage [vars]".
< command Define command before prompt.
> command Define command after prompt.
! number Redo command (default previous command).
! -number Redo numberth-to-last command.
H -number Display last number commands (default all).
q or ^D Quit.
p expr Same as "print DB'OUT expr" in current package.
= [alias value] Define a command alias, or list current aliases.
command Execute as a Perl statement in current package.
DB<1> l
3: print "Today is ", 'date';
4: print "The name of this uperl scripte is $0.
";
5: print "Hello. The number we will examine is 125.5.
";
6: printf "The unumbere is %d.
", 125.5;
7: printf "The unumbere is %d.
", 125.5;
8: printf "The following number is taking up 20 spaces and is
right-justified.
";
9: printf "|%-20s|
", 125;
10: printf " The number in hex is %x
", 125.5;
11: printf " The number in octal is %o
", 125.5;
12: printf "The number in scientific notation is %e
", 125.5;
DB<1> q (quit)
A.6.4 Debugger Commands
Getting help:
h Lists help messages for all debugger commands.
h p Lists a help message for debugger command p.
Listing parts of a script:
l Lists 10 lines of the program.
l 8 Lists line 8.
l 5-10 Lists lines 5 through 10.
l greetme Lists statements in subroutine greetme.
L Lists the next line to execute.
w7 Lists a window of lines containing specified line 7. Lists three lines before the specified lines and fills the window with lines after it.
/^abc/ Searches forward for regular expression abc, where abc is at the beginning of the line.
?abc? Searches backward for regular expression abc.
S Lists all subroutines in the program by package name, two colons, and the name of the subroutine.
r Executes the remainder of statements in the current subroutine and then displays the line immediately after the subroutine call.
Stepping line by line:
s Single step a line at a time through the script.
n Like s but executes subroutine calls without stepping through them.
Enter Pressing the Enter key causes the previous s or n command to be repeated.
. Repeats the last line executed.
- Repeats all lines preceding the current one.
r Continues until the currently executing subroutine returns and displays the return value and type after returning.
Getting out of the debugger:
q Quit the debugger.
<CTRL>+D Quit the debugger.
R Restart the debugger and a new session.
Breakpoints:
Breakpoints allow you to set a place where the program will stop so you can examine what’s going on. They must be set on lines that start an executable statement.
b 45 Sets breakpoint to line 45. Type c to continue and the program will stop execution at line 45.
c Continue execution.
b greetme Sets breakpoint to subroutine greetme.
b $x > 10 Triggers a breakpoint only if the condition is true.
w Creates a window around the breakpoint and marks the line where the breakpoint is found; e.g., 10==>b (breakpoint is at line 10).
d Deletes the breakpoint on the line about to execute.
d 12 Deletes the breakpoint at line 12.
D Deletes all breakpoints.
Printing variable values:
X name Displays the value of any variables called name. Variable names are NOT preceded by their identifying funny character; e.g., use x rather than $x or @x.
V package Displays all variables within a package.
p $x + 3 Evaluates and prints the expression.
T Produces a stack backtrace listing of what subroutines were called.
t Toggles trace mode.
Aliases:
= Lists all aliases.
= ph print “$hashref->{Science}->{Lou}” ph is an alias for printing a hash value.