
Chapter Notes
Key Terms
Note: Asterisks (*) denote terms from the optional section in this chapter.
Key Symbols
| General population parameter (theta) | |
| Population mean | |
| Population variance | |
| Population standard deviation | |
| p | Population proportion; P (Success) in binomial trial |
| q | |
| Sample mean (estimator of ) | |
| Sample variance (estimator of ) | |
| Sample proportion (estimator of p) | |
| Mean of the population sampling distribution of | |
| Standard deviation of the sampling distribution of | |
| Standard deviation of the sampling distribution of | |
| SE | Sampling error in estimation |
| represents the confidence coefficient | |
| z-value used in a large-sample confidence interval for or p | |
| Student’s t-value used in a small-sample confidence interval for | |
| *Chi-Square value used in a confidence interval for |
Key Ideas
Confidence Interval: An interval that encloses an unknown population parameter with a certain level of confidence,
Confidence Coefficient: The probability that a randomly selected confidence interval encloses the true value of the population parameter.
Population Parameters, Estimators, & Standard Errors
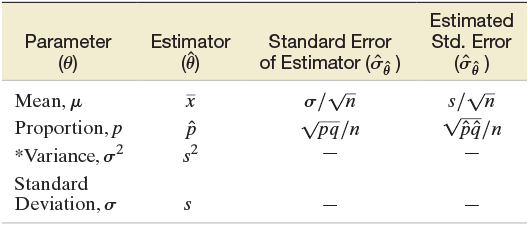
Alternate View
| Parameter ( ) | Estimator ( ) | Standard Error of Estimator ( ) | Estimated Std. Error ( ) |
|---|---|---|---|
| Mean, | |||
| Proportion, p | |||
| *Variance, | — | — | |
| Standard Deviation, | s | — | — |
Determining the Sample Size n:
Estimating Estimating p:
Key Words for Identifying the Target Parameter:
—Mean, Average
p—Proportion, Fraction, Percentage, Rate, Probability
—Variance, Variation, Spread
Commonly Used z-values for a Large-Sample Confidence Interval for or p:
90% CI: 95% CI: 98% CI: 99% CI:
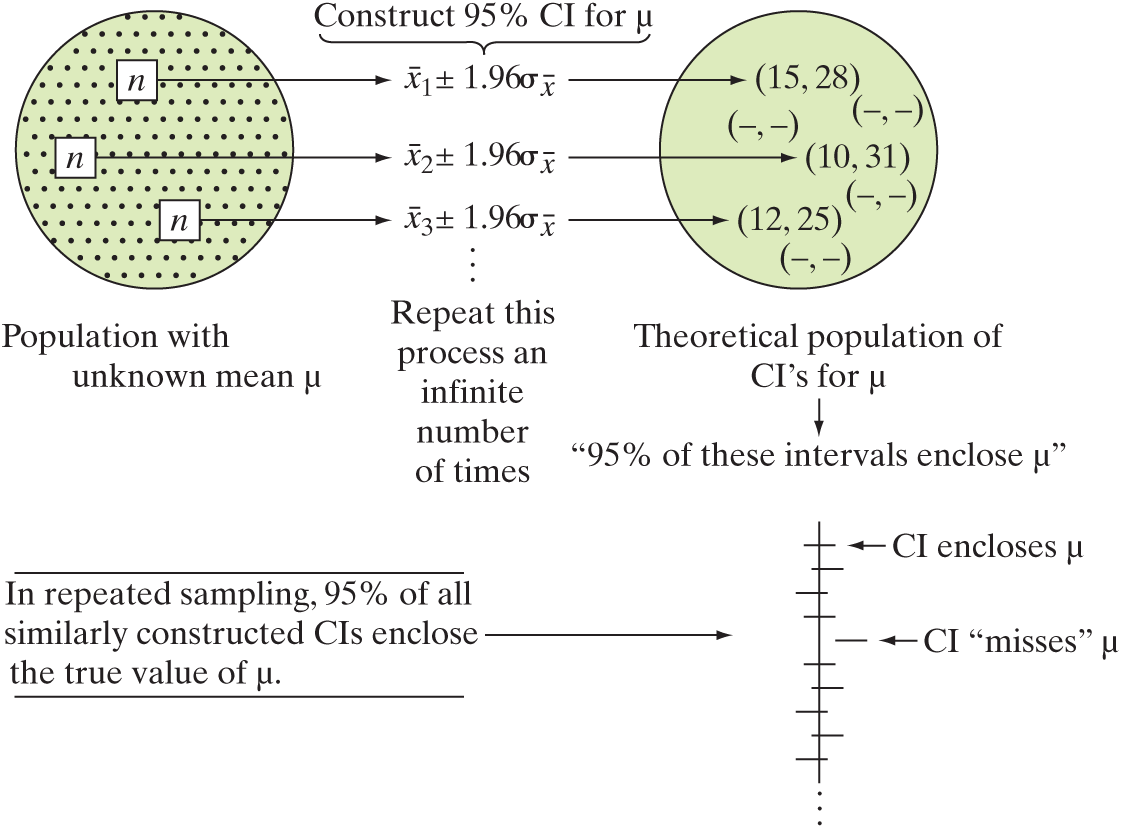
Illustrating the Notion of “95% Confidence”
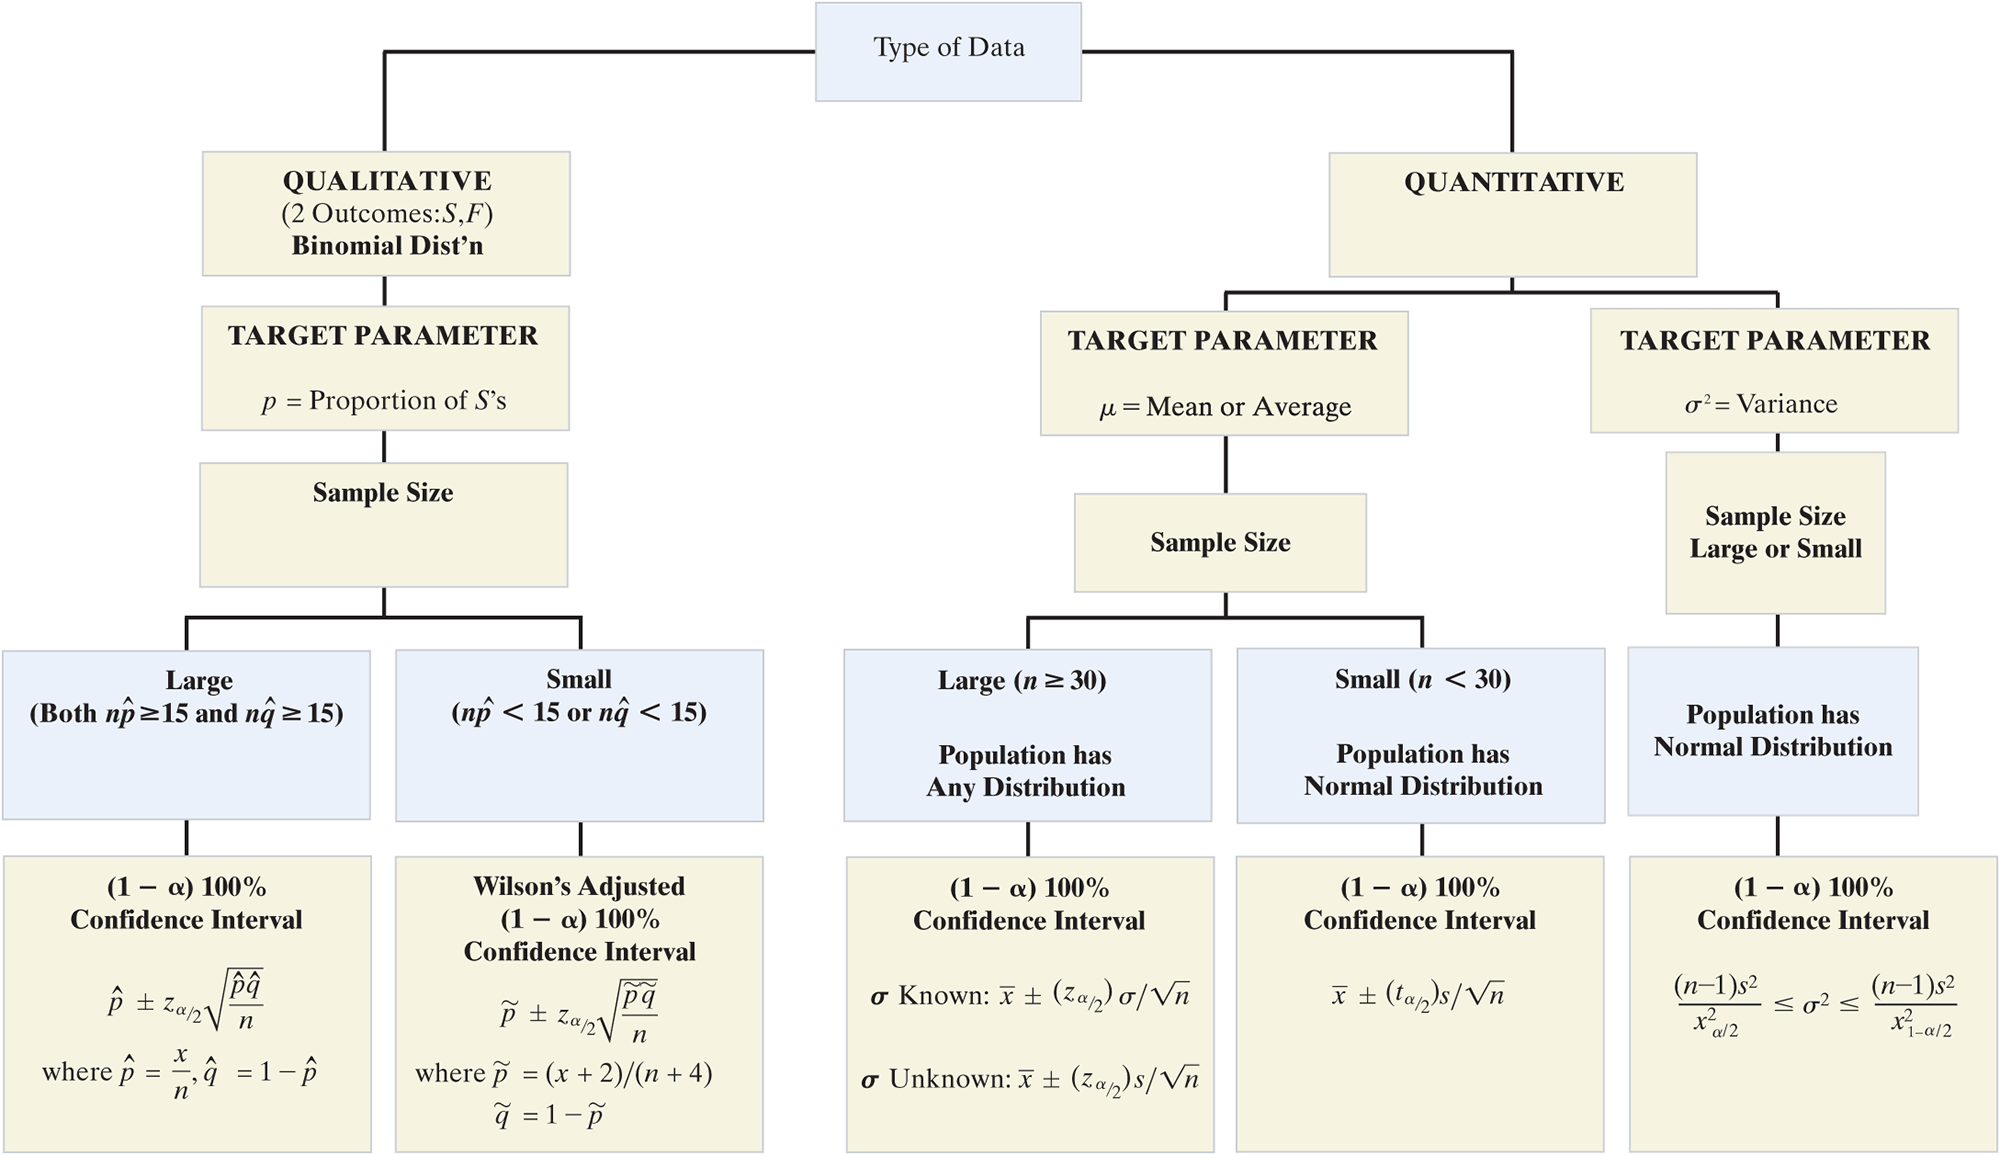
Guide to Forming a Confidence Interval
Supplementary Exercises 5.118–5.152
Note: List the assumptions necessary for the valid implementation of the statistical procedures you use in solving all these exercises. Starred (*) exercises are from the optional section in this chapter.
Understanding the Principles
5.118 Interpret the phrase “95% confident” in the following statement: “We are 95% confident that the proportion of all PCs with a computer virus falls between .12 and .18.”
5.119 For each of the following, identify the target parameter as , p, or .
a. Average score on the SAT
b. Mean time waiting at a supermarket checkout lane
c. Proportion of voters in favor of legalizing marijuana
d. Percentage of NFL players who have ever made the Pro Bowl
e. Dropout rate of American college students
*f. Variation in IQ scores of sociopaths
5.120 In each of the following instances, determine whether you would use a z- or t-statistic (or neither) to form a 95% confidence interval for ; then look up the appropriate z or t value.
Random sample of size from a normal distribution with unknown mean and standard deviation
Random sample of size from a normal distribution with unknown mean and standard deviation
Random sample of size from a normal distribution with unknown mean and standard deviation
Random sample of size from a distribution about which nothing is known
Random sample of size from a distribution about which nothing is known
Learning the Mechanics
*5.121 Use Table IV , Appendix B, or statistical software to find for each of the following:
5.122 Let represent a particular value of t from Table III of Appendix B. Find the table values such that the following statements are true:
where
where
or where
or where
5.123 In a random sample of 400 measurements, 227 possess the characteristic of interest, A.
Use a 95% confidence interval to estimate the true proportion p of measurements in the population with characteristic A.
How large a sample would be needed to estimate p to within .02 with 95% confidence?
5.124 A random sample of 225 measurements is selected from a population, and the sample mean and standard deviation are and respectively.
a. Use a 99% confidence interval to estimate the mean of the population,
b. How large a sample would be needed to estimate to within .5 with 99% confidence?
c. What is meant by the phrase “99% confidence” as it is used in this exercise?
*d. Find a 99% confidence interval for .
Applying the Concepts—Basic
5.125 CDC health survey. The Centers for Disease Control and Prevention (CDCP) in Atlanta, Georgia, conduct an annual survey of the general health of the U.S. population as part of their Behavioral Risk Factor Surveillance System. Using random-digit dialing, the CDCP telephones U.S. citizens over 18 years of age and asks them the following four questions:
Is your health generally excellent, very good, good, fair, or poor?
How many days during the previous 30 days was your physical health not good because of injury or illness?
How many days during the previous 30 days was your mental health not good because of stress, depression, or emotional problems?
How many days during the previous 30 days did your physical or mental health prevent you from performing your usual activities?
Identify the parameter of interest for each question.
5.126 Personal networks of older adults. In sociology, a personal network is defined as the people with whom you make frequent contact. A stratified random sample of men and women born between 1908 and 1937 was used to gauge the size of the personal network of older adults. Each adult in the sample was asked to “please name the people (e.g., in your neighborhood) you have frequent contact with and who are also important to you.” Based on the number of people named, the personal network size for each adult was determined. The responses of 2,819 adults in the sample yielded the following statistics on network size: (Sociological Methods & Research, Aug. 2001).
Give a point estimate for the mean personal network size of all older adults.
Form a 95% confidence interval for the mean personal network size of all older adults.
Give a practical interpretation of the interval you found in part b.
Give the conditions required for the interval in part b to be valid.
5.127 Ancient Greek pottery. Refer to the Chance (Fall 2000) study of 837 pieces of pottery found at the ancient Greek settlement at Phylakopi, presented in Exercise 2.186 (p. 106). Of the 837 pieces, 183 were painted with either a curvilinear, geometric, or naturalistic decoration. Find a 90% confidence interval for the population proportion of all pottery artifacts at Phylakopi that are painted. Interpret the resulting interval.
 NZBIRDS 5.128 Extinct New Zealand birds. Refer to the Evolutionary Ecology Research (July 2003) study of the patterns of extinction in the New Zealand bird population, presented in Exercise 2.108 (p. 78). Suppose you are interested in estimating the mean egg length (in millimeters) for the New Zealand bird population.
What is the target parameter?
Recall that theThe egg lengths for 132 bird species are saved in the NZBIRDS file. Obtain a random sample of 50 egg lengths from the data set.
Find the mean and standard deviation of the 50 egg lengths you obtained in part b.
Use the information from part c to form a 99% confidence interval for the true mean egg length of a bird species found in New Zealand.
Give a practical interpretation of the interval you found in part d.
5.129 Scanning errors at Wal-Mart. Refer to the National Institute for Standards and Technology (NIST) study of the accuracy of checkout scanners at Wal-Mart stores in California, presented in Exercise 3.56 (p. 139). NIST sets standards so that no more than 2 of every 100 items scanned through an electronic checkout scanner can have an inaccurate price. Recall that in a sample of 60 Wal-Mart stores, 52 violated the NIST scanner accuracy standard. Suppose you want to estimate the true proportion of Wal-Mart stores in California that violate the NIST standard.
Explain why the large-sample methodology of Section 5.4 is inappropriate for this study.
Determine the number of Wal-Mart stores that must be sampled in order to estimate the true proportion to within .05 with 90% confidence, using the large-sample method.
- SPRINT 5.130 Speed training in football. Refer to The Sport Journal (Winter 2004) study on the effectiveness of a speed-training program for football players, Exercise 5.26 (p. 264). The decreases in 40-yard sprint times (time after training minus time before training) for 38 players are saved in the SPRINT file. An athlete’s sprint performance will be classified as “Improved” if the “after” time is less than the “before” time, and classified as “Not Improved” if otherwise.
Find an estimate for the true proportion of all high school athletes who attain improved sprint times after participating in the speed-training program.
Convert the estimate, part a, into a 95% confidence interval. Give a practical interpretation of the result.
How many high school athletes should be sampled to estimate the true proportion to within .03 with 95% confidence?
5.131 Assessing the bending strength of a wooden roof. The white wood material used for the roof of an ancient Japanese temple is imported from Northern Europe. The wooden roof must withstand as much as 100 centimeters of snow in the winter. Architects at Tohoku University (in Japan) conducted a study to estimate the mean bending strength of the white wood roof (Journal of the International Association for Shell and Spatial Structures, Aug. 2004). A sample of 25 pieces of the imported wood was tested and yielded the following statistics on breaking strength (in MPa):
Estimate the true mean breaking strength of the white wood with a 90% confidence interval. Interpret the result.
Suppose you want to estimate the true mean breaking strength of the white wood to within 4 MPa, using a 90% confidence interval. How many pieces of the imported wood need to be tested?
5.132 Water pollution testing. The EPA wants to test a randomly selected sample of n water specimens and estimate the mean daily rate of pollution produced by a mining operation. If the EPA wants a 95% confidence interval estimate with a sampling error of 1 milligram per liter (mg/L), how many water specimens are required in the sample? Assume that prior knowledge indicates that pollution readings in water samples taken during a day are approximately normally distributed with a standard deviation equal to 5 (mg/L).
- LICHEN 5.133 Radioactive lichen. Refer to the Lichen Radionuclide Baseline Research project at the University of Alaska, presented in Exercise 2.196 (p. 108). Recall that the researchers collected 9 lichen specimens and measured the amount (in microcuries per milliliter) of the radioactive element cesium-137 for each. (The natural logarithms of the data values are saved in the LICHEN file.) A MINITAB printout with summary statistics for the actual data is shown below.

Give a point estimate for the mean amount of cesium in lichen specimens collected in Alaska.
Give the t-value used in a small-sample 95% confidence interval for the true mean amount of cesium in Alaskan lichen specimens.
Use the result you obtained in part b and the values of and s shown on the MINITAB printout to form a 95% confidence interval for the true mean amount of cesium in Alaskan lichen specimens.
Check the interval you found in part c with the 95% confidence interval shown on the MINITAB printout.
Give a practical interpretation for the interval you obtained in part c.
Suppose the researchers want to increase the sample size in order to estimate the mean to within .001 microcurie per milliliter of its true value, using a 95% confidence interval. Compute the sample size necessary to obtain the desired estimate.
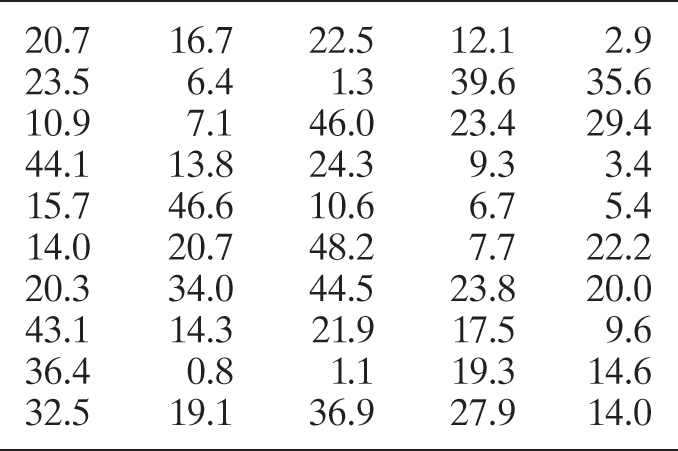
- ATT 5.134 Attention time given to twins. Psychologists have found that twins, in their early years, tend to have lower IQs and pick up language more slowly than nontwins (Wisconsin Twin Research Newsletter, Winter 2004). The slower intellectual growth of most twins may be caused by benign parental neglect. Suppose it is desired to estimate the mean attention time given to twins per week by their parents. A sample of 50 sets of -year-old twin boys is taken, and at the end of 1 week, the attention time given to each pair is recorded. The data (in hours) are listed in the following table. Find a 90% confidence interval for the mean attention time given to all twin boys by their parents. Interpret the confidence interval.
Alternate View
20.7 16.7 22.5 12.1 2.9 23.5 6.4 1.3 39.6 35.6 10.9 7.1 46.0 23.4 29.4 44.1 13.8 24.3 9.3 3.4 15.7 46.6 10.6 6.7 5.4 14.0 20.7 48.2 7.7 22.2 20.3 34.0 44.5 23.8 20.0 43.1 14.3 21.9 17.5 9.6 36.4 0.8 1.1 19.3 14.6 32.5 19.1 36.9 27.9 14.0 - DECAY 5.135 Oven cooking study. A group of Harvard University School of Public Health researchers studied the impact of cooking on the size of indoor air particles (Environmental Science & Technology, Sept. 1, 2000). The decay rate (measured in ) for fine particles produced from oven cooking or toasting was recorded on six randomly selected days. The data is provided in the table.

Alternate View
.95 .83 1.20 .89 1.45 1.12 Based on Abt, E., et al. “Relative contribution of outdoor and indoor particle sources to indoor concentrations.” Environmental Science & Technology, Vol. 34, No. 17, Sept. 1, 2000 (Table 3).
a. Find and interpret a 95% confidence interval for the true average decay rate of fine particles produced from oven cooking or toasting.
b. Explain what the phrase “95% confident” implies in the interpretation of part a.
*c. Estimate the true standard deviation of decay rate with a 95% confidence interval. Interpret the result.
d. What must be true about the distribution of the population of decay rates for the inferences you made in parts a and c to be valid?
e. Suppose that we want to estimate the average decay rate of fine particles produced from oven cooking or toasting to within .04 with 95% confidence. How large a sample should be selected?
5.136 Scary-movie study. According to a University of Michigan study, many adults have experienced lingering “fright” effects from a scary movie or TV show they saw as a teenager. In a survey of 150 college students, 39 said they still experience “residual anxiety” from a scary TV show or movie.
Give a point estimate for the true proportion of college students who experience “residual anxiety” from a scary TV show or movie.
Find a 95% confidence interval for p.
Interpret the interval you found in part b.
Applying the Concepts—Intermediate
5.137 Brown-bag lunches at work. In a study reported in The Wall Street Journal, the Tupperware Corporation surveyed 1,007 U.S. workers. Of the people surveyed, 665 indicated that they take their lunch to work with them. Of these 665 taking their lunch, 200 reported that they take it in brown bags.
Find a 95% confidence interval estimate of the population proportion of U.S. workers who take their lunch to work with them. Interpret the interval.
Consider the population of U.S. workers who take their lunch to work with them. Find a 95% confidence interval estimate of the population proportion who take brown-bag lunches. Interpret the interval.
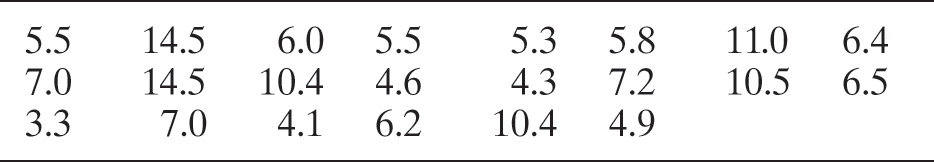
- BRAIN 5.138 Research on brain specimens. In Exercise 2.45 (p. 52), you learned that the The postmortem interval (PMI) is the elapsed time between death and the performance of an autopsy on the cadaver. Brain and Language (June 1995) reported on the PMIs of 22 randomly selected human brain specimens obtained at autopsy. The data are reproduced in the following table. A coroner claims that the true mean PMI of human brain specimens obtained at autopsy is 10 days. Do you agree? Use a 95% confidence interval to make an inference.
Alternate View
5.5 14.5 6.0 5.5 5.3 5.8 11.0 6.4 7.0 14.5 10.4 4.6 4.3 7.2 10.5 6.5 3.3 7.0 4.1 6.2 10.4 4.9 Based on Hayes, T. L., and Lewis, D. A. “Anatomical specialization of the anterior motor speech area: Hemispheric differences in magnopyramidal neurons,” Brain and Language, Vol. 49, No. 3, p. 292 (Table 1).
5.139 Inbreeding of tropical wasps. Tropical swarm-founding wasps rely on female workers to raise their offspring. One possible explanation for this strange behavior is inbreeding, which increases relatedness among the wasps, presumably making it easier for the workers to pick out their closest relatives as propagators of their own genetic material. To test this theory, 197 swarm-founding wasps were captured in Venezuela, frozen at and then subjected to a series of genetic tests. The data were used to generate an inbreeding coefficient x for each wasp specimen, with the following results: and
Construct a 99% confidence interval for the mean inbreeding coefficient of this species of wasp.
A coefficient of 0 implies that the wasp has no tendency to inbreed. Use the confidence interval you constructed in part a to make an inference about the tendency for this species of wasp to inbreed.
5.140 Exercise workout dropouts. Researchers at the University of Florida’s Department of Exercise and Sport Sciences conducted a study of variety in exercise workouts (Journal of Sport Behavior, 2001). A sample of 120 men and women were randomly divided into three groups, with 40 people per group. Group 1 members varied their exercise routine in workouts, group 2 members performed the same exercise at each workout, and group 3 members had no set schedule or regulations for their workouts.
By the end of the study, 15 people had dropped out of the first exercise group. Estimate the dropout rate for exercisers who vary their routine in workouts. Use a 90% confidence interval and interpret the result.
By the end of the study, 23 people had dropped out of the third exercise group. Estimate the dropout rate for exercisers who have no set schedule for their workouts. Use a 90% confidence interval and interpret the result.
5.141 USGA golf ball tests. The United States Golf Association (USGA) tests all new brands of golf balls to ensure that they meet USGA specifications. One test conducted is intended to measure the average distance traveled when the ball is hit by a machine called “Iron Byron.” Suppose the USGA wishes to estimate the mean distance for a new brand to within 1 yard with 90% confidence. Assume that past tests have indicated that the standard deviation of the distances Iron Byron hits golf balls is approximately 10 yards. How many golf balls should be hit by Iron Byron to achieve the desired accuracy in estimating the mean?
- ALZ 5.142 Studies on treating Alzheimer’s disease. Alzheimer’s disease is a progressive disease of the brain. The journal eCAM (Nov. 2006) published an article that critiqued the quality of the methodology used in studies on Alzheimer’s treatment. For each in a sample of 13 studies, the quality of the methodology was measured on the Wong scale, with scores ranging from 9 (low quality) to 27 (high quality). The data are shown in the table below.
Estimate, with a 99% confidence interval, the mean quality of all studies on the treatment of Alzheimer’s disease. Interpret the result.
According to the researchers, a study with a Wong score below 18 used a methodology that “fails to support the author’s conclusions” about the treatment of Alzheimer’s. Use Wilson’s adjustment to estimate the proportion of all studies on the treatment of Alzheimer’s disease with a Wong score below 18. Construct a 99% confidence interval around the estimate and interpret the result.

Alternate View
22 21 18 19 20 15 19 20 15 20 17 20 21 Based on Chiappelli, F., et al. “Evidence-based research in complementary and alternative medicine III: Treatment of patients with Alzheimer’s disease.” eCAM, Vol. 3, No. 4, Nov. 2006 (Table 1).
5.143 Asthma drug study. The chemical benzalkonium chloride (BAC) is an antibacterial agent that is added to some asthma medications to prevent contamination. However, adding BAC to asthma drugs can cause airway constriction in patients. In a sample of 18 asthmatic patients, each of whom received a heavy dose of BAC, 10 experienced a significant drop in breathing capacity (Journal of Allergy and Clinical Immunology, Jan. 2001). Based on this information, a 95% confidence interval for the true percentage of asthmatic patients who experience breathing difficulties after taking BAC is (.326, .785).
Why might the confidence interval lead to an erroneous inference?
How many asthma patients must be included in the study in order to estimate the true percentage who experience a significant drop in breathing capacity to within 4% with a 95% confidence interval?
5.144 Training zoo animals. Refer to Exercise 2.193 (p. 108) andConsider the Teaching of Psychology (May 1998) study in which students assisted in the training of zoo animals. A sample of 15 psychology students rated “The Training Game” as a “great” method of understanding the animal’s perspective during training on a 7–1 point scale (where and ). The mean response was 5.87, with a standard deviation of 1.51.
Construct a 95% confidence interval for the true mean response of the students.
Suppose you want to reduce the width of the 95% confidence interval to half the size obtained in part a. How many students are required in the sample in order to obtain the desired confidence interval width?
5.145 Salmonella in ice cream bars. Recently, a case of salmonella (bacterial) poisoning was traced to a particular brand of ice cream bar, and the manufacturer removed the bars from the market. Despite this response, many consumers refused to purchase any brand of ice cream bars for some time after the event (McClave, personal correspondence). One manufacturer conducted a survey of consumers 6 months after the poisoning. A sample of 244 ice cream bar consumers was contacted, and 23 indicated that they would not purchase ice cream bars because of the potential for food poisoning.
What is the point estimate of the true fraction of the entire market who refuse to purchase bars 6 months after the poisoning?
Is the sample size large enough to use the normal approximation for the sampling distribution of the estimator of the binomial probability? Justify your response.
Construct a 95% confidence interval for the true proportion of the market who still refuse to purchase ice cream bars 6 months after the event.
Interpret both the point estimate and confidence interval in terms of this application.
5.146 Salmonella in ice cream bars (cont’d). Refer to Exercise 5.145. Suppose it is now 1 year after the poisoning was traced to ice cream bars. The manufacturer wishes to estimate the proportion who still will not purchase bars to within .02, using a 95% confidence interval. How many consumers should be sampled?
5.147 Latex allergy in health care workers. Refer to the Current Allergy & Clinical Immunology (Mar. 2004) study of health care workers who use latex gloves, presented in Exercise 5.15 (p. 262). In addition to the 46 hospital employees who were diagnosed with a latex allergy on the basis of a skin-prick test, another 37 health care workers were diagnosed with the allergy by means of a latex-specific serum test. Of these 83 workers with a confirmed latex allergy, only 36 suspected that they had the allergy when they were asked about it on a questionnaire. Make a statement about the likelihood that a health care worker with a latex allergy suspects that he or she actually has the allergy. Attach a measure of reliability to your inference.
*5.148 Jitter in a water power system. Jitter is a term used to describe the variation in conduction time of a water power system. Low throughput jitter is critical to successful waterline technology. An investigation of throughput jitter in the opening switch of a prototype system (Journal of Applied Physics) yielded the following descriptive statistics on conduction time for trials: nanoseconds, nanoseconds. (Conduction time is defined as the length of time required for the downstream current to equal 10% of the upstream current.)
Construct a 95% confidence interval for the true standard deviation of conduction times of the prototype system.
Practically interpret the confidence interval, part a.
A system is considered to have low throughput jitter if the true conduction time standard deviation is less than 7 nanoseconds. Does the prototype system satisfy this requirement? Explain.
Applying the Concepts—Advanced
5.149 IMA salary survey. Each year, Management Accounting reports the results of a salary survey of the members of the Institute of Management Accountants (IMA). One year, the 2,112 members responding had a salary distribution with a 20th percentile of $35,100, a median of $50,000, and an 80th percentile of $73,000.
Use this information to determine the minimum sample size that could be used in next year’s survey to estimate the mean salary of IMA members to within $2,000 with 98% confidence. [Hint: To estimate s, first apply Chebyshev’s theorem to find k such that at least 60% of the data fall within k standard deviations of Then find (80th percentile −20th percentile)/2k.]
Explain how you estimated the standard deviation required for the calculation of the sample size.
List any assumptions you make.
5.150 Air bags pose danger for children. By law, all new cars must be equipped with both driver-side and passenger-side safety air bags. There is concern, however, over whether air bags pose a danger for children sitting on the passenger side. In a National Highway Traffic Safety Administration (NHTSA) study of 55 people killed by the explosive force of air bags, 35 were children seated on the front-passenger side. This study led some car owners with the information about children to disconnect the passenger-side air bag.
Use the study to estimate the risk of an air bag fatality on a child seated on the front passenger seat.
NHTSA investigators determined that 24 of the 35 children killed by the air bags were not wearing seat belts or were improperly restrained. How does this information affect your assessment of the risk of an air bag fatality?
Critical Thinking Challenge
- SCALLOPS 5.151 Scallops, sampling, and the law. Interfaces (Mar.–Apr. 1995) discussed the case of a ship that fishes for scallops off the coast of New England. In order to protect baby scallops from being harvested, the U.S. Fisheries and Wildlife Service requires that “the average meat per scallop weigh at least of a pound.” The ship was accused of violating this weight standard. Author Arnold Barnett lays out the scenario:
The vessel arrived at a Massachusetts port with 11,000 bags of scallops, from which the harbormaster randomly selected 18 bags for weighing. From each such bag, his agents took a large scoopful of scallops; then, to estimate the bag’s average meat per scallop, they divided the total weight of meat in the scoopful by the number of scallops it contained. Based on the 18 [numbers] thus generated, the harbormaster estimated that each of the ship’s scallops possessed an average of a pound of meat (that is, they were about seven percent lighter than the minimum requirement). Viewing this outcome as conclusive evidence that the weight standard had been violated, federal authorities at once confiscated 95 percent of the catch (which they then sold at auction). The fishing voyage was thus transformed into a financial catastrophe for its participants.
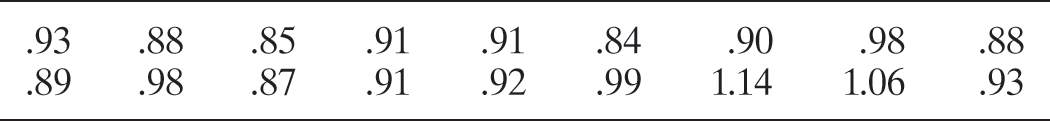
The actual scallop weight measurements for each of the 18 sampled bags are listed in the next table and saved in the SCALLOPS file. For ease of exposition, Bennett expressed each number as a multiple of of a pound, the minimum permissible average weight per scallop. Consequently, numbers below 1 indicate individual bags that do not meet the standard.
The ship’s owner filed a lawsuit against the federal government, declaring that his vessel had fully complied with the weight standard. A Boston law firm was hired to represent the owner in legal proceedings, and Bennett was retained by the firm to provide statistical litigation support and, if necessary, expert witness testimony.
Recall that the harbormaster sampled only 18 of the ship’s 11,000 bags of scallops. One of the questions the lawyers asked Bennett was “Can a reliable estimate of the mean weight of all the scallops be obtained from a sample of size 18?” Give your opinion on this issue.
As stated in the article, the government’s decision rule is to confiscate a catch if the sample mean weight of the scallops is less than of a pound. Do you see any flaws in this rule?
Develop your own procedure for determining whether a ship is in violation of the minimum-weight restriction. Apply your rule to the data. Draw a conclusion about the ship in question.
Alternate View
.93 .88 .85 .91 .91 .84 .90 .98 .88 .89 .98 .87 .91 .92 .99 1.14 1.06 .93 Based on Barnett, A. “Misapplications review: Jail terms.” Interfaces, Vol. 25, No. 2, Mar.–Apr. 1995, p. 20.
5.152 A sampling dispute goes to court. Sampling of Medicare and Medicaid claims by the federal and state agencies who administer those programs has become common practice to determine whether providers of those services are submitting valid claims. (See the Statistics in Action for this chapter.) The reliability of inferences based on those samples depends on the methodology used to collect the sample of claims. Consider estimating the true proportion, p, of the population of claims that are invalid. (Invalid claims should not have been reimbursed by the agency.) Of course, to estimate a binomial parameter, p, within a given level of precision, we use the formula provided in Section 5.5 to determine the necessary sample size. In a recent actual case, the statistician determined a sample size large enough to ensure that the bound on the error of the estimate would not exceed .05, using a 95% confidence interval. He did so by assuming that the true error rate was , which, as discussed in Section 5.5, provides the maximum sample size needed to achieve the desired bound on the error.
Determine the sample size necessary to estimate p to within .05 of the true value using a 95% confidence interval.
After the sample was selected and the sampled claims were audited, it was determined that the estimated error rate was and a 95% confidence interval for p was (.15, .25). Was the desired bound on the error of the estimate met?
An economist hired by the Medicare provider noted that, since the desired bound on the error of .05 is equal to 25% of the estimated invalid claim rate, the “true” bound on the error was .25, not .05. He argued that a significantly larger sample would be necessary to meet the “relative error” (the bound on the error divided by the error rate) goal of .05, that the statistician’s use of the “absolute error” of .05 was inappropriate, and that more sampling was required. The statistician argued that the relative error is a moving target because it depends on the sample estimate of the invalid claim rate, which cannot be known prior to selecting the sample. He noted that if the estimated invalid claim rate turned out to be larger than .5, the relative error would then be lower than the absolute error bound. As a consequence, the case went to trial over the relative versus absolute error dispute. Give your opinion on the matter.
[Note: The court concluded that “absolute error was the fair and accurate measure of the margin of error.” As a result, a specified absolute bound on the error continues to be the accepted method for determining the sample size necessary to provide a reliable estimate of Medicare and Medicaid providers’ claim submission error rates.]
References
-
Agresti, A., and Coull, B. A. “Approximate is better than ‘exact’ for interval estimation of binomial proportions.” The American Statistician, Vol. 52, No. 2, May 1998, pp. 119–126.
-
Cochran, W. G. Sampling Techniques, 3rd ed. New York: Wiley, 1977.
-
Freedman, D., Pisani, R., and Purves, R. Statistics. New York: Norton, 1978.
-
Kish, L. Survey Sampling. New York: Wiley, 1965.
-
Mendenhall, W., Beaver, R. J., and Beaver, B. Introduction to Probability and Statistics, 13th ed. Belmont, CA: Brooks/Cole, 2009.
-
Wilson, E. G. “Probable inference, the law of succession, and statistical inference.” Journal of the American Statistical Association, Vol. 22, 1927, pp. 209–212.