Chapter 3
Manage security operations
The main goal of security operations is to maintain and restore the security assurances of the systems as adversaries attack them. The National Institute of Standards and Technology (NIST) describes the tasks of security operations in their Cybersecurity Framework, which are Detect, Respond, and Recover. To be able to execute those functions in a cloud environment, you not only need the correct approach, but you also need to understand how the native tools work to provide you the data you need to limit the time and access an attacker can get to valuable systems and data.
Azure has native capabilities that you can leverage to continuously monitor your environment's security operations, allowing you to quickly identify potential threats to your workloads.
Skills in this chapter:
Skill 3.1: Configure centralized policy management
While security monitoring is critical for any organization that wants to continue improving its security posture, governance is foundational for any organization that wants to establish deployment standards and ensure that security is applied at the beginning of the deployment pipeline. This section of the chapter covers the skills necessary to configure centralized policy management according to the Exam AZ-500 outline.
Configure a custom security policy
It’s well-known in all areas of IT (enterprise, small business, and even start-ups) that policy-based management streamlines and increases the effectiveness of IT operations. This is especially true in security, where the combination of technologies and processes becomes a potent weapon. In fact, it’s recognized by many that if the right policies are in place, and those policies are carried out assiduously, then even less than optimal technology can be effective at protecting the organization.
Azure Policy allows you to create, assign, and manage a variety of policy definitions. Policy definitions can be compared with your current configuration, and any resources that do not meet the requirements of your policy can then be determined to be “out of compliance.” You can then focus on the out-of-compliance assets and bring them into compliance.
A “policy assignment” is a policy definition that has been assigned to take place within a specific “scope.” For example, a scope might range from an Azure management group to a resource group. A management group enables you to manage access, policy, costs, and compliance across subscriptions. The term “scope” refers to all the resource groups, subscriptions, or management groups to which the policy definition is assigned. Policy assignments are inherited by all child resources.
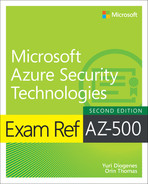
An “initiative definition” is a collection of policy definitions tailored toward achieving a singular overarching goal. Initiative definitions simplify the management and assignment of policy definitions. They simplify policy definition assignments by grouping a set of policies into a single initiative definition. Figure 3-1 shows these components:
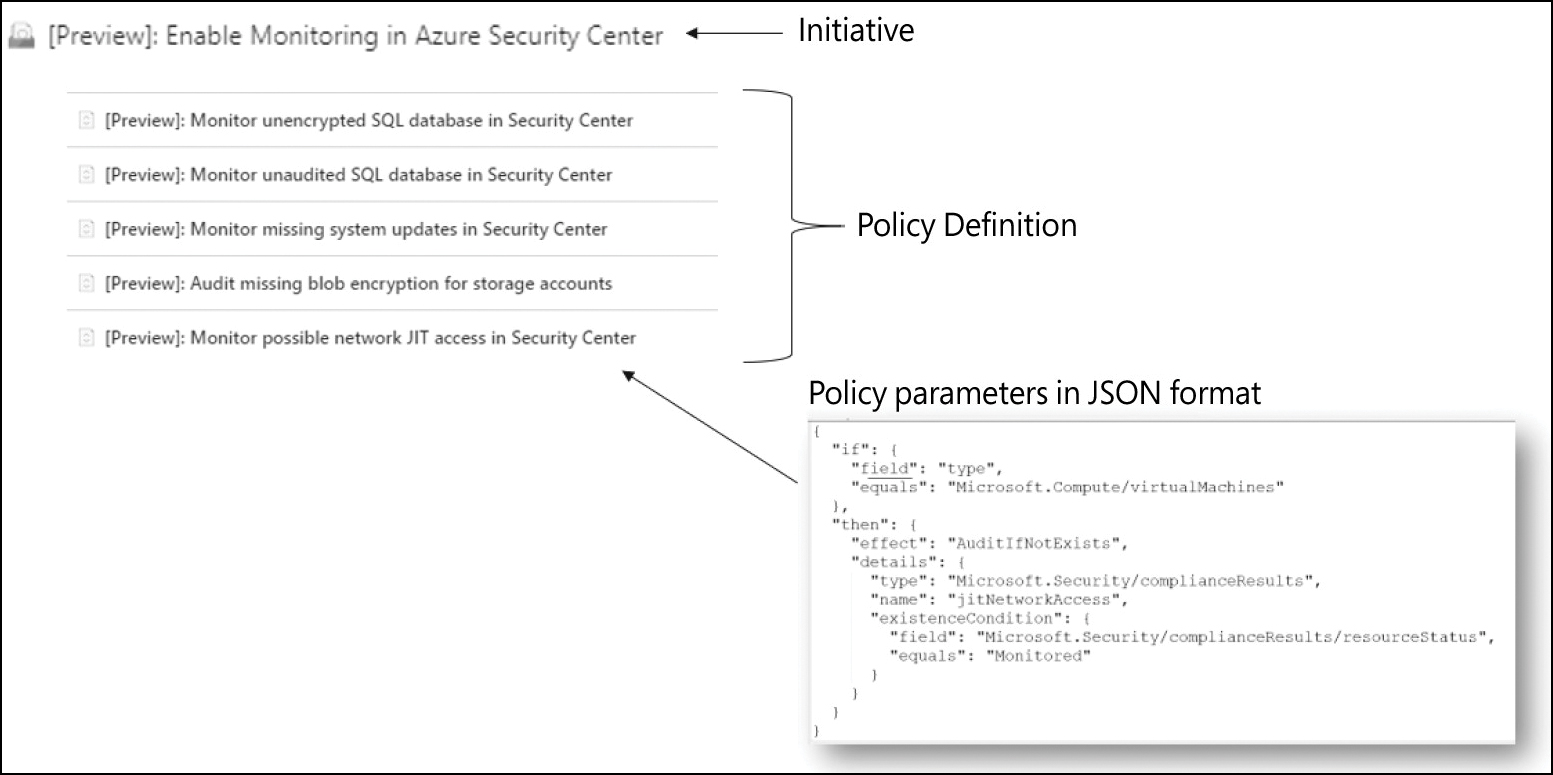
FIGURE 3-1 Azure Policy components
If you need to create a new custom security policy, you can leverage Microsoft Defender for Cloud or Azure Policy to do that. From a terminology perspective, if you use Microsoft Defender for Cloud, you always refer to a custom security policy. However, if you use the Azure Policy dashboard, you refer to a custom policy. When you use Microsoft Defender for Cloud to create a custom policy, you are creating a custom initiative that will be reflected in Microsoft Defender for Cloud as a recommendation.
Create a policy initiative
Using the built-in policy initiative in your Microsoft Defender for Cloud deployment has several advantages. The most obvious advantage is that you don’t need to care about enabling recommendations because they will automatically apply to every subscription you enroll in Microsoft Defender for Cloud. Though it is less obvious, it is important to point out that the built-in policy definitions and the initiative definition are both maintained by Microsoft. In other words, if there are changes to the resource providers used within these policy definitions, or if new definitions are created, these changes will be automatically incorporated into the built-in initiative definition. However, there are cases when you want to have custom policies in your environment, either because you want to tailor the existing policy or because you want to add more assessments to your environment.
To add a custom policy initiative to Microsoft Defender for Cloud, follow these steps:
Open the Azure portal and sign in with an account that has Security Admin privileges.
In the left navigation pane, select Microsoft Defender For Cloud.
In Microsoft Defender for Cloud left navigation pane, click Environment settings.
Select the subscription that you want to change the policy, and in the left navigation click Security Policy.
Click Add A Custom Initiative. The Add Custom Initiatives blade appears, as shown in Figure 3-2.
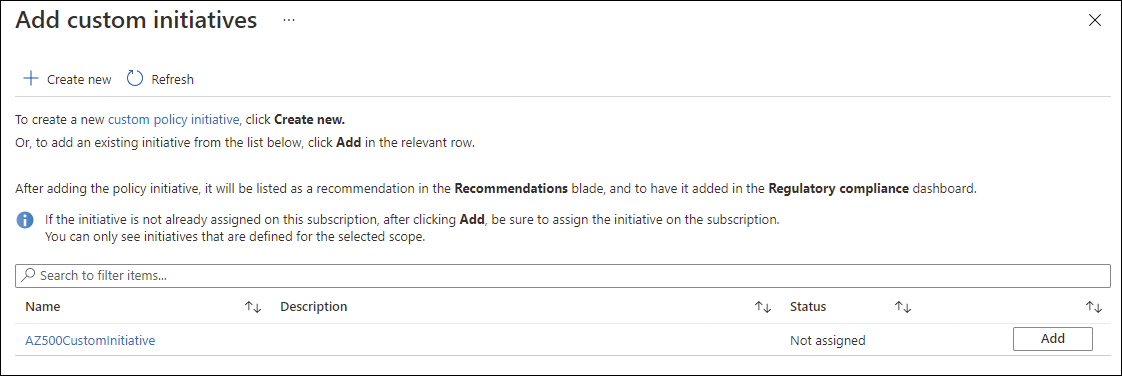
FIGURE 3-2 Add a custom policy initiative to Microsoft Defender for Cloud
You can either click Add to assign an existing custom initiative or click + Create New to build a new custom initiative definition from scratch and assign it to your subscription.
You can add a combination of custom and built-in policy definitions to your custom initiative. Once you’ve created it, click Save > Add to assign it to your subscription.
When assigning the custom initiative from Microsoft Defender for Cloud, you can assign it to a subscription, a particular resource group within that subscription, or both. (Remember, you can only assign the built-in default initiative on management groups and subscriptions.) Also, you can define an exclusion for either a resource group or a particular resource so the policies won’t apply to the excluded scope. See Figure 3-3.
The policies with your custom initiative will be grouped under the new security control Custom Recommendation in the Microsoft Defender for Cloud Recommendations dashboard, as shown in Figure 3-4.
FIGURE 3-3 Assign a custom policy definition with scope and exclusions
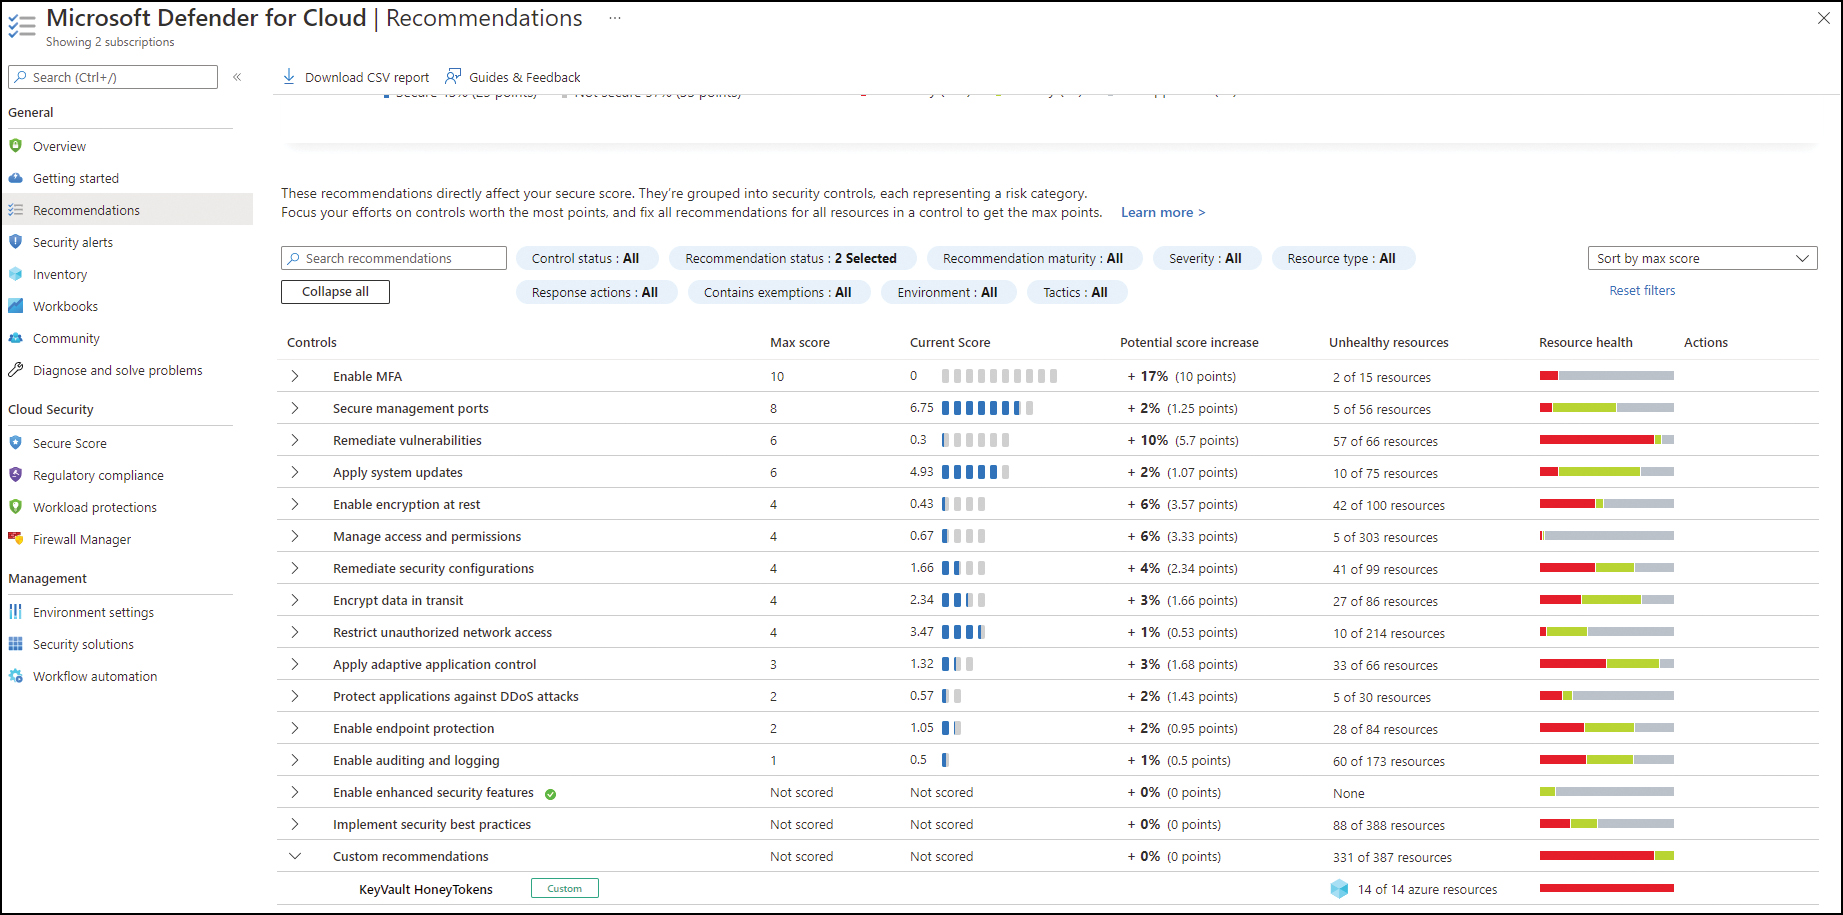
FIGURE 3-4 Custom recommendations based on a custom policy initiative
As mentioned before, you can use custom, built-in policy definitions (or both) within your custom initiative definition. If you choose to use built-in policies, they still are maintained by Microsoft, whereas custom policy definitions are not automatically updated. So, if you are using custom policies in a custom initiative, you need to establish a process that helps you to keep track of backend changes related to the policies’ intent and to update your custom policies accordingly.
Configure security settings and auditing by using Azure Policy
A policy definition can have different effects on the scope it is assigned to. The append mode is used to add additional fields to a resource when it is created or updated. For example, you can use append to add a list of allowed IP addresses to a storage resource. A policy definition in audit mode will report resources that are non-compliant regarding the settings within your definition. For example, if you have an internal agreement that organizational resources are only deployed to Azure regions within Europe, you can use an audit policy to report resources that are deployed in a US region. A similar effect is auditifnotexists, which will report resources that do not have a particular configuration or setting. For example, you would use auditifnotexists mode if you want to see resources that do not have a particular tag configured.
If you configure a definition in deployifnotexists (DINE) mode, once you deploy a resource, a particular setting or configuration will be automatically remediated if it has not already been defined when configuring the resource to be deployed. For example, to ensure that the Azure Monitoring Agent is installed on all VMs that are created within your Azure environment, you can use a DINE policy.
A definition that is configured in deny mode will prevent the deployment of resources that are noncompliant regarding a particular setting. In the first example with the Azure regions, you can use a deny policy to not only audit but to prevent the deployment of resources to a US region. Finally, there is the modify mode that is used to add, update, or remove properties or tags on a resource when it is created or updated. This effect is commonly used to update tags on resources. Also, modify mode allows you to remediate existing resources using remediation tasks. In addition to the effects mentioned previously, the following effects are currently supported in a policy definition:
Append Adds additional fields to the requested resource during creation or update. For example, you could use this effect if you want to specifify a list of allowed IPs during the storage creation.
Disabled This effect is useful for testing scenarios where the policy definition has parameterized the effect.
Modify Adds, updates, or removes properties or tags on a subscription or resource during creation or update.
The first step to achieving governance in Azure is to ensure that you are leveraging Azure Policy for policy enforcement. You can also enforce data residency and sovereignty using Azure Policy. For example, use Azure Policy if you need to enforce all new resources to be created to use a specific region. As mentioned earlier in this chapter, from the centralized management perspective, it’s always recommended that you assign a policy to a management group and move the subscriptions that you want to inherit that policy to that management group.
Many built-in roles grant permission to Azure Policy resources. You can use the Resource Policy Contributor role, which includes most Azure Policy operations. The Owner role has full rights to perform all actions, and both Contributor and Reader roles have access to all Azure Policy Read operations. You can use the Contributor role to trigger resource remediation, but you can’t use it to create definitions or assignments.
When you are enforcing policies, you need to ensure that your policy initiative is using the right type of effect. If the scenario’s requirement is that you avoid provisioning certain workloads if certain attributes are not set, your policy effect should be Deny. The Deny attribute is used to prevent a resource request that doesn’t match defined standards through a policy definition and fails the request.
If your scenario’s requirement is to change parameters if they were not set during provision time, then your policy effect should be DeployIfNotExists. For example, if a Contoso administrator wants to deploy Azure Network Watcher when a virtual network is created, the administrator should enforce the DeployIfNotExists effect for that policy. DeployIfNotExists runs about 15 minutes after a resource provider has handled a create or update resource request and has returned a success status code. When you configure a policy with this type of effect, you also create a remediation task. The goal of this remediation task is to configure the resource with the desired parameter.
Updating tags on a resource during creation or update is common. For example, let’s say a Contoso administrator needs to update the cost center for all resources during creation. For this scenario, you need to use the Modify effect. Just like the DeployIfNotExists effect, you also need to configure a remediation task to run the desired change. Keep in mind that when you are creating this remediation task for both effects, you will need to check the Create A Managed Identity option. You can use the identity to authenticate to any service that supports Azure AD authentication—including Key Vault—without any credentials in your code.
Follow the steps below to configure policy enforcement using Azure Policy:
Navigate to the Azure portal at https://portal.azure.com.
In the search bar, type policy, and under Services, click Policy.
On the Policy page, click Assignments under Authoring in the left pane. Figure 3-5 shows an example of the Assignments page.
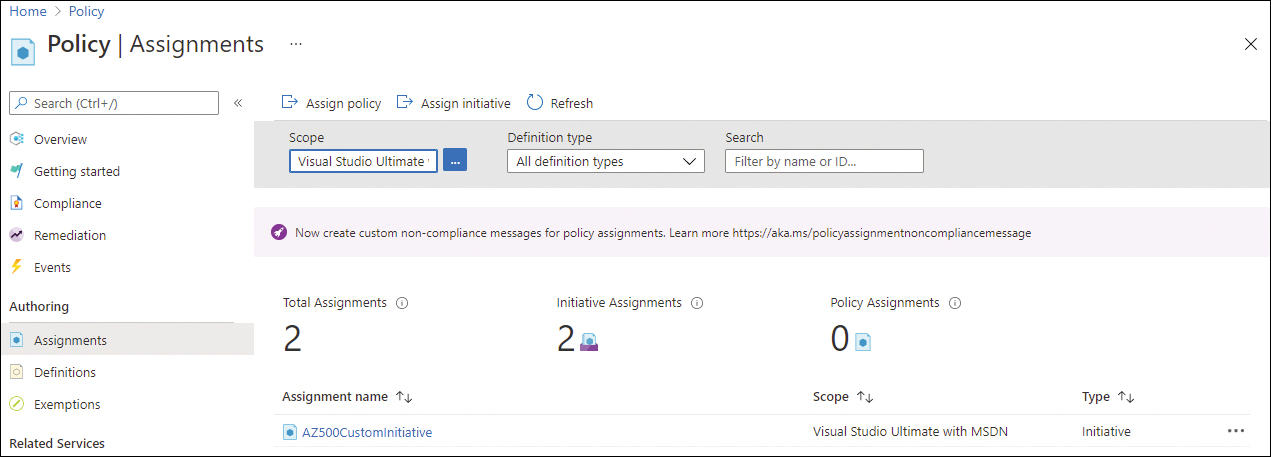
FIGURE 3-5 Policy assignments page
Notice on this page, you can assign an initiative or a policy. For this example, click the Assign Policy button. The Assign Policy page appears (see Figure 3-6).
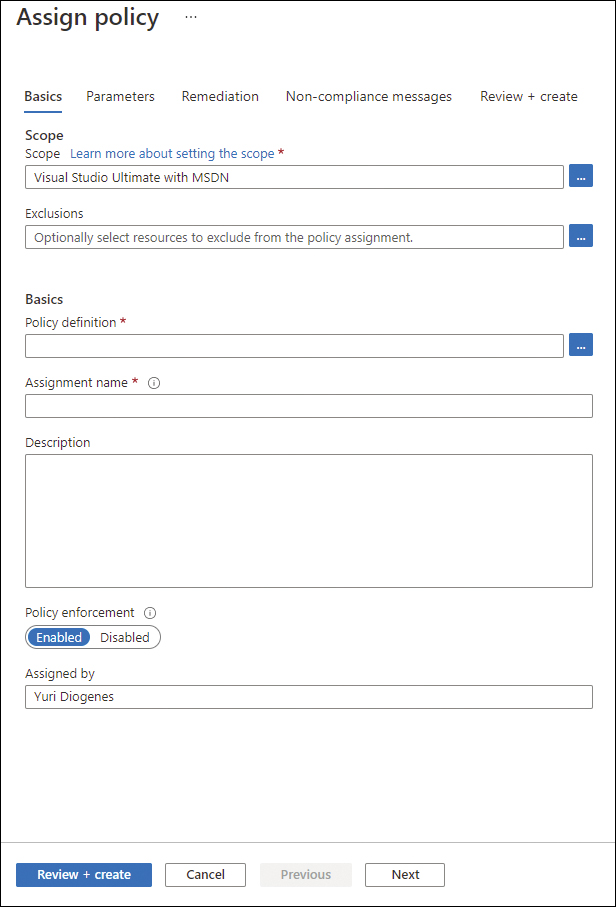
FIGURE 3-6 Selecting the policy to assign
On the Basics tab, you can select the Scope in which this policy should be assigned. If your scenario requires centralized management, you can assign it to a management group. If the scenario requires that you only assign it to the subscription level, then leave the default selection.
In the Exclusion field, you can optionally select resources that you want to exclude from this policy. For example, if you have certain resource groups that should be exempted from this policy, add those resource groups to this list.
In the Policy Definition field, click the ellipsis to open the available policies.
On the Available Definitions blade, a list of all policy definitions is shown. For this example, type SQL in the Search field.
Select the Deploy SQL DB Transparent Data Encryption policy and click the Select button.
Notice that both the Policy Definition and Assignment Name fields have been populated with the name of the policy.
Click the Parameters tab and notice that for this policy, there are no parameters or effects.
Click the Remediation tab to configure the additional options. Figure 3-7 shows the available options.
Click the Create A Remediation Task check box.
The Policy To Remediate drop-down menu will automatically select the policy that needs to be used for remediation.
Notice that the Create A Managed Identity option is automatically selected with the System Assigned Managed Identity option. The Managed Identity Location is also set to East US by default, but you can change it.
Also, in the Permission section under This Identity Will Also Be Given The Following Permissions, the SQL DB Contributor permission is selected by default.
Click the Review + Create button.
Click the Create button.
Now that the policy and the remediation task are created, you have the full extent of policy enforcement. You can monitor the compliance of this policy by using the Overview dashboard in Azure Policy; then, you click the policy to see more details about the assignment. Figure 3-8 shows the Assignment Details dashboard.
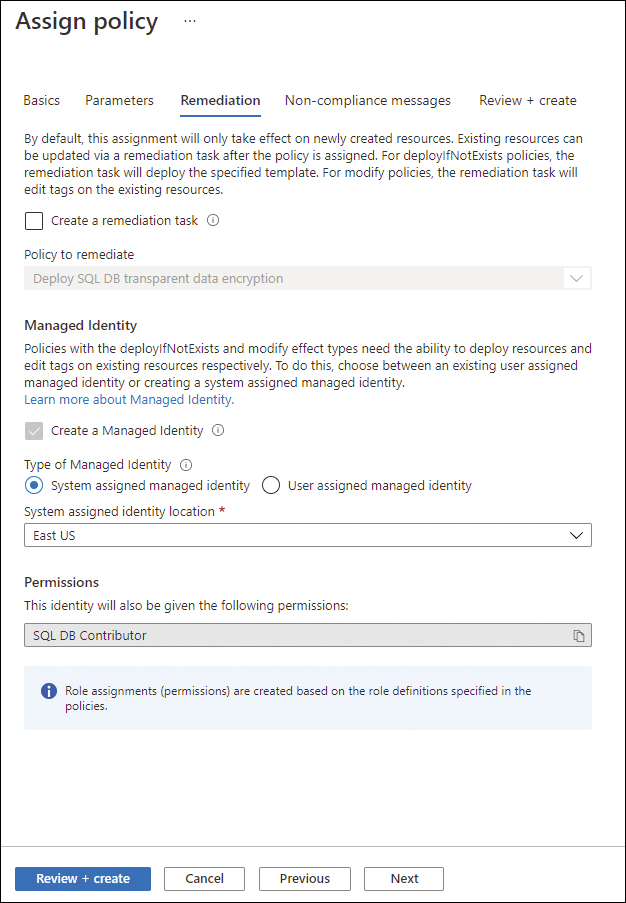
FIGURE 3-7 Configuring remediation tasks
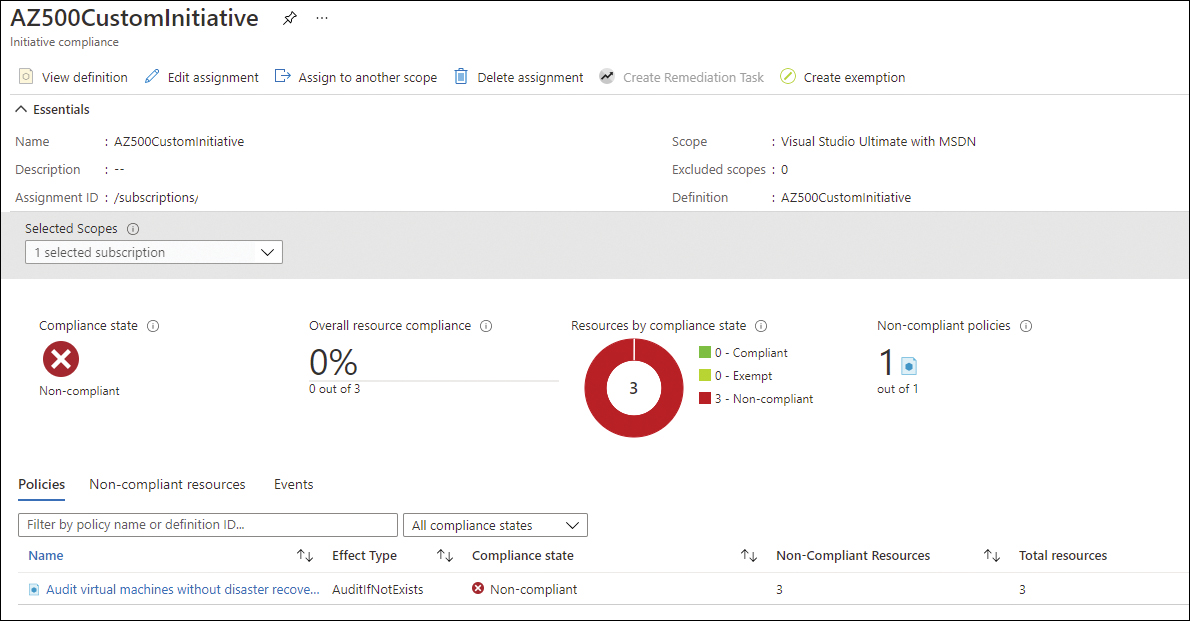
FIGURE 3-8 Assignment Details dashboard
Skill 3.2: Configure and manage threat protection
Threat protection is imperative for organizations that are proactively managing their security posture and need to reactively take actions when threats are identified. However, to quickly identify threats, you need threat detection that has relevant analytics for different types of workloads. This section of the chapter covers the skills necessary to configure and manage threat protection according to the Exam AZ-500 outline.
Microsoft Defender for servers
When you enable Microsoft Defender for Servers, the following features are available automatically:
Threat detections for supported versions of Windows and Linux.
Integration with Microsoft Defender for Endpoint (MDE), which is the Microsoft Endpoint Detection and Response (EDR) solution. In this case, the license is included for Servers only.
File integrity monitoring.
Just-in-time VM access.
Integrated vulnerability assessment with the options to deploy either Qualys or Threat and Vulnerability Management (TVM).
Adaptive application control.
Adaptive network hardening.
Network map.
Regulatory compliance dashboard.
Microsoft Defender for servers uses advanced security analytics and machine-learning technologies to evaluate events across the entire cloud fabric. The security analytics include data from multiple sources, including Microsoft products and services, the Microsoft Digital Crimes Unit (DCU), the Microsoft Security Response Center (MSRC), and external feeds. This is the core of Defender for Servers threat detection, and on top of that, different detection mechanisms are available based on the workload.
Microsoft Defender for Servers applies known patterns to discover malicious behavior, which is called behavioral analysis. It uses statistical profiling to build a historical baseline, which means an alert might be triggered when Defender for Servers detects deviations from established baselines that conform to a potential attack vector. The result will be externalized in the dashboard via a security alert. A security alert contains valuable information about what triggered the alert, the resources targeted, the source of the attack, and suggestions to remediate the threat. Alerts generated by Microsoft Defender for servers are also called Virtual Machine Behavioral Analysis (VMBA). This type of alert uses behavioral analytics to identify compromised resources based on an analysis of the virtual machine (VM) event logs, such as process-creation events, in memory only (fileless attack), and log-in events. While these examples are related to Microsoft Defender for servers, other Microsoft Defender plans might use different methods to identify suspicious activity (and trigger an alert).
Microsoft Defender for servers also identifies suspicious activity in the network layer by collecting security information from your Azure Internet Protocol Flow Information Export (IPFIX) traffic and analyzes it to identify threats. The Suspicious Incoming RDP Network Activity from Multiple Sources alert is an example of an alert that belongs to this category. Microsoft Defender for servers has different threat detections for Windows and Linux, as shown in the following sections.
Windows
Microsoft Defender for servers detection in Windows looks at many events, and once it finds something suspicious, it triggers an alert. For example, if you execute the command below in a VM monitored by Microsoft Defender for servers, it will be considered a suspicious activity:
powershell -nop -exec bypass -EncodedCommand "cABvAHcAZQByAHMAaABlAGwAbAAgAC0AYwBvAG0AbQ
BhAG4AZAAgACIAJgAgAHsAIABpAHcAcgAgAGgAdAB0AHAAcwA6AC8ALwBkAG8AdwBuAGwAbwBhAGQALgBzAHkAcw
BpAG4AdABlAHIAbgBhAGwAcwAuAGMAbwBtAC8AZgBpAGwAZQBzAC8AUwB5AHMAbQBvAG4ALgB6AGkAcAAgAC0ATw
B1AHQARgBpAGwAZQAgAGMAOgBcAHQAZQBtAHAAXABzAHYAYwBoAG8AcwB0AC4AZQB4AGUAIAB9ACIA"
PowerShell is a very powerful tool; the Mitre attack’s techniques page at https://attack.mitre.org/techniques/T1086/ shows that PowerShell has been used in many attack campaigns. When Microsoft Defender for servers detects the PowerShell execution with the encoding command, it raises an alert for what the user is trying to hide. In this case, the command above is trying to download the sysmon.zip file from the SysInternals website and save it in the C: emp folder with the svhost.exe name:
powershell -command "& { iwr https://download.sysinternals.com/files/Sysmon.zip -OutFile
c:	empsvchost.exe }"
PowerShell encoding to download malware from command-and-control is a common malicious pattern, so Microsoft Defender for servers will raise an alert.
Linux
When Linux Detections was first released, there was a dependency in the AuditD to be installed in the Linux operating system. While AuditD provides a significant amount of info that can be used to detect threats, not all Linux distros will have AuditD installed by default. For this reason, the latest change in behavior for Linux Detections was to bake-in the necessary elements that will collect relevant data in the agent (Log Analytics Agent) itself.
Accessing security alerts
The number of security alerts you see in the Security Alerts dashboard might vary depending on the number of resources you are monitoring with Defender for Servers and the business itself. Some organizations receive more attacks than others, and as a result, have more security alerts. If you don’t have any security alerts in your environment, you can simulate an alert using the procedure below:
Open Azure portal and sign in with a user who has Security Admin privileges.
In the left navigation pane, click Microsoft Defender For Cloud.
In the Microsoft Defender for Cloud left navigation pane under General, click the Security Alerts option.
In the top-right corner, click the Create Sample Alerts option; the Create Sample Alerts (Preview) blade appears, as shown in Figure 3-9.
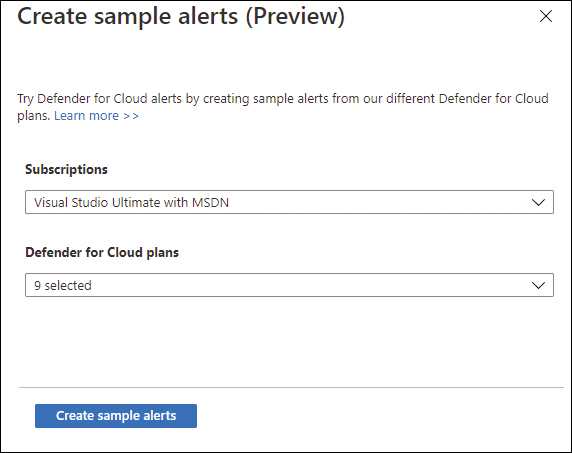
FIGURE 3-9 Creating a sample alert
In the Subscriptions drop-down menu, select the subscription for which you want to generate the sample alert.
Click the Defender For Cloud plans drop-down menu, click Select All to uncheck all plans, and select only Virtual Machines.
Click the Create Sample Alerts button to generate the sample alerts.
After a few minutes, you will see that six sample alerts will appear in the Security Alert dashboard, as shown in Figure 3-10.
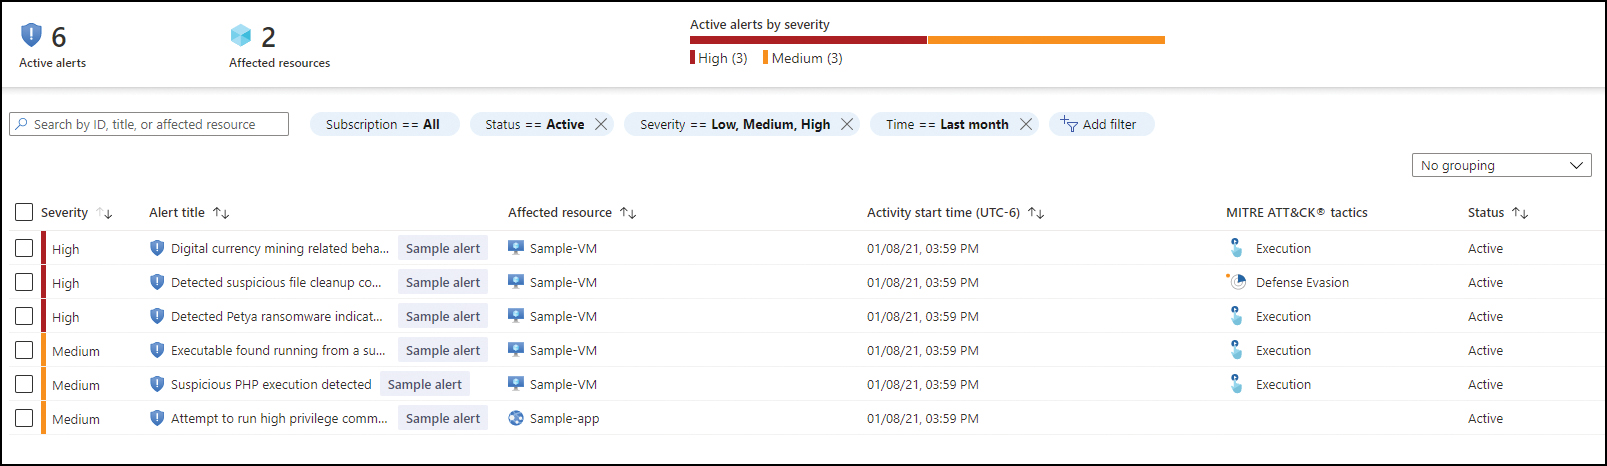
FIGURE 3-10 Security Alert dashboard with the sample alerts for VMs
By default, the Security Alert dashboard presents the alerts indexed by severity, but you can use the filtering options to change the severities that you want to see. You can also filter by:
Subscription If you have multiple subscriptions selected, you can customize which subscriptions you want to see alerts from.
Status By default, only Active is selected. You can change it to also see alerts that were dismissed.
Time Allows you to configure the timeline of the alerts that you can see—up to the three last months.
Add Filter Allows you to add more filters that are not visible by default.
In addition to the filters, you can also use the search box to search for alert ID, alert title, or affected resource. Clicking the desired alert opens the Alert Details page, as shown in Figure 3-11.
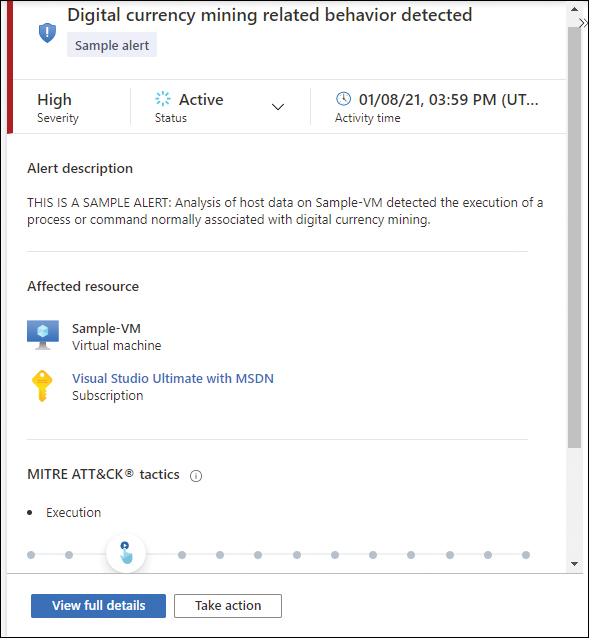
FIGURE 3-11 Alert details page
This initial page allows you to review the alert’s details and change the status from Active to Dismissed. Also, a graphical representation of where the alerts fit into the Mitre ATT&CK Tactics framework is shown.
After reviewing the alert’s details, you can obtain more granular information by accessing the alert’s full page. To do that, click the View Full Details button, and the full alert page appears, as shown in Figure 3-12.
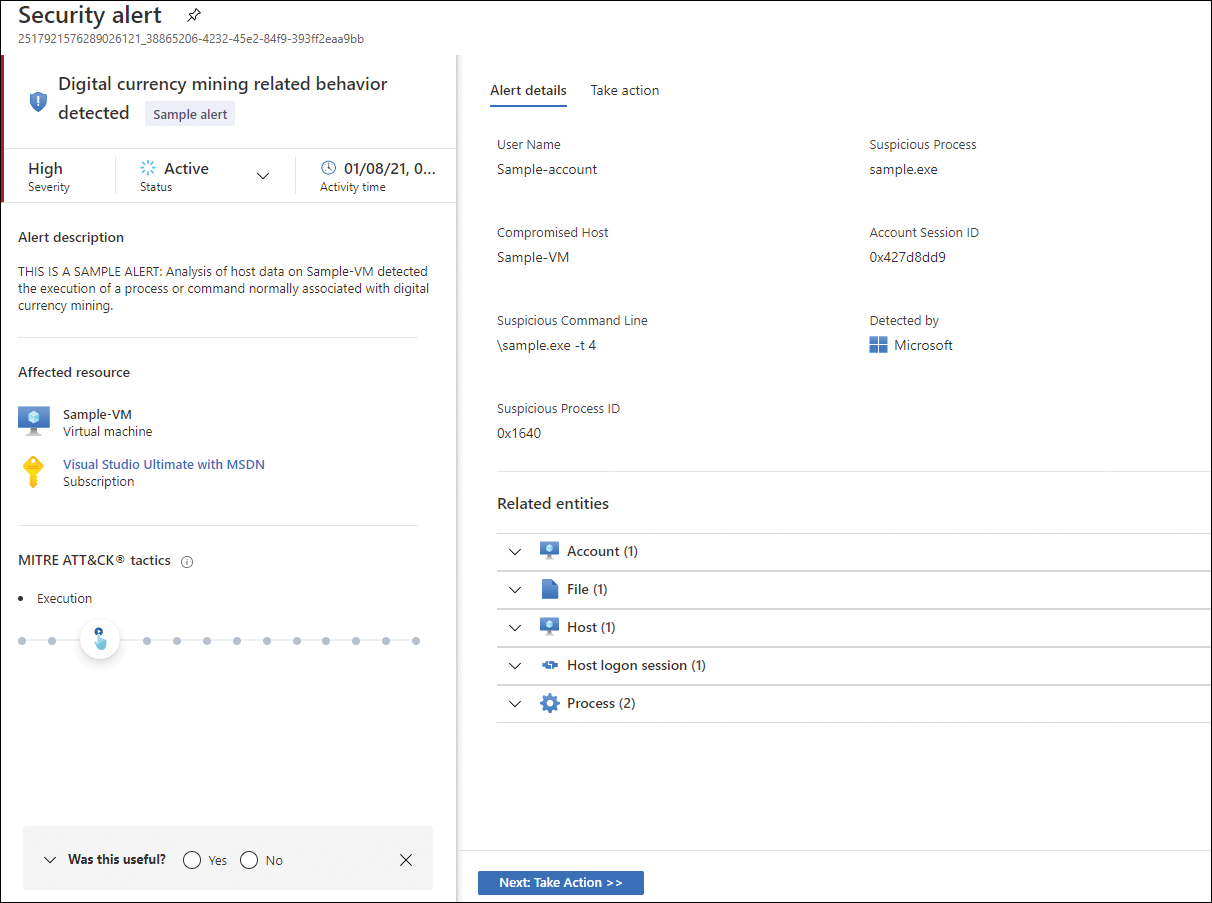
FIGURE 3-12 Alert details page
The right part of the full alert page shows more relevant detail. At the bottom part of the page is the Related Entities section, which enumerates the relevant entities (Account, File, Host, Host Logon Session, and Process) that were used during this attack. Keep in mind that the related entities will vary according to the alert type and whether those entities were used. Although the example shown in Figure 3-12 is from a sample alert, the fields of this alert type are the same as you would see in a live alert.
Another important option on this page is the Take Action tab, which contains relevant information to mitigate the highlighted threat in this alert, the recommendations that could be remediated to prevent future attacks, the option to trigger a Logic App automation, and the option to create a suppression rule. Figure 3-13 shows an example of this tab’s content.
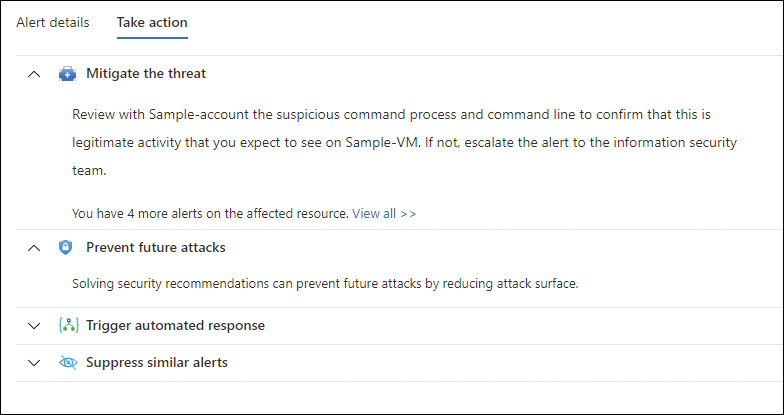
FIGURE 3-13 Take Action tab with the available options for an alert
Evaluate vulnerability scan from Microsoft Defender for servers
Vulnerability assessment is a key component of any security posture management strategy. Microsoft Defender for servers provides a built-in vulnerability assessment capability for your Azure VMs based on Qualys, an industry-lead vulnerability management solution. Also, it allows you to leverage Threat and Vulnerability Management (TVM), which is the native solution for Microsoft Defender for Endpoint (MDE). If you don’t have Microsoft Defender for servers enabled and you are only using Microsoft Defender for Cloud, you will still receive a recommendation for installing the vulnerability assessment on your machine. However, this recommendation (which does not suggest the built-in vulnerability assessment) requires you to have a Qualys or Rapid7 license.
When you enable Microsoft Defender for servers in your subscription, the VMs that don’t have a vulnerability assessment solution installed will be identified. Also, a security recommendation will appear, suggesting the built-in vulnerability assessment solution should be installed. This recommendation is similar to the example shown in Figure 3-14.
To install this vulnerability assessment solution, you need Write permissions on the VM to which you are deploying the extension. Assuming that you have the necessary privilege level, you will be able to select the VM from the list shown on the Unhealthy Resources tab and click the Remediate button. This recommendation has the Quick-Fix capability, which means you can trigger the extension installation directly from this dashboard. Like any extension in Azure, the Qualys extension runs on top of the Azure Virtual Machine agent, which means it runs as Local Host on Windows systems and as Root in Linux systems.
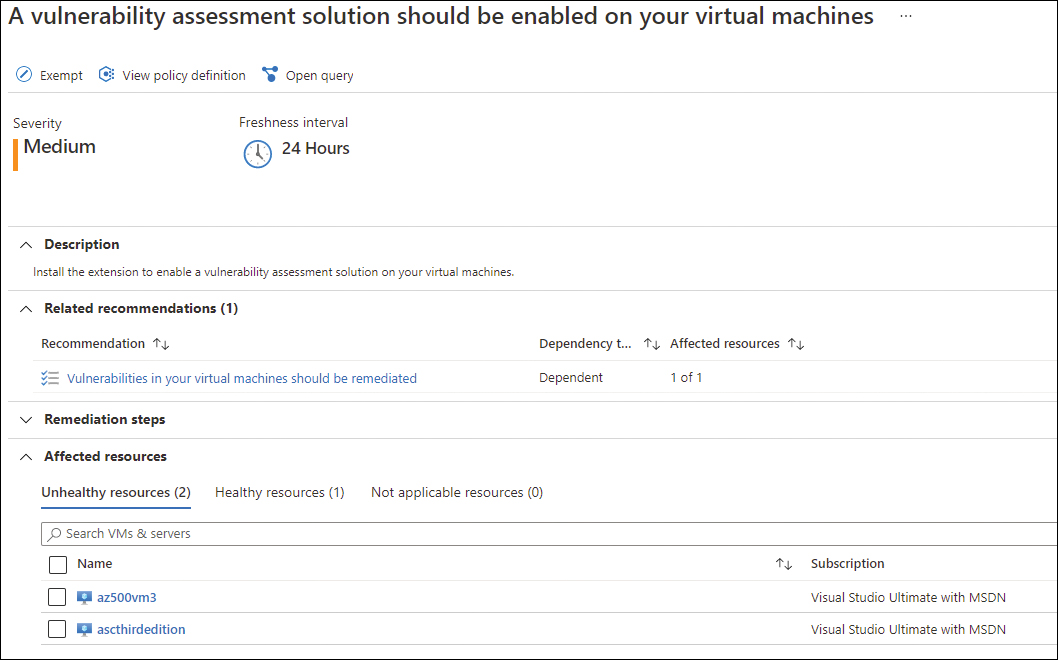
FIGURE 3-14 Recommendation to install the built-in vulnerability assessment solution
The VMs that already have the agent installed will be listed under the Healthy Resources tab. When Microsoft Defender for Cloud cannot deploy the vulnerability scanner extension to the VMs, it will list those VMs on the Not Applicable Resources tab. VMs might appear on this tab if they are part of a subscription using the Free pricing tier or if the VM image is missing the ImageReference class (which is used on custom images and VMs restored from backup). Another reason for a VM to be listed on this tab is if the VM is not running one of the supported operating systems:
Microsoft Windows (all versions)
Red Hat Enterprise Linux (versions 5.4+, 6, and 7.0 through 7.7, 8)
Red Hat CentOS (versions 5.4+, 6, and 7.0 through 7.7)
Red Hat Fedora (versions 22 through 25)
SUSE Linux Enterprise Server (versions 11, 12, and 15)
SUSE OpenSUSE (versions 12 and 13)
SUSE Leap (version 42.1)
Oracle Enterprise Linux (versions 5.11, 6, and 7.0 through 7.5)
Debian (versions 7.x through 9.x)
Ubuntu (versions 12.04 LTS, 14.04 LTS, 15.x, 16.04 LTS, and 18.04 LTS)
If you are deploying this built-in vulnerability assessment on a server that has restricted access to the Internet, it is important to know that during the setup process, a connectivity check is done to ensure that the VM can communicate with Qualys’s cloud service on the following two IP addresses: 64.39.104.113 and 154.59.121.74.
Once the extension is installed in the target VM, the agent will perform the vulnerability assessment of the VM through a scan process. The scan result will be surfaced in another security recommendation, which is called Vulnerabilities In Your Virtual Machines Should Be Remediated. A sample of this recommendation is shown in Figure 3-15.
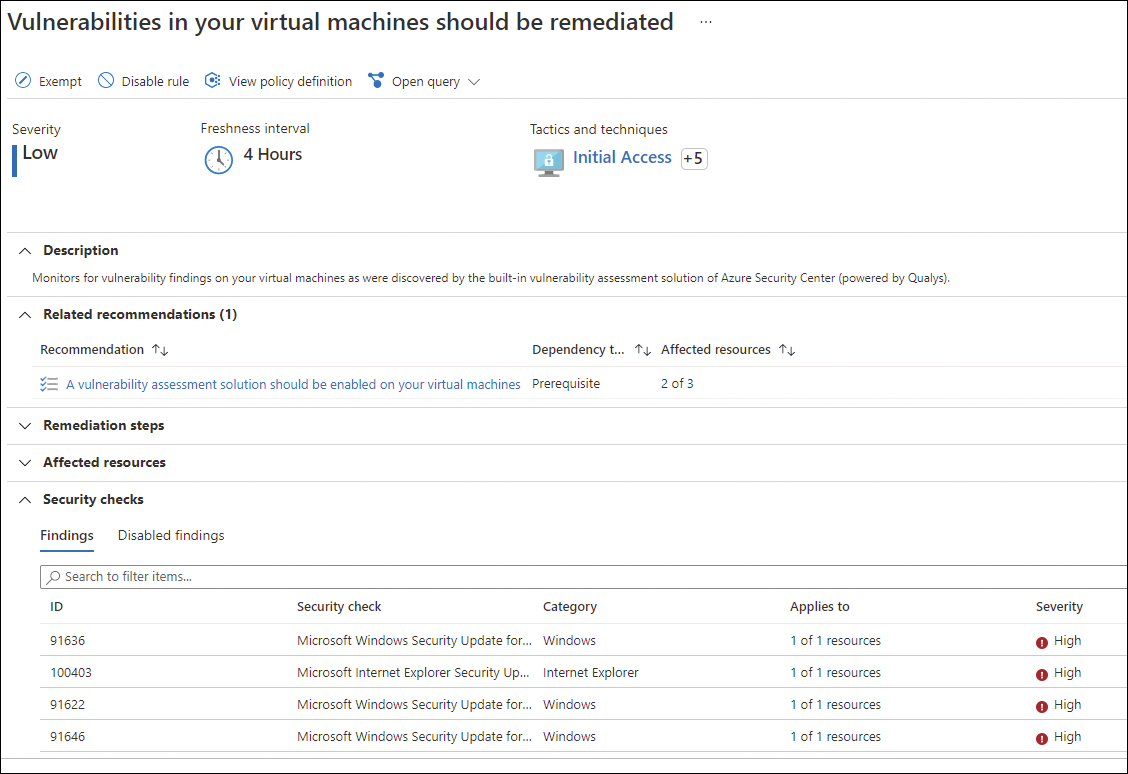
FIGURE 3-15 List of vulnerabilities found during the scan
On this page, you can see the list of findings in the Security Checks section. If you click a specific security check, Microsoft Defender for Cloud will show another blade with the details of that vulnerability, which include the Impact; Common Vulnerabilities; Exposure (CVE) (located under the General Information section); the Description of the type of threat; the Remediation steps; Additional References for this security check; and the list of Affected Resources. See Figure 3-16.
The deployment of these recommended remediations is done out-of-band; in other words, you will deploy them outside Microsoft Defender for Cloud. For example, suppose a security check requires you to install a security update on your target computer. In that case, you will need to deploy that security update using another product, such as Update Management. Some other remediations will be more about security best practices. For example, security check 105098 (Users Without Password Expiration) recommends that you create a password policy with an expiration date. This is usually deployed using Group Policy in Active Directory.
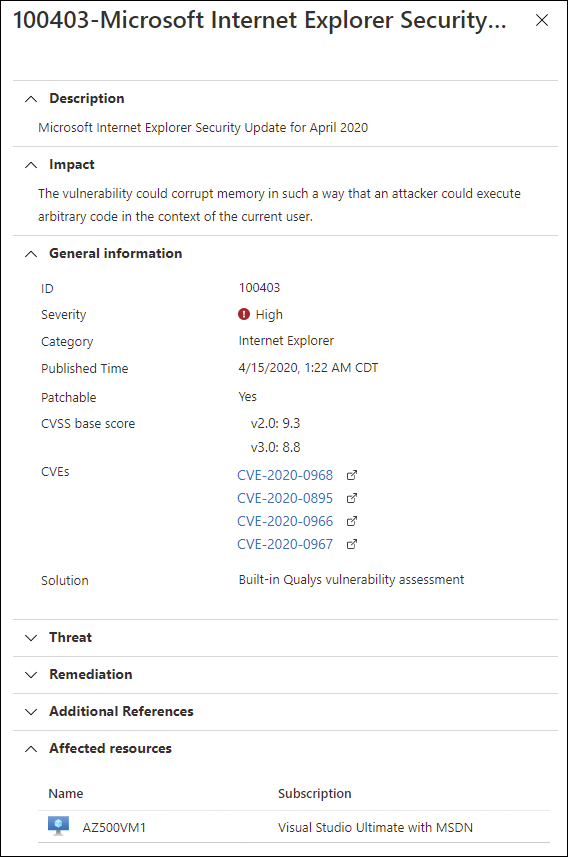
FIGURE 3-16 Vulnerability details blade
Vulnerability scanning for SQL
Assessing the vulnerability of SQL servers is also natively available in Microsoft Defender for Cloud as part of Microsoft Defender for SQL.
When you enable Microsoft Defender for SQL, you will have threat protection for Azure SQL Database, which detects anomalous activities that indicate unusual and potentially harmful attempts to access or exploit databases. For example, this feature could generate an alert about a possible vulnerability to SQL Injection attacks. Usually, there are two possible reasons for a faulty statement: A defect in application code might have constructed the faulty SQL statement, or the application code or stored procedures didn’t sanitize the user input.
When Microsoft Defender for Cloud identifies databases that don’t have this feature enabled, it will trigger a security recommendation, as shown in Figure 3-17.
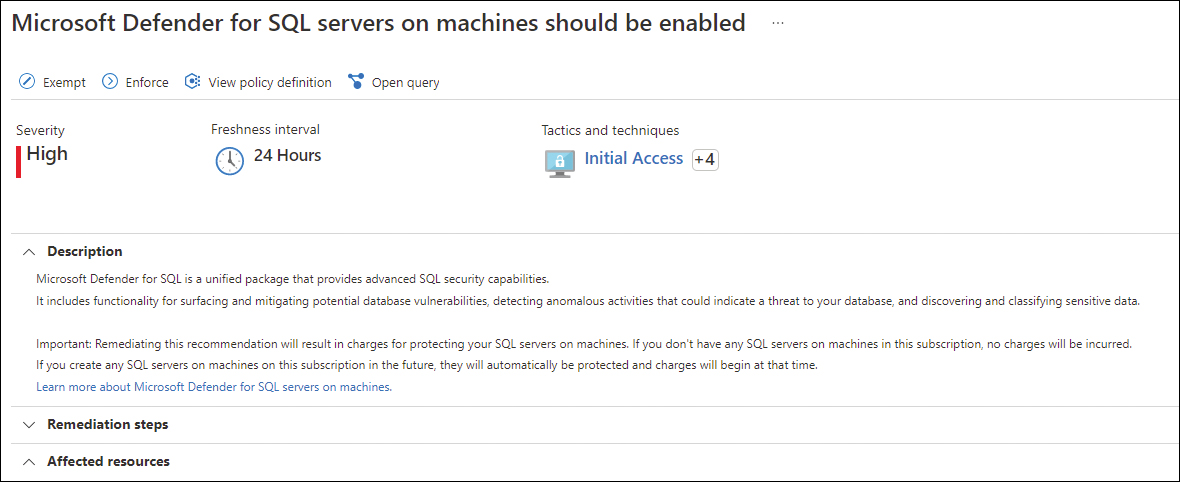
FIGURE 3-17 Security recommendation to enable Defender for SQL
After this feature is enabled, Microsoft Defender for Cloud also indicates that you need to enable the vulnerability assessment for your SQL servers (see Figure 3-18).
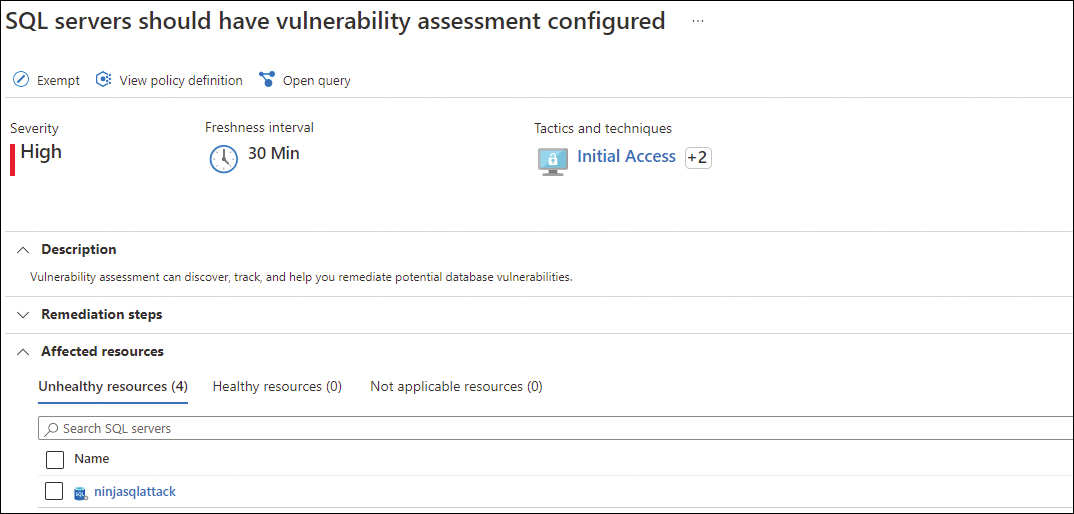
FIGURE 3-18 Security recommendation to enable vulnerability assessment in SQL
Configure Microsoft Defender for SQL
Microsoft Defender for SQL is a protection plan that helps you mitigate potential database vulnerabilities and detect anomalous activities that can indicate threats to your databases. Defender for SQL has evolved over the years and currently has two major plans:
Microsoft Defender for Azure SQL database servers, which includes Azure SQL Database, Azure SQL Managed Instance, and Dedicated SQL Pool in Azure Synapse.
Microsoft Defender for SQL Servers on Machines, which includes SQL Server running on VMs in Azure, on-premises, or in another cloud provider. Microsoft Defender for SQL provides threat detection for anomalous activities indicating unusual and potentially harmful attempts to access or exploit databases. Figure 3-19 shows an example of an alert triggered by this plan.
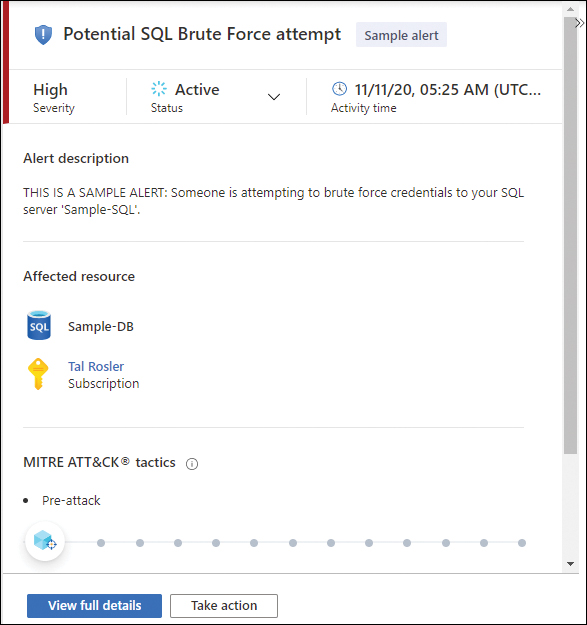
FIGURE 3-19 Sample alert for Defender for SQL
The Microsoft Defender for Azure SQL database servers can be easily enabled on the subscription level on any Azure SQL database that you want; no agent is required. However, to use Microsoft Defender for SQL Servers on Machines, you need to enable the plan at the subscription level, and you must onboard the server, which means provisioning the Log Analytics Agent on SQL Server. If your VMs are in Azure, you just need to use the auto-provisioning option in Microsoft Defender for Cloud to automatically onboard the Log Analytics Agent to your Azure VMs.
Another scenario is the integration with Azure Arc, which allows a deeper integration across different scenarios. It is recommended to use Azure Arc for your SQL Servers on-premises or in different cloud providers (AWS and GCP), and once they are fully on board, you can deploy the Log Analytics Agent. In summary, follow the sequence below to fully onboard:
Enable Azure Arc on your machines (follow the steps at http://aka.ms/az500enablearc).
Install the Log Analytics agent on this machine. You can easily identify which machines are missing the agent by reviewing the
Log Analytics agent should be installed on your Windows-based Azure Arc machinesrecommendation in Microsoft Defender for Cloud.Enable the SQL Servers On Machines pricing plan on the Pricing And Settings page of Microsoft Defender for Cloud. The plan will be enabled on all SQL servers and will be fully active after the first restart of the SQL Server instance.
Skill 3.3: Configure and manage security monitoring solutions
Microsoft Sentinel is a Microsoft Security Information and Event Management (SIEM) and Security Orchestration, Automation, and Response (SOAR) solution. You can use this solution to ingest data from different data sources, create custom alerts, monitor incidents, and respond to alerts. This section of the chapter covers the skills necessary to configure and manage security monitoring solutions according to the Exam AZ-500 outline.
Introduction to Azure Monitor
Although an introduction to Azure Monitor is not part of the official AZ-500 outline, it is important to understand Azure Monitor components before diving into more details about alerts.
When it comes to using Azure Monitor, one common question is, “How do I enable it?” Azure Monitor is automatically enabled when you create a new Azure subscription. At that point, activity log and platform metrics are automatically collected. The other common question is, “Can Azure Monitor also monitor resources that are on-premises?“ Although Azure Monitor implies (by the name) that the resources are in Azure, it also collects data to monitor from virtual machines and applications in other clouds and on-premises.
For this reason, before making any sort of configuration in Azure Monitor, it is important to understand some foundational concepts of this platform. The following section covers some key principles.
Reviewing Azure Monitor concepts
The diagram shown in Figure 3-20 helps you better understand the breadth of Azure Monitor and the different areas that it touches.
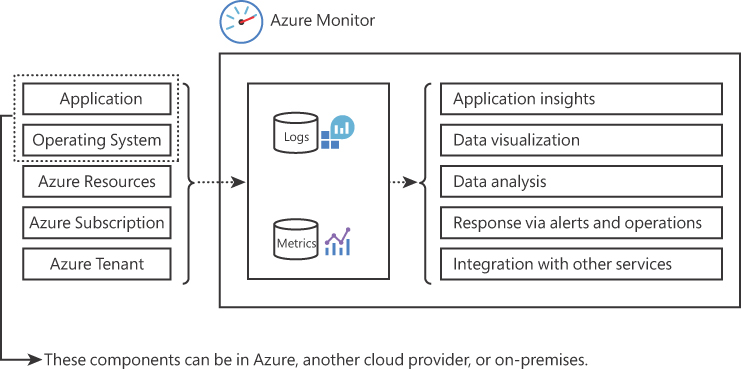
FIGURE 3-20 Architecture diagram of the Azure Monitor solution
On the left side of the diagram shown in Figure 3-20, you have the different layers that represent the components that will generate logs, which can be ingested by Azure Monitor. From the application and operating system perspective, the machine can be physically located on-premises, in Azure, or another cloud provider. Aside from these data sources, you can also ingest data from different Azure resources, subscriptions, and the Azure tenant itself. This data is ingested into the Log Analytics Workspace, which is part of the Azure Monitor solution, and once the data is there, you can query it using Kusto Query Language, which uses schema entities that are organized in a hierarchy similar to SQL’s databases, tables, and columns.
The last three layers that appear on the left side of the diagram shown in Figure 3-20 represent the three major layers in Azure where you can obtain logging information. The definition of each layer is shown here:
Azure Resources Here, you will be able to obtain resource logs, which have operations that were executed in the data plane level of Azure, such as getting a secret from Azure Key Vault. These logs are also referred to as diagnostic logs.
Azure Subscription Here, you will be able to obtain activity logs, which have operations that were executed in the management plane. You should review these logs when you need to determine the answer for the what (what operation was made), who (who made this operation), and when (when this operation was made). For example, if a VM was deleted, you should go to Azure Activity Log to find out the answer of the what, who, and when regarding the deleted VM operation.
Azure Tenant Here, you will be able to obtain the Azure Active Directory logs. In this layer, you have the history of sign-in activity and see an audit trail of changes made in the Azure Active Directory.
It is very important to understand those layers when studying for the AZ-500 exam because you may have scenarios where you will need to select the right option regarding where to look for specific information. For example, if the Contoso administrator wants to identify the user who stopped the virtual machine two weeks ago, where should they search for this information? If you answered Azure Activity Log, you are correct. As mentioned before, in Activity Log, you will find management plane operations and the identification of the what, who, and when an operation was performed.
Metrics are another type of information that can be ingested. Metrics are numerical values that describe some aspect of a system at a particular point in time. Telemetry, such as events and traces, and performance data are stored as logs so that they can all be combined for analysis. This type of information can be used during scenarios where you need to collect security-related performance counters from multiple VMs and create alerts based on certain thresholds.
Because Azure Monitor starts collecting data from a resource upon the creation of that resource, it is important to know where to look when you need information about those resources. Many resources will have a summary of performance data that is relevant for that resource; usually, this summary is located in the Overview page of that resource. For example, in the Overview option of an Azure storage account, you will see insights regarding the average latency, egress data, and requests, as shown in Figure 3-21.
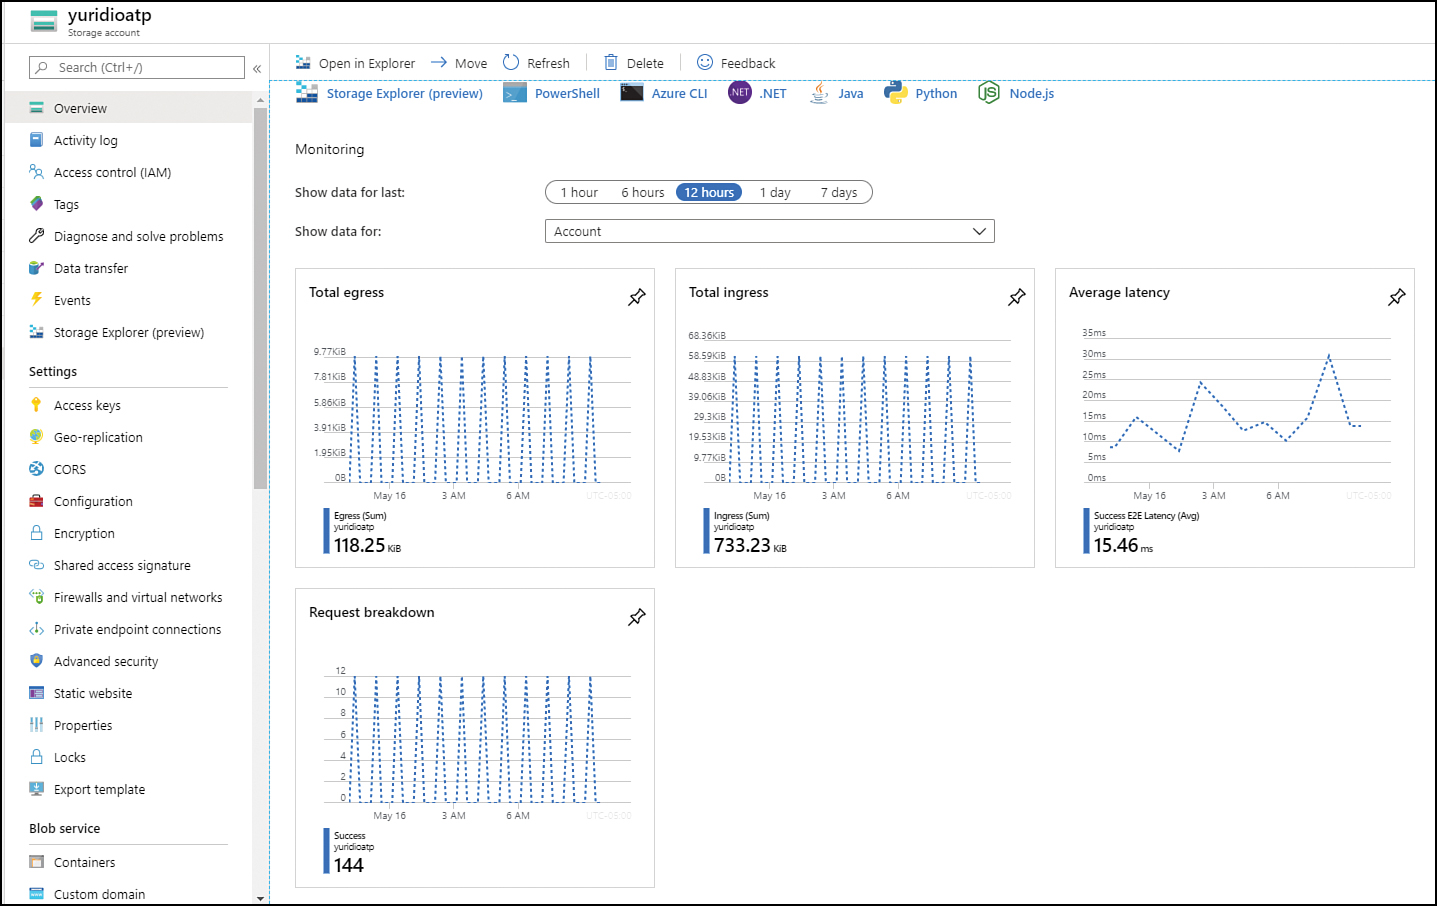
FIGURE 3-21 Summary of storage account performance insights
If you need to query logs that have operations that were executed in the management plane, you should use the Azure Activity Log. To access the Activity Log, follow these steps:
Navigate to the Azure portal at https://portal.azure.com.
In the search bar, type activity, and under Services, click Activity Log. The Activity Log page appears, as shown in Figure 3-22.
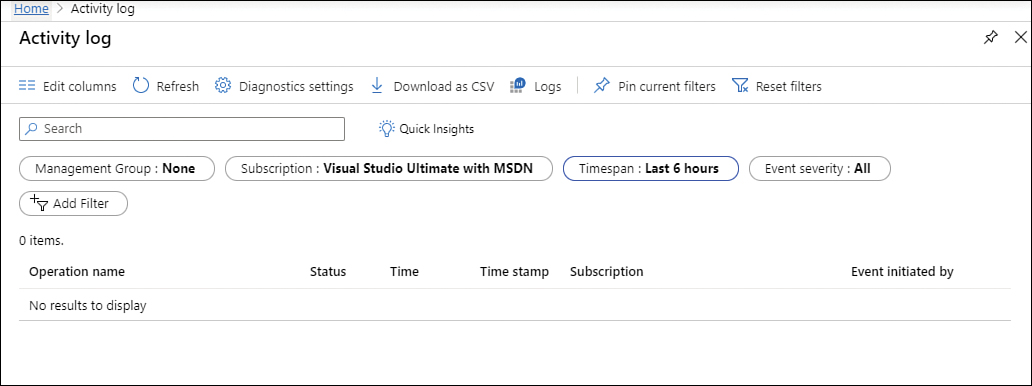
FIGURE 3-22 Activity log initial page
Here, you can use the Timespan filter to adjust the timeline that you want to perform your query. For this example, this filter was changed for the last hour, and after applying the change, the result appears, as shown in Figure 3-23.
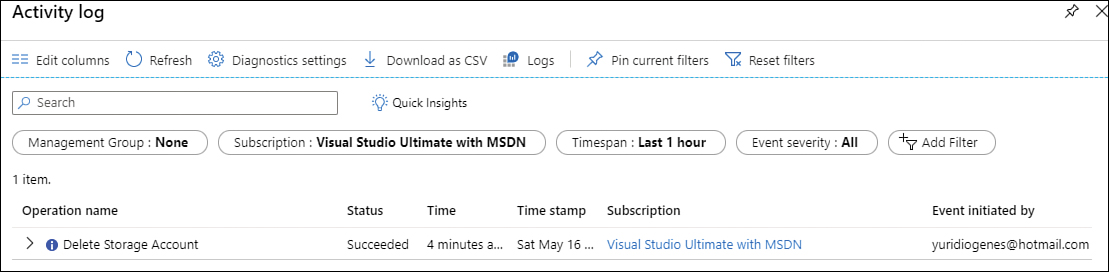
FIGURE 3-23 Activity log results after filtering
The result shows a summary of the operation, including the Status, Time, Time Stamp, Subscription, and Event Initiated By. If you want more detailed information about the operation, you can expand the Operation Name field and click it. There, you can see the details of the operation in the JSON tab.
As mentioned in the previous section, the other type of data that you might want to use is metric. If you are monitoring a virtual machine and you need more metrics beyond the ones that appear in the Overview page, you can go to the Metrics page and from there, customize the metrics that you want to monitor, as shown in Figure 3-24.
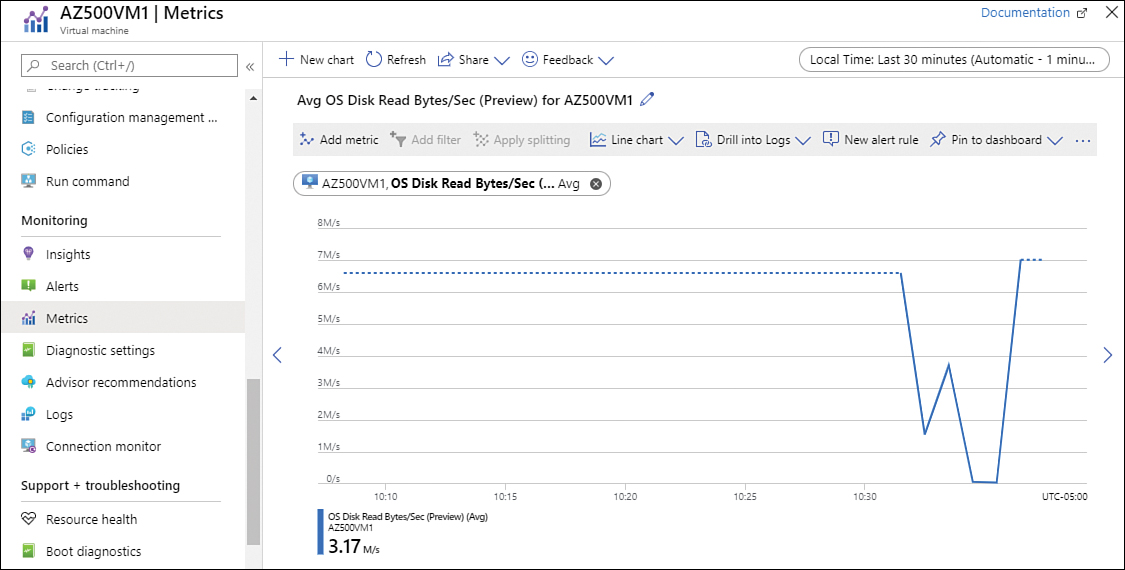
FIGURE 3-24 Visualizing VM metrics
Create and customize alert rules in Azure Monitor
Another important feature in Azure Monitor is the ability to create alerts for different types of events. You can use the following types of data to generate alerts with the data that was collected for the past 30 days (by default):
Metric values
Log search queries
Activity log events
Health of the underlying Azure platform
Tests for website availability
In Figure 3-24, you can see the OS Disk Read Bytes/Sec option right above the New Alert Rule chart. This option allows you to go from this dashboard directly to the Alert dashboard and create an alert rule using the metric that is currently shown on screen: OS Disk Read Bytes/Sec. See Figure 3-25.
The Create Alert Rule page has some important parameters that must be filled, but when you activate this page from the Metrics page (where you already configured the metrics that you want to monitor), the Create Alert Rule page prepopulates the Scope (which is the target resource that you want to monitor) and the Condition (which is the rule logic that will be used to trigger the alert). While the scope has the resource that you want to monitor, the condition might need some adjustments according to your needs. To customize the condition, just click the condition name, and the Configure Signal Logic blade appears, as shown in Figure 3-26.
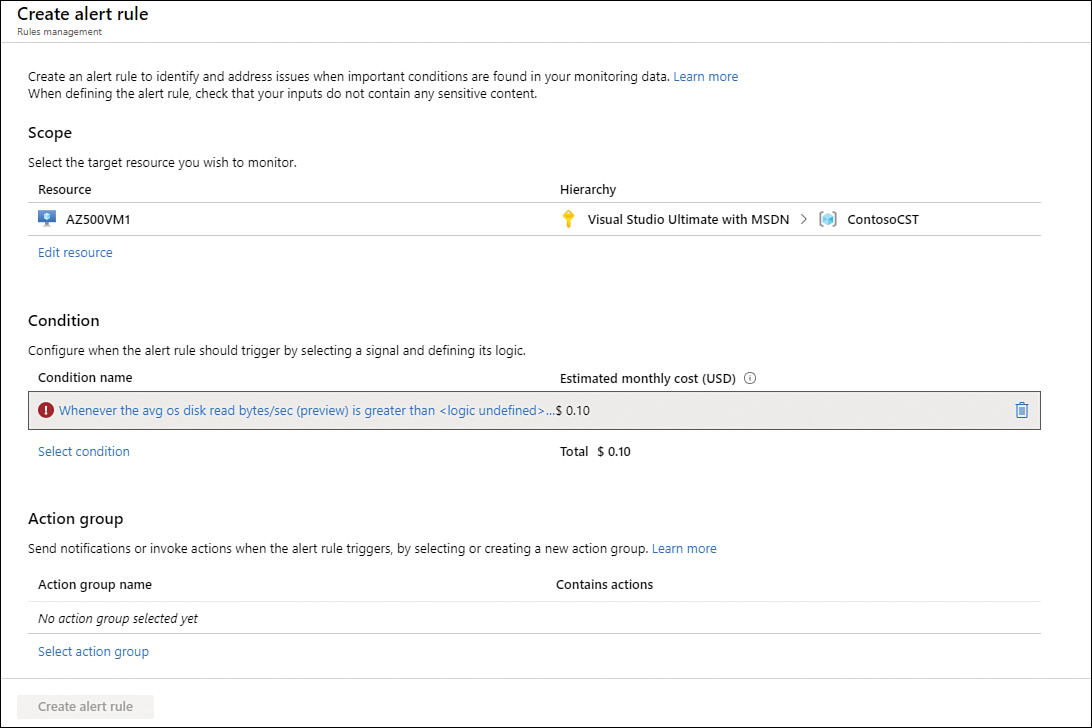
FIGURE 3-25 Creating an alert rule
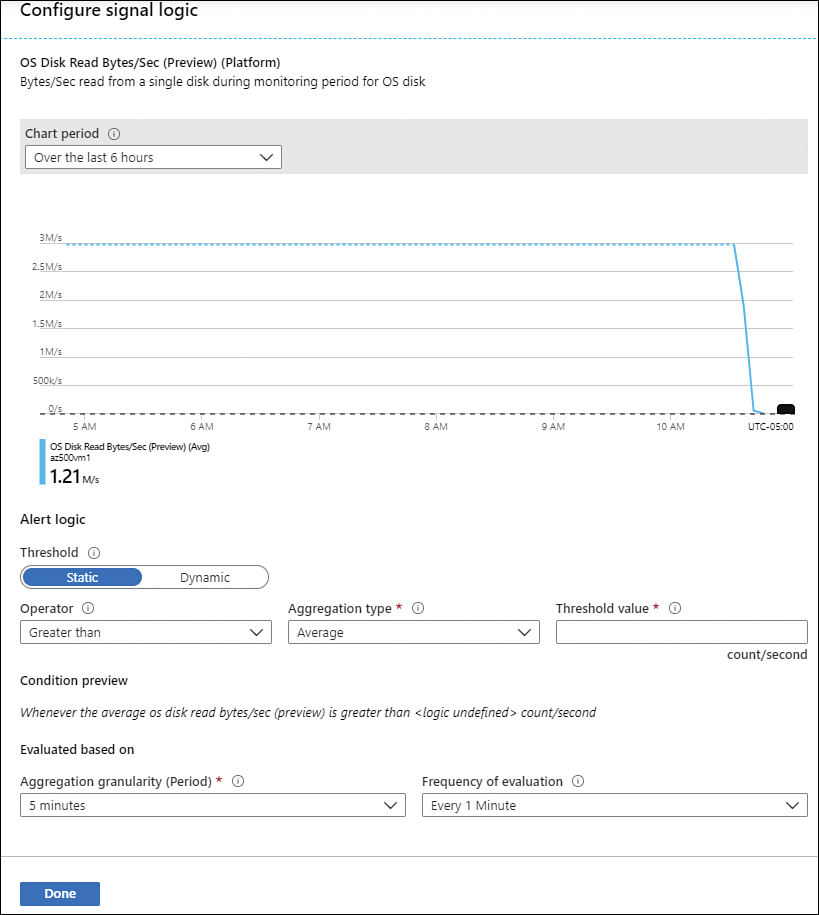
FIGURE 3-26 Customizing the alert logic
The first part of this blade has the performance counter name that you are using for this rule and a sample chart with data over the last 6 hours. The second part of this blade is where you configure the threshold. In the Alert Logic section, you can change the toggle to one of these options:
Static You provide a specific value as the threshold.
Dynamic Uses machine learning to continuously learn about the behavior pattern.
In this case, the Contoso administrator wants to receive an alert if the average OS Disk Read Bytes/Sec counter is higher than 3 MB, which means Static is the best option to use. In this case, the operator remains greater than, the Aggregation Type remains average, and you just need to enter the value (in this case, 3) in the Threshold Value field. The Condition Preview section explains the logic, so you can confirm that this is what you want to do. The Evaluated Based On section is where you can configure the Aggregation Granularity (Period) option, which defines the interval over which the data points are grouped. You can also configure the Frequency Evaluation, which defines how often this alert rule should be executed. The Frequency Evaluation should be the same as the Aggregation Granularity or higher. Once you finish, click the Done button.
Next, configure the Action Group section, which allows you to configure the type of notification that you want to receive. To configure this option, click Select Action Group, and in the Select An Action Group To Attach To This Alert Rule blade, click the Create Action Group option; the Add Action Group blade appears, as shown in Figure 3-27.
On this blade, you should start by typing a name for this action group; this can be a long name that helps you identify what this group does. In the Short Name field, add a short name, which appears in emails or messages that might be sent by this alert. Select the subscription and resource group to where this action group resides; under Action Name, type a name for the first action. Notice that there are many fields for actions; that’s because you can have actions such as sending an email, sending an SMS message, or running a runbook, among others. In his case, the Contoso administrator wants to send an email to a distribution list and send an SMS message to the on-call phone. For the action type, select Email/SMS Message/Push/Voice, and the Email/SMS Message/Push/Voice blade appears. In this blade, type the email and the SMS number, and then click OK twice.
To finish the alert creation, you just need to add an Alert Rule Name and a brief Description, and then choose the Severity of the alert from the drop-down menu. The severity should represent the level of criticality that you want to assign for this rule. In this case, the Contoso administrator understands that when this threshold is reached, an important (not critical) alert should be raised, which, in this case, could be represented by Sev 2, as shown in Figure 3-28.
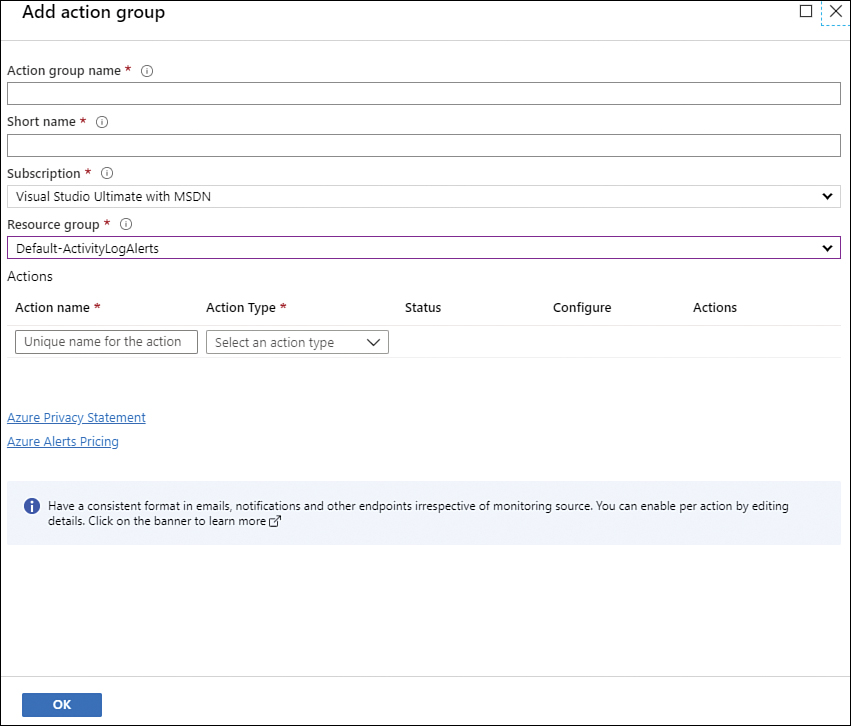
FIGURE 3-27 Action group configuration
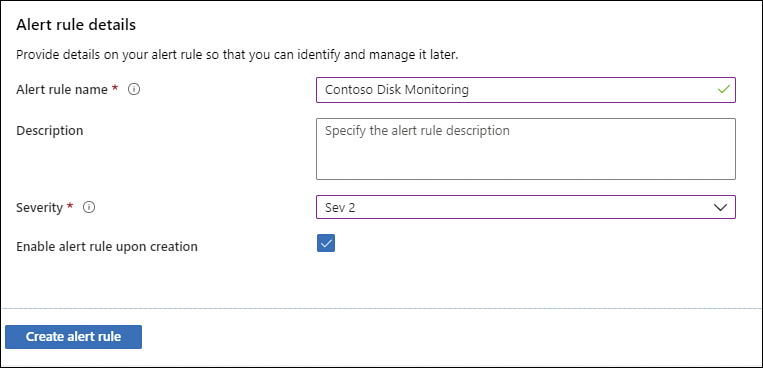
FIGURE 3-28 Configuring the alert rule details
Ideally, you should enable this rule upon creation, which is why the Enable Alert Rule Upon Creation check box is selected by default. To commit all the changes, click the Create Alert Rule button.
Once you finish creating the rule, you should receive an email advising you that you were added to the action group. A sample of this email is shown in Figure 3-29.
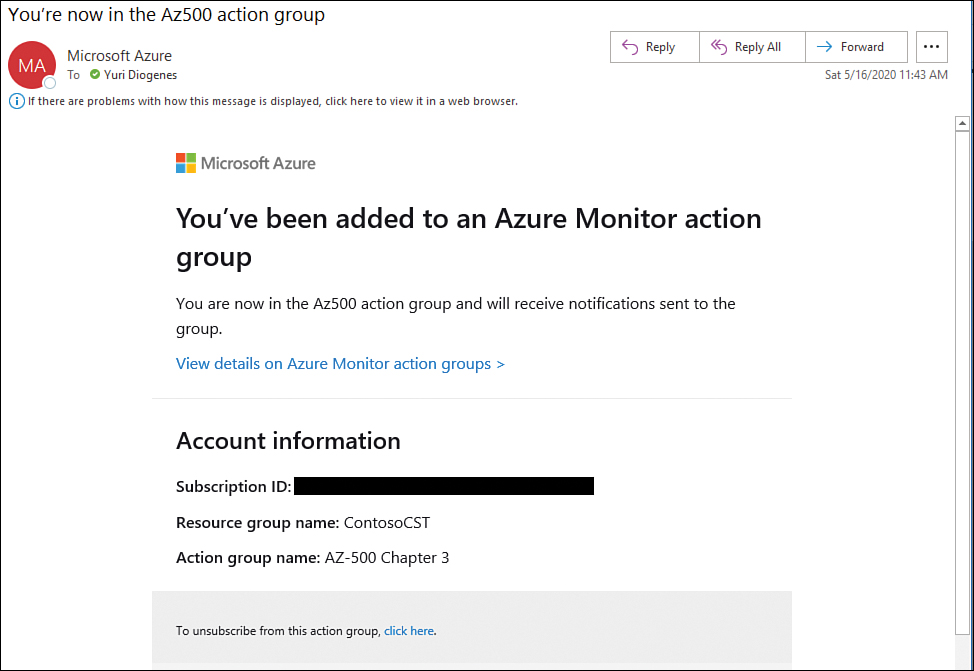
FIGURE 3-29 Email notification generated by Azure Monitor
You should also receive the SMS message. Notice that the short name that you used appears in the message, as shown in Figure 3-30.
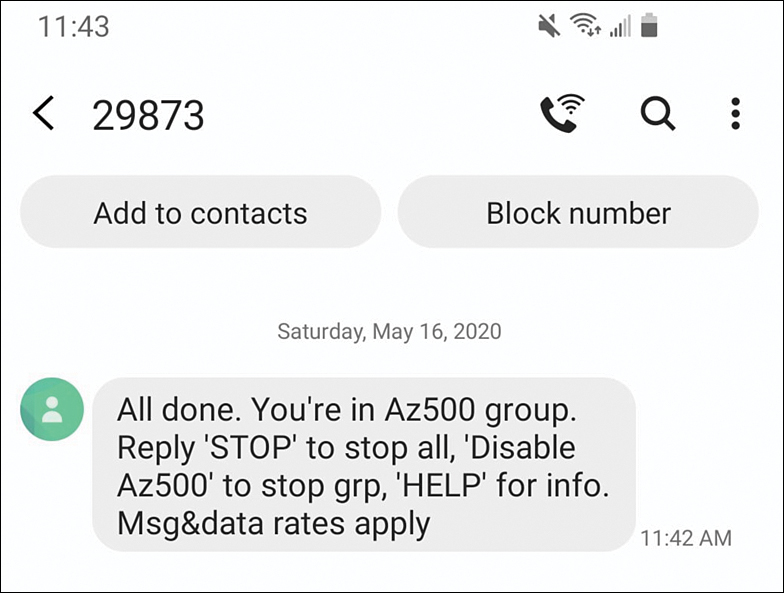
FIGURE 3-30 SMS notification generated by Azure Monitor
Now that you created an alert based on a metric that you used previously, the question is, “What if I need to change the alert rule?” If you want to be able both to see and change alerts, you can use the Alerts dashboard. Follow the steps below to access this dashboard.
Navigate to the Azure portal at https://portal.azure.com.
In the search bar, type alert, and under Services, click Alerts.
Click the Manage Alert Rules button, and the Rules page appears, as shown in Figure 3-31.
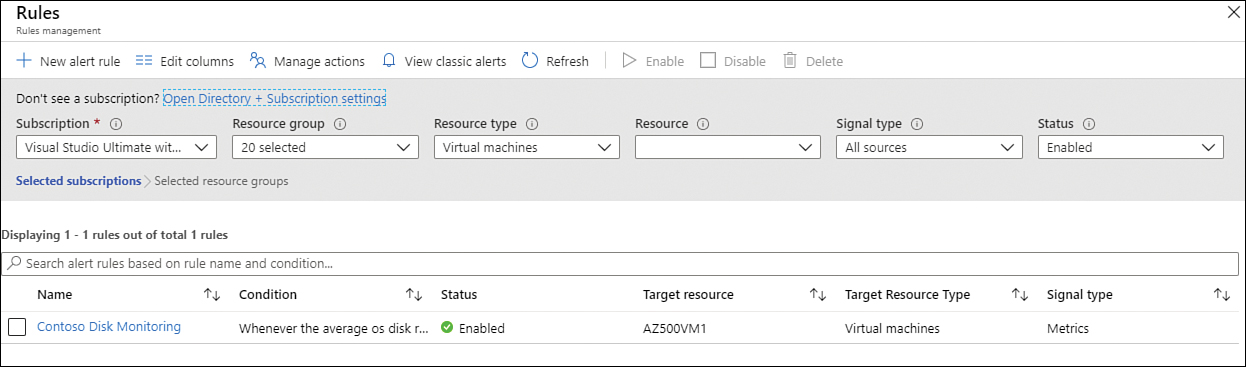
FIGURE 3-31 Activity log results after filtering
The alert rule that you created appears in the list. To edit the rule, you just need to click it. If you need to create a new alert rule, click the New Alert Rule button. Both steps will lead you to the Create Alert Rule page, which was previously shown in Figure 3-25.
Once an alert is fired, the status of the alert is set to New, which means the rule was detected, but it hasn’t been reviewed. Keep in mind that the Alert State is different and independent of the Monitor Condition. While the Alert State is set by the user, the Monitor Condition is automatically set by the system. When an alert is fired, the alert’s Monitor Condition is set to Fired. When the underlying condition that caused the alert to fire clears, the monitor condition is set to Resolved. (For example, the alert clears if your condition was to send an alert if the CPU reaches 80 percent utilization, and then the CPU utilization drops to 50 percent.) You can see this information in the email—assuming you configured the rule to send an email—as shown in Figure 3-32.
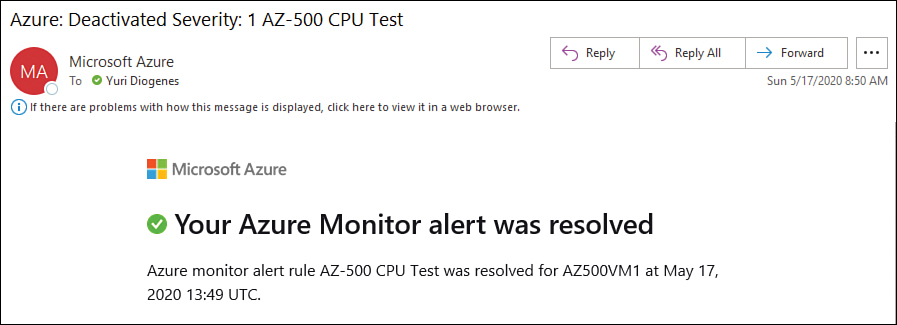
FIGURE 3-32 Email notification stating that an alert was resolved
Configure diagnostic logging and log retention by using Azure Monitor
In Azure, each resource requires its own diagnostic setting. In these settings, you define the categories of logs and metric data that should be sent to the destinations defined in the setting. Also, you need to define the destination of the log, which includes sending it to the Log Analytics workspace, Event Hubs, and Azure Storage.
It is important to mention that each resource can have up to five diagnostic settings. If the scenario requirement states that you need to send logs to a Log Analytics workspace and Azure Storage, you will need two diagnostic settings. Follow these steps to configure the diagnostic settings:
Navigate to the Azure portal at https://portal.azure.com.
In the search bar, type monitor, and under Services, click Monitor. The Monitor | Overview page appears.
In the left navigation pane, under Settings, click Diagnostics Settings; the Monitor | Diagnostic settings page appears, as shown in Figure 3-33.
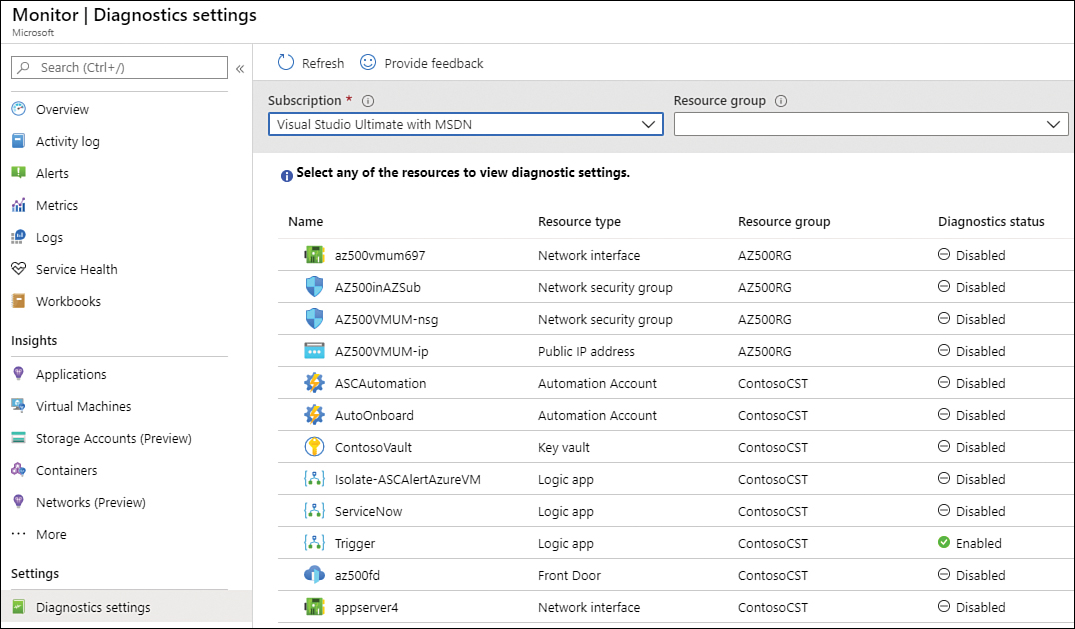
FIGURE 3-33 Diagnostics settings page in Azure Monitor
As you can see, all resources that can have diagnostic settings appear in this list. For this example, click the Front Door resource that was created in Chapter 2.
Click the Add Diagnostic Setting option; the Diagnostics Settings page appears, as shown in Figure 3-34.
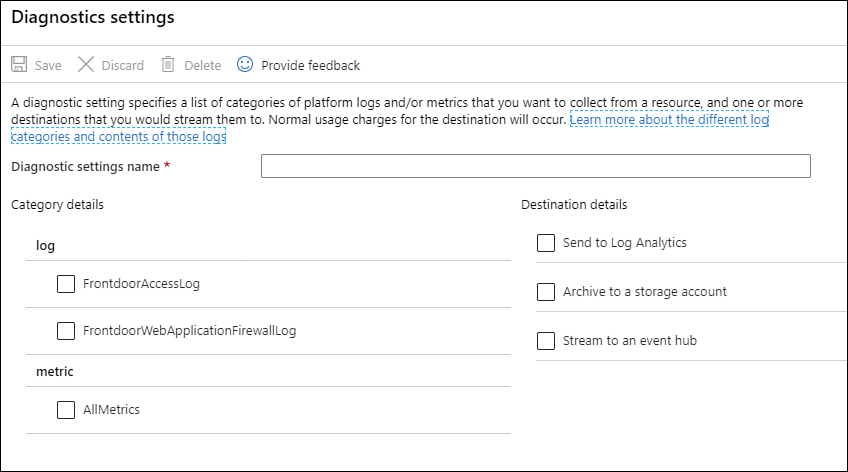
FIGURE 3-34 Diagnostic settings for a Front Door resource
In the Diagnostic Setting Name field, type a comprehensive name for this setting.
For this specific resource, you have two types of logs. The first is a metric log in which you can only select the ones that you need for your scenario; the second is the destination log, which can be Log Analytics, a storage account, or an Event Hub.
In this case, the Contoso Administrator needs to be able to easily query Front Door access logs and WAF logs using a comprehensive query language. To meet this requirement, you need to select Log Analytics, which utilizes Kusto Query Language (KQL) to perform queries.
When you select the Send To Log Analytics option, you will see the option to select the subscription and the Log Analytics workspace that you want to utilize (assuming you have one). Make a selection and click the Save button.
After saving, the Save button is no longer available, which indicates that the changes have been committed.
While the previous sample configuration describes the steps to configure a Log Analytics workspace as the diagnostic settings destination, the overall settings can vary according to the destination. For example, if you select storage account, the options shown in Figure 3-35 will appear.
Notice that when configuring a storage account as your destination, you can customize the retention policy for each log. In a scenario where the requirement is to store the Front Door access logs for 50 days and the WAF logs for 40 days, the best destination for this setting is the storage account because it allows this type of granular configuration.
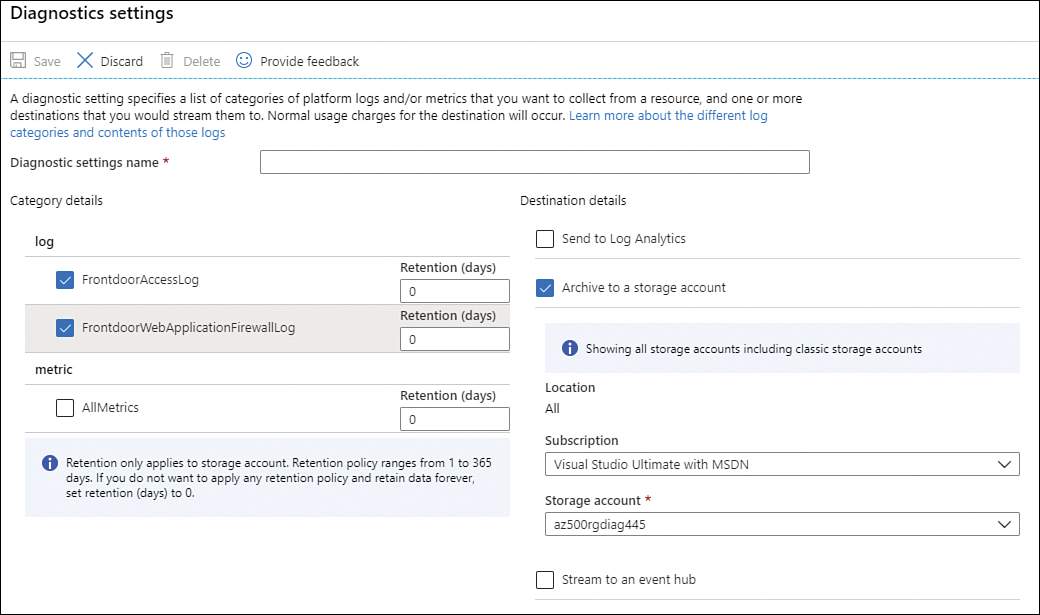
FIGURE 3-35 Storage account Diagnostic Settings
Consider selecting Event Hub as the destination when you need to stream the data to another platform. For example, you might do this if you need to send the Front Door (could be any other Azure resource) access logs to a third-party security information and event management (SIEM) solution, such as Splunk. In this case, using Event Hub is the best option because it allows the logs to be easily streamed to a SIEM solution.
Monitoring security logs by using Azure Monitor
Because each Azure resource can have different sets of logs and configurations, you need to ensure that you are collecting all logs that affect your security monitoring. For Platform as a Service (PaaS) services such as Azure Key Vault, you just need to configure the diagnostic settings to the target location (Log Analytics workspace, storage account, or Event Hub) where the log will be stored. For Infrastructure as a Service (IaaS) VMs, you need more steps because you want to ensure that you are collecting the relevant security logs from the operating system itself.
Data plane logs are the ones that will give you more information about security-related events in IaaS VMs. Assuming that you already have a Log Analytics workspace that will store this data, you will need to do the following actions to configure Azure Monitor to ingest security logs from VMs. First, enable the Log Analytics VM Extension and collect security events from the operating system. Once the data is collected, you can visualize it using the Log Analytics workspace and perform queries using KQL. Assuming that you already have a Log Analytics workspace created, follow these steps to configure this data collection:
Navigate to the Azure portal at https://portal.azure.com.
In the search bar, type log analytics, and under Services, click Log Analytics Workspaces.
On the Log Analytics Workspaces page, click the workspace in which you want to store the security logs.
In the left navigation pane of the workspace page, under Workspace Data Sources, click Virtual Machines.
Click the virtual machine that you want to connect to this workspace. Notice that the Log Analytics Connection status appears as Not Connected, as shown for the AZ500VM3 virtual machine in Figure 3-36.
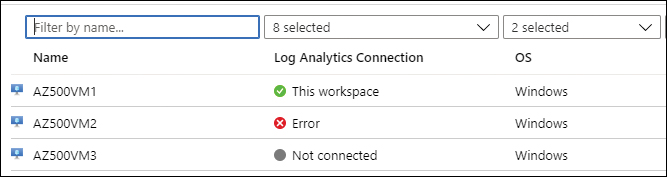
FIGURE 3-36 Virtual Machines that are available in the workspace
On the VM’s page, click the Connect button, as shown in Figure 3-37.
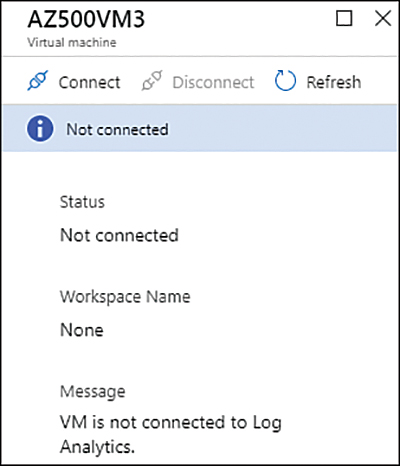
FIGURE 3-37 Connecting a VM to a workspace
At this point, the Log Analytics agent will be installed and configured on this machine. This process takes a few minutes, during which time the Status shows as
Connecting. You can close this page, and the process will continue in the background.After the agent is installed, the Status will change to
This Workspace.In the left navigation pane of the main workspace page, under Settings, click Advanced Settings.
On the Advanced Settings page, click Data > Windows Event Logs, as shown in Figure 3-38.
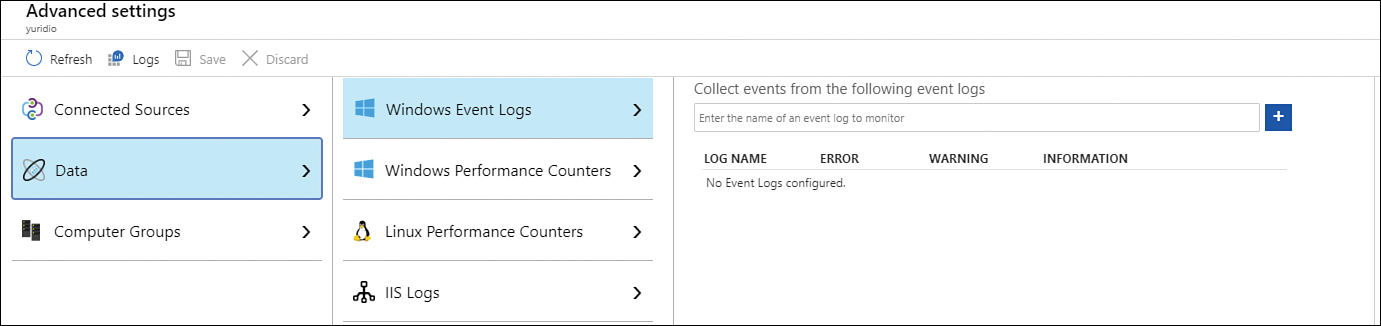
FIGURE 3-38 Configuring the data source for ingestion
In the Collect Events From The Following Event Logs field, type System and select System from the drop-down menu. Click the plus sign (+) to add this log. Leave the default options selected. If you have specific security events that you want to collect, type security and select the appropriate events.
Click the Save button.
Click OK in the pop-up window and close this page.
Azure Monitor also has solutions that can enhance the data collection for different scenarios. This can be extremely helpful for security monitoring. You can also leverage an Azure Resource Manager (ARM) template to deploy the agent in scale; when doing so, you will need two parameters: the workspace ID and the workspace key.
Introduction to Microsoft Sentinel’s architecture
Although an introduction to Microsoft Sentinel is not part of the official AZ-500 outline, it is important to better understand Microsoft Sentinel’s architecture before talking about alerts. The major Microsoft Sentinel components are diagrammed in Figure 3-39.
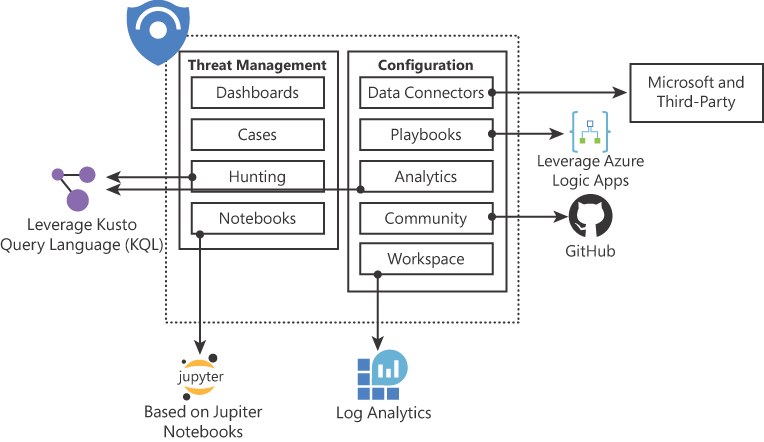
FIGURE 3-39 Major components of Microsoft Sentinel
The components shown in Figure 3-39 are presented in more detail in the following list:
Dashboards Built-in dashboards provide data visualization for your connected data sources, which enables you to deep dive into the events generated in those services.
Cases An aggregation of all the relevant evidence for a specific investigation. It can contain one or multiple alerts, which are based on the analytics that you define.
Hunting A powerful tool to investigators and security analytics who need to proactively look for security threats. The searching capability is powered by Kusto Query Language (KQL).
Notebooks By integrating with Jupyter notebooks, Microsoft Sentinel extends the scope of what you can do with the data that was collected. It combines full programmability with a collection of libraries for machine learning, visualization, and data analysis.
Data Connectors Built-in connectors are available to facilitate data ingestion from Microsoft and partner solutions.
Playbook A collection of procedures that can be automatically executed upon an alert that is triggered by Microsoft Sentinel. Playbooks leverage Azure Logic Apps, which help you automate and orchestrate tasks and workflows.
Analytics Enables you to create custom alerts using Kusto Query Language (KQL).
Community The Microsoft Sentinel Community page is located on GitHub (https://aka.ms/ASICommunity), and it contains Detections based on different types of data sources that you can leverage to create alerts and respond to threats in your environment. It also contains hunting queries samples, Playbooks, and other artifacts.
Workspace Essentially, a Log Analytics workspace is a container that includes data and configuration information. Azure Sentinel uses this container to store the data that you collect from the different data sources.
The sections that follow assume that you already have a workspace configured to use with Microsoft Sentinel.
Configure Data Sources to Microsoft Sentinel
The first step to configure a SIEM solution such as Microsoft Sentinel is ensuring that the data relevant to your requirements is ingested. For example, if you need to collect data related to conditional access policies and legacy authentication-related details using sign-in logs, you need to configure the Azure Active Directory (AD) connector. Microsoft Sentinel comes with a variety of connectors that enable you to start ingesting data from those data sources with just a couple of clicks. Keep in mind that you need to have those services enabled to start ingesting data using these connectors. Use Table 3-1 to identify some use-case scenarios and to determine which connector is available for each scenario:
TABLE 3-1 Microsoft Sentinel connectors and use-case scenarios
Scenario | Connector |
You need to gain insights about app usage; conditional access policies; legacy authentication-related details; and activities like user, group, role, app management. | Azure AD |
You need to get details of operations such as file downloads, access requests sent, and changes to group events, and you need to set the mailbox and details of the user who performed the actions. | Office 365 |
You need to gain visibility into your cloud apps; get sophisticated analytics to identify and combat cyberthreats; and control how your data travels. | Microsoft Defender for Cloud Apps |
You need to gain insights into subscription-level events that occur in Azure, including events from Azure Resource Manager operational data; service health events; write operations taken on the resources in your subscription; and the status of activities performed in Azure. | Azure Activity |
You need to gain visibility about users at risk, risk events, and vulnerabilities. | Azure AD Identity Protection |
You need to gain insights into your security state across hybrid cloud workloads; reduce your exposure to attacks; and respond to detected threats quickly. | Microsoft Defender for Cloud |
The connectors shown in this table are considered service-to-service integrations. Also, there are connectors to external solutions using API and others that can perform real-time log streaming using the Syslog protocol via an agent. Following are some examples of external connectors (non-Microsoft) that use agents:
Check Point
Cisco ASA
DLP solutions
DNS machines - agent installed directly on the DNS machine
ExtraHop Reveal(x)
F5
Forcepoint products
Fortinet
Linux servers
Palo Alto Networks
One Identity Safeguard
Other CEF appliances
Other Syslog appliances
Trend Micro Deep Security
Zscaler
To configure data connectors, you will need the right level of privilege. The necessary roles for each connector are determined per connector type. For example, to configure the Azure AD connector, you will need the following permissions:
Workspace Read and write permissions are required.
Diagnostic Settings Required read and write permissions to AAD diagnostic settings.
Tenant Permissions Required Global Administrator or Security Administrator roles on the workspace’s tenant.
While this connector has a decent list of permission requirements, some others will be simpler. For example, to configure the Azure Activity connector, you just need Read and Write permissions in the workspace. The requirements for each connector will be available on the connector’s page in Microsoft Sentinel.
For this initial scenario, let’s say that Fabrikam wants to ensure that the following things are ingested in Microsoft Sentinel: all events from Azure Resource Manager operational data; service health events; write operations taken on Fabrikam’s subscription resources, and the status of activities performed in Azure. To accomplish that, you need to configure the Azure Activity connector. Follow these steps:
Navigate to the Azure portal at https://portal.azure.com.
In the search bar, type sentinel, and under Services, click Microsoft Sentinel.
On the Microsoft Sentinel workspaces page, click the workspace that you want to use with Microsoft Sentinel; the Microsoft Sentinel | Overview page appears (see Figure 3-40).
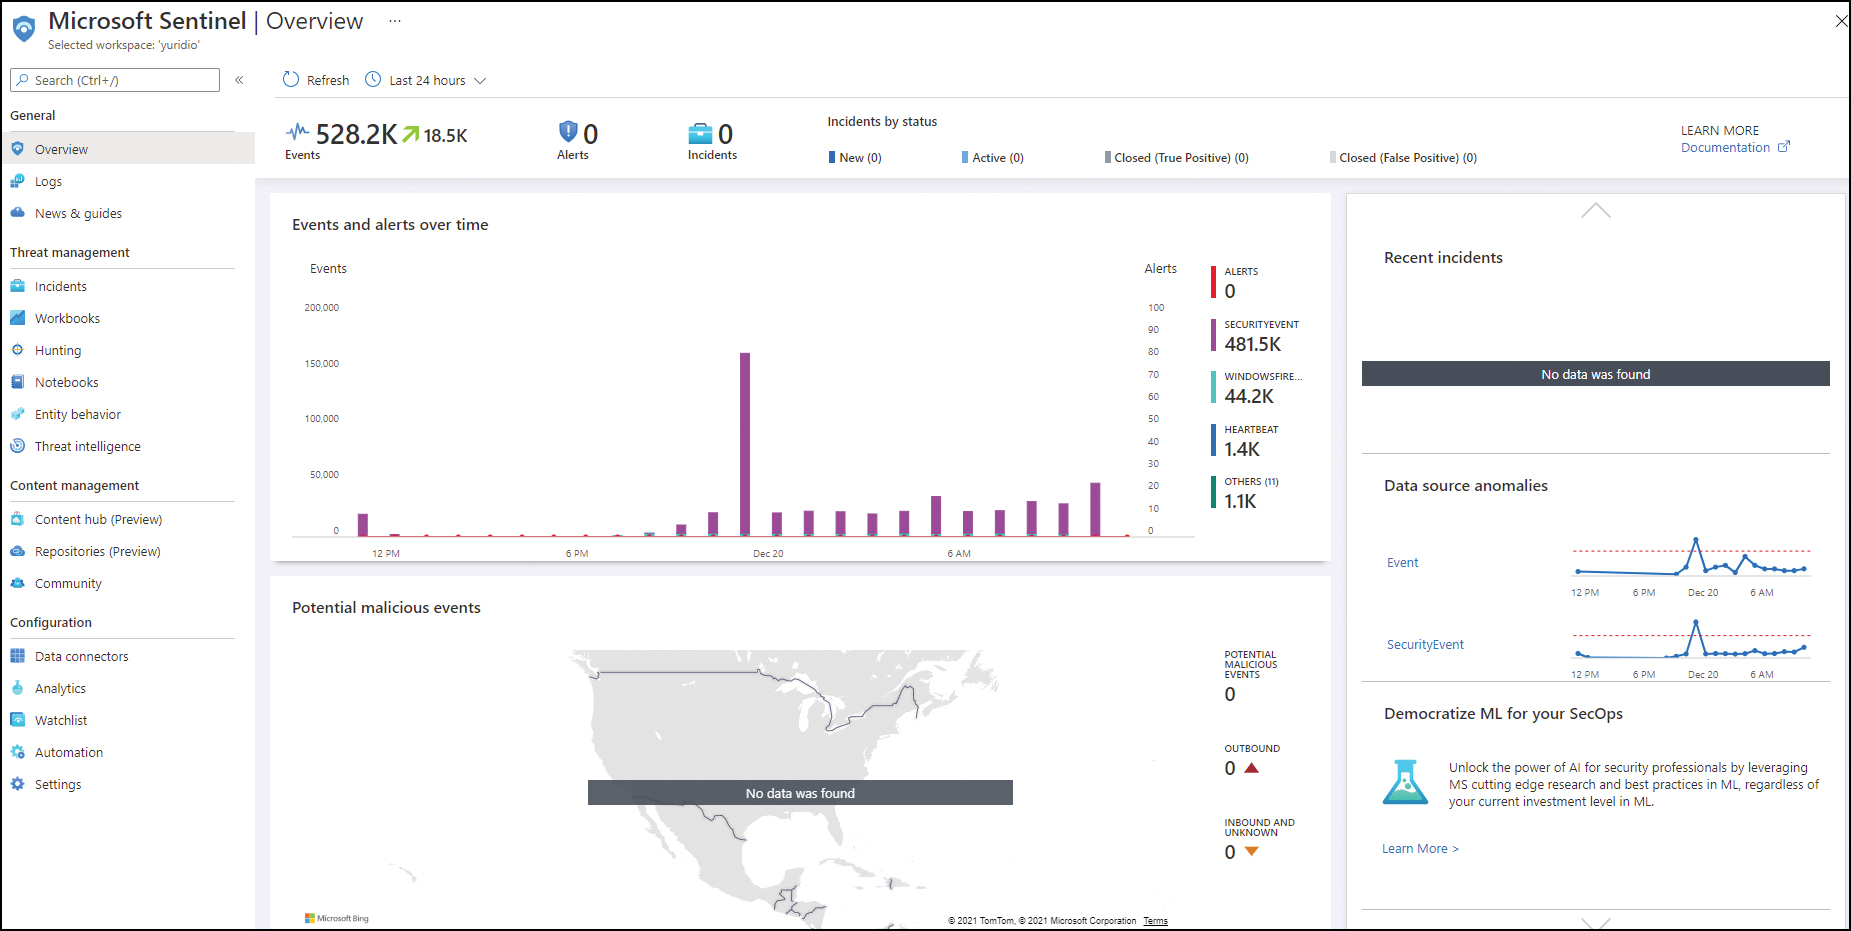
FIGURE 3-40 Microsoft Sentinel Overview page
In the left navigation pane, under Configuration, click Data Connectors.
On the Data Connectors page, click Azure Activity.
On the Azure Activity blade, click the Open Connector Page button, as shown in Figure 3-41.
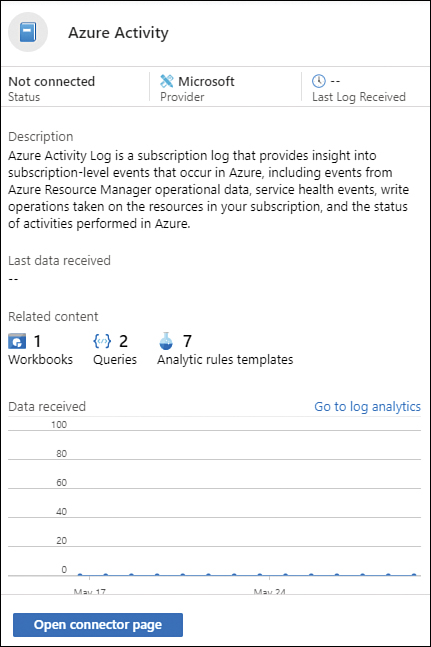
FIGURE 3-41 Azure Activity blade
On the Azure Activity page, click the Configure Azure Activity Logs link, as shown in Figure 3-42.
On the Azure Activity Log blade, click the subscription that you want to connect, and in the Subscription blade that appears, click the Connect button, as shown in Figure 3-43.
Once it finishes connecting, click the Refresh button to update the button’s status. You will see that now the Disconnect button is available.
Close the Subscription blade, close the Azure Activity Log blade, and close the Azure Activity connector page.
When you return to the Microsoft Sentinel | Data Connectors page, make sure to click the Refresh button to update the Azure Activity data connector status.
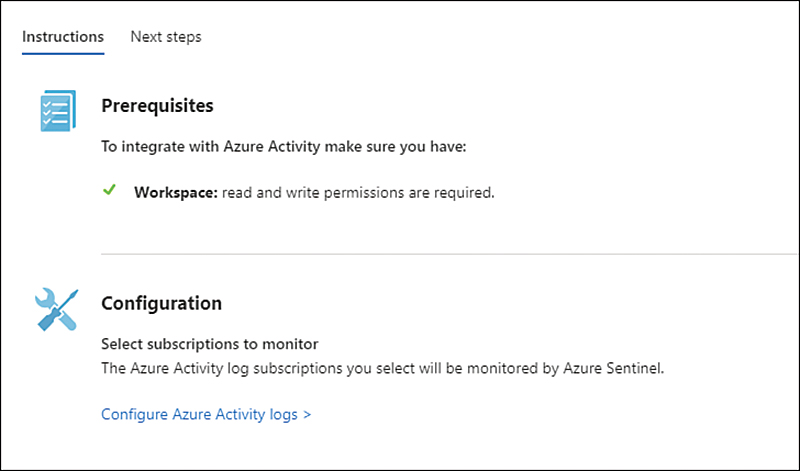
FIGURE 3-42 Azure Activity data connector configuration
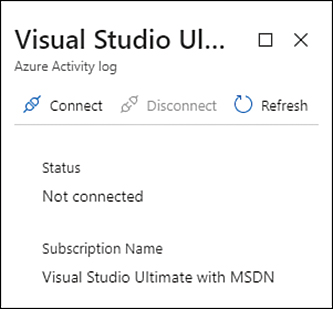
FIGURE 3-43 Subscription blade
The core steps to configure Microsoft Sentinel data connectors are very similar, though depending on the connector, you might need to execute more steps. This is true mainly for external connectors and services in different cloud providers. For example, if you need to connect to Amazon AWS to stream all AWS CloudTrail events, you will need to perform some steps in the AWS account.
Create and customize alerts
After the different data sources are connected to Microsoft Sentinel, you can create custom alerts, which are called Analytics. There are two types of analytics that can be created: a scheduled query rule and a Microsoft incident creation rule. A scheduled query rule allows you to fully customize the parameters of the alert, including the rule logic and the alert threshold. A Microsoft incident creation rule allows you to automatically create an incident in Azure Sentinel for an alert that was generated by a connected service. This type of rule is available for alerts generated by Microsoft Defender for Cloud, Microsoft Defender for IoT, Microsoft Defender for Endpoint Protection, Azure AD Identity Protection, Microsoft Defender for Cloud Apps, and Microsoft Defender for Identity.
When considering which one you need to utilize, make sure to understand the prerequisites for the scenario because those requirements will determine the type of rule that you need to create. For example, if the requirement is to customize the alert with parameters that will determine the query scheduling and alert threshold, then the best option is the scheduled query rule. For this scenario, Fabrikam wants to create a medium severity alert every time a VM is deleted, and an incident should be created for further investigation. Follow these steps to create a scheduled query rule:
Navigate to the Azure portal at https://portal.azure.com.
In the search bar, type sentinel, and under Services, click Microsoft Sentinel.
On the Microsoft Sentinel workspaces page, click the workspace that you want to use with Microsoft Sentinel; the Microsoft Sentinel | Overview page appears.
In the left navigation pane, under Configuration, click Analytics.
Click the Create button and select the Scheduled Query Rule option. The Analytic Rule Wizard – Create New Rule page appears, as shown in Figure 3-44.
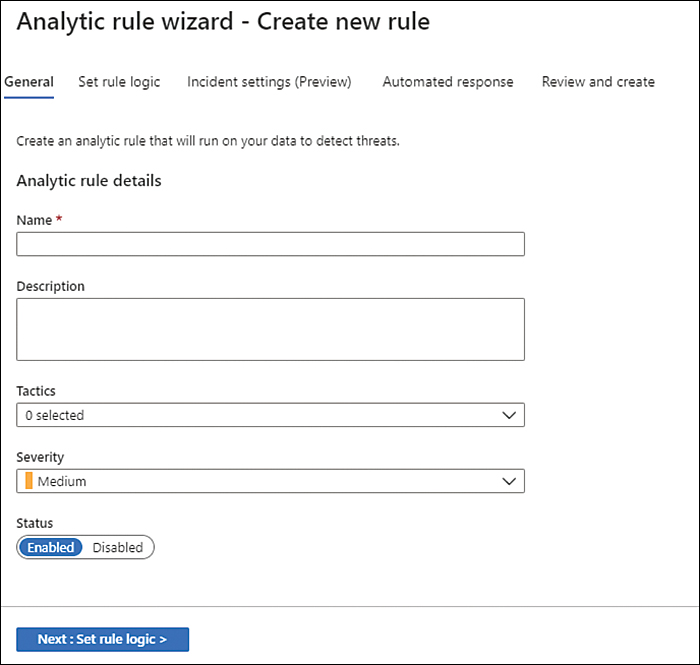
FIGURE 3-44 Create New Rule page
In the Name field, type a name for this analytic.
Optionally, you can write a full description for this analytic and select the tactic. The Tactics drop-down menu contains a list of the different phases available in the cyber kill chain. You should select the appropriate phase for the type of alert that you want to create; for this example, select Impact.
The Severity drop-down menu contains a list of all available levels of criticality for the alert. For this example, leave it set to Medium.
Because you want to activate the rule after creating it, leave the Status set to Enabled.
Click the Next: Set Rule Logic button; the Set Rule Logic tab appears, as shown in Figure 3-45.
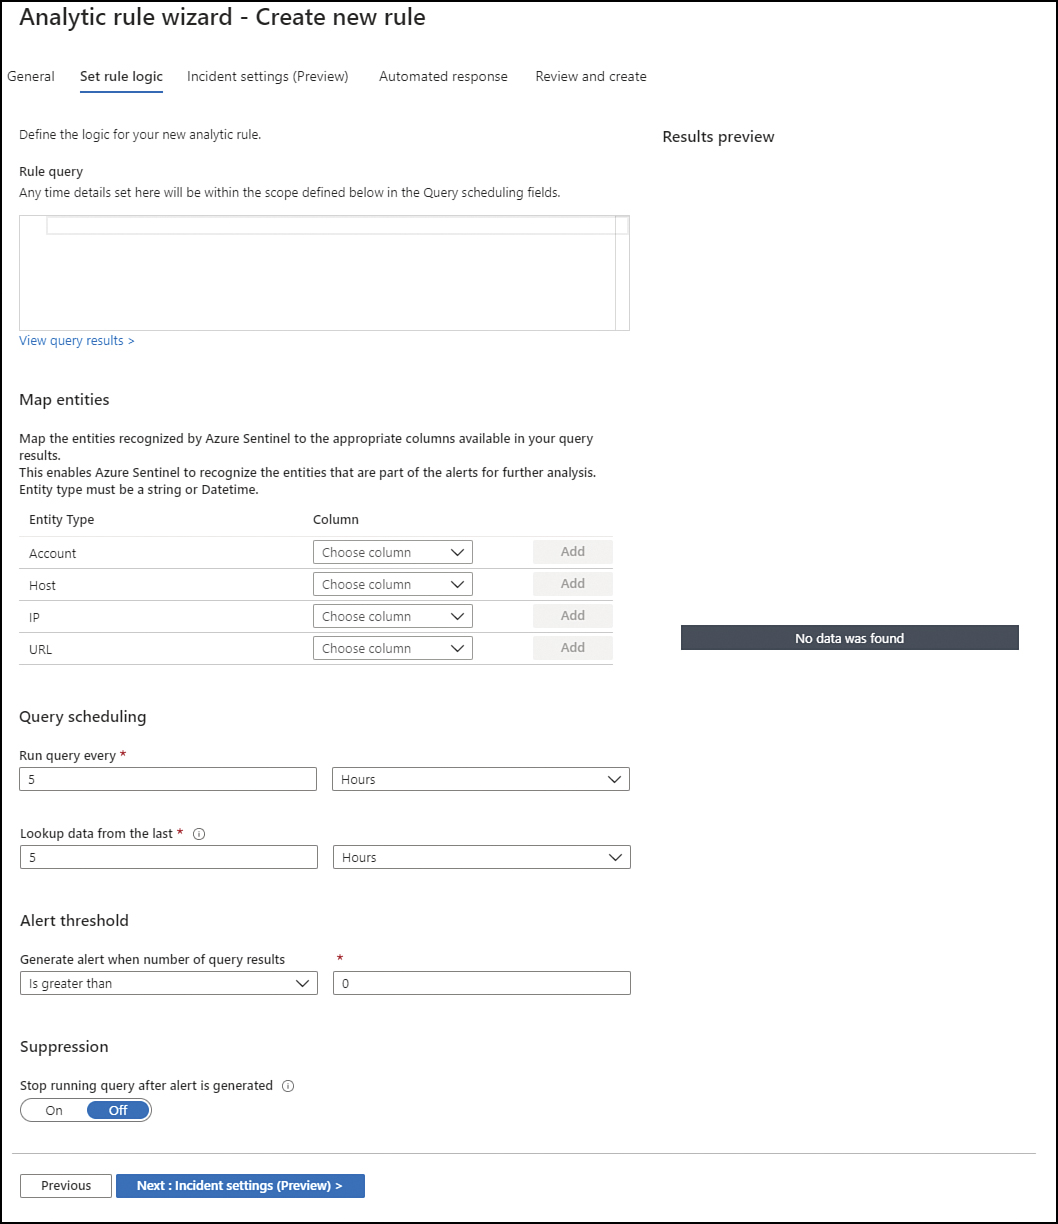
FIGURE 3-45 Configuring the rule logic
In the Rule Query field, you need to type the KQL query. Because Fabrikam wants to receive an alert when VMs are deleted, type the following sample query:
AzureActivity
| where OperationNameValue contains "Microsoft.Compute/virtualMachines/delete"
In some scenarios, you might need to customize the Map Entities options to enable Microsoft Sentinel to recognize the entities that are part of the alerts for further analysis. For this scenario, you can leave the default setting.
Under Query Scheduling, the first option is to customize the frequency with which you want to run this query. Because this scenario does not have a specifically defined frequency, leave it set to run every 5 hours.
Next, you can customize the timeline in which you want to run this query under the Lookup Data From The Last option. By default, the query will run based on the last 5 hours of data collected. Because in this scenario, it was not specifically specified, leave the timeline as is.
Under Alert Threshold is the Generate Alert When Number Of Query Results drop-down menu. Because this scenario calls for an alert to be generated every time a VM is deleted, you should leave this set to the default setting, Is Greater Than 0.
Under Suppression, you could choose to stop the query after the alert is generated. In this scenario, leave the default selection, which is Off.
Click the Next: Incident Settings (Preview) button; the Incident Settings tab appears, as shown in Figure 3-46.
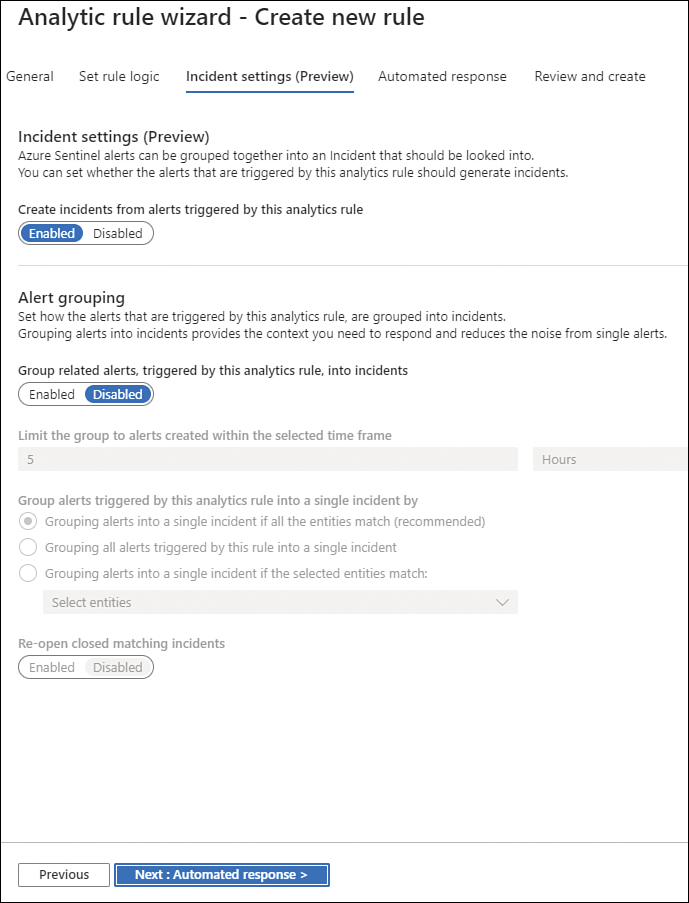
FIGURE 3-46 Configuring incident settings
Leave the Create Incidents From Alerts Triggered By This Analytics Rule option selected (which is the default setting) because the scenario requires an incident to be created.
Under Alert Grouping, you can configure how the alerts that are triggered by this analytics rule are grouped into incidents. For this scenario, leave the default selection, which is Disabled.
Click the Next: Automated Response button; the Automated Response Tab appears, as shown in Figure 3-47.
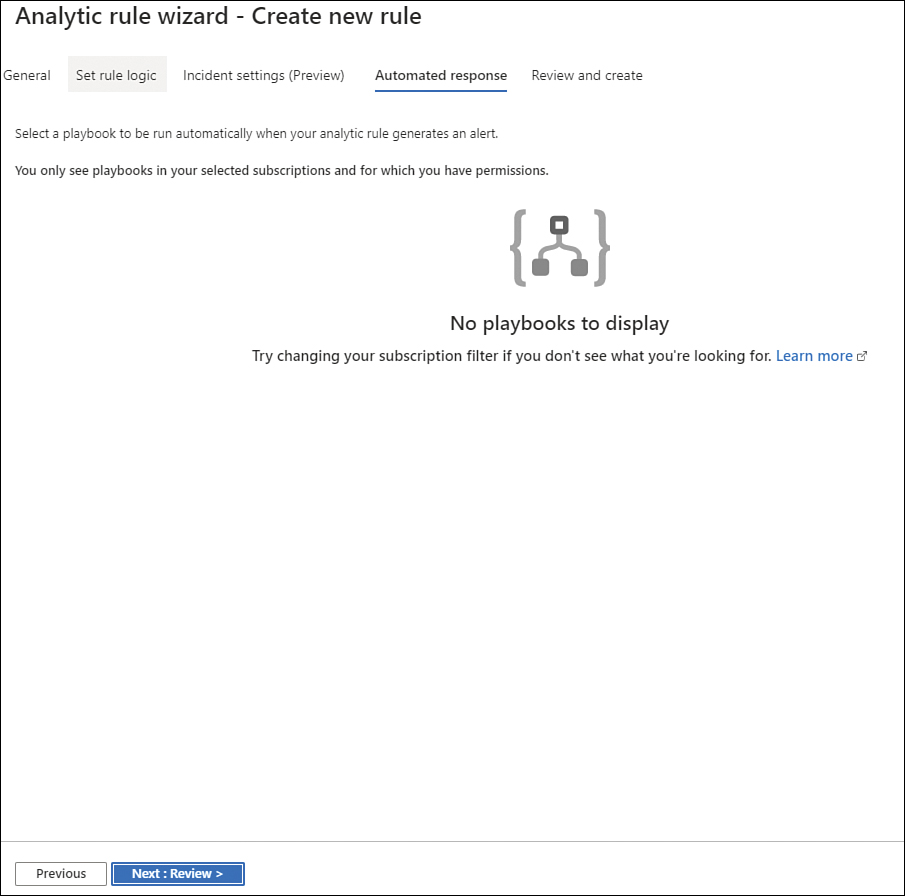
FIGURE 3-47 Configuring an Automated Response
The Automation Response tab contains a list of all Azure Logic Apps available. In a new deployment, it is common to see an empty tab because there will be no Logic Apps available. You will learn more about automated responses in the next section of this chapter.
Click the Next: Review button, review the options, and click the Create button.
After the rule is created, you will be taken back to the Microsoft Sentinel | Analytics page; the rule appears in the Active Rules list. If you click it, you will see the rule's parameters, as shown in Figure 3-48.
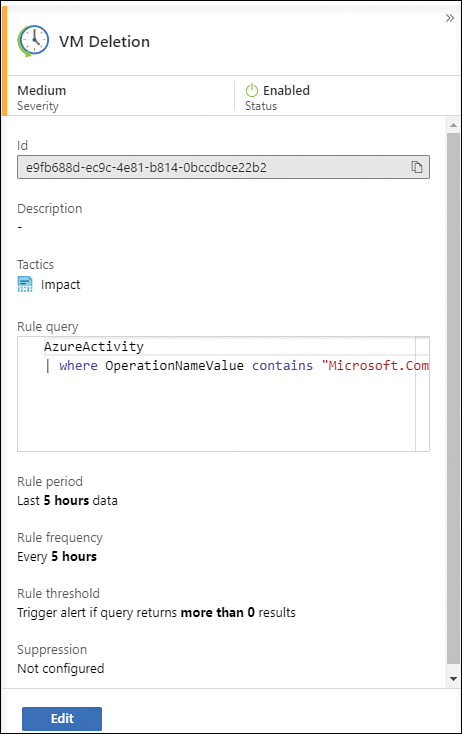
FIGURE 3-48 Custom alert after creation
While this rule was created specifically for a particular scenario, you can utilize existing templates, which are located on the Rule Templates tab in the main Microsoft Sentinel | Analytics page. You can create a scheduled rule type based on different known types of attacks. For example, if you have a scenario in which you need to detect distributed password cracking attempts in Azure AD, you can just create a rule based on the available template, as shown in Figure 3-49.
There are other scenarios in which you might need to simply create an incident in Microsoft Sentinel based on an alert triggered by a connected service. For example, you might want to create an incident every time an alert is triggered from Microsoft Defender for Cloud. The initial steps are the same. The difference is that in step 5 of the earlier instructions, you would select the Microsoft Incident Creation rule. When this option is selected, you will see the Analytic Rule Wizard Create – Create New Rule page, as shown in Figure 3-50.
In the Microsoft Security Service drop-down menu, you can select the connected service that you want to use as the data source. For example, if you select Microsoft Defender For Cloud from the list and you do not customize the included or excluded alerts, Microsoft Sentinel will create an incident for all alerts triggered by Microsoft Defender for Cloud.
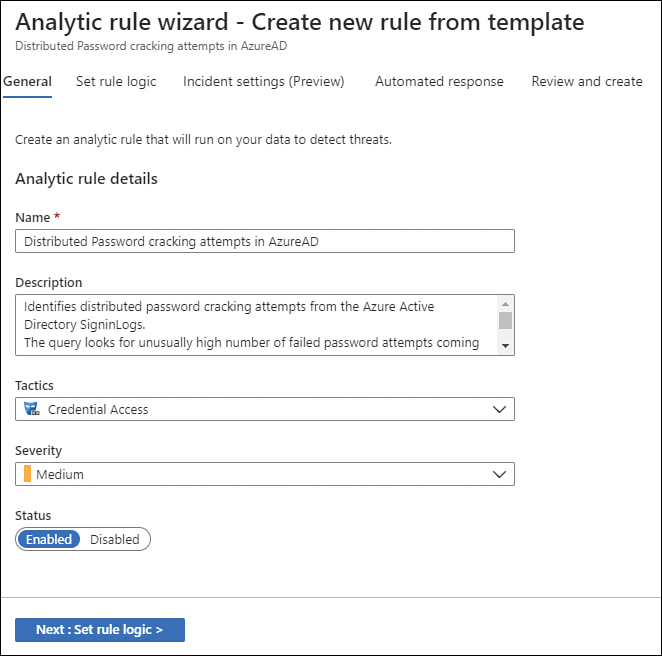
FIGURE 3-49 Creating an alert based on a template
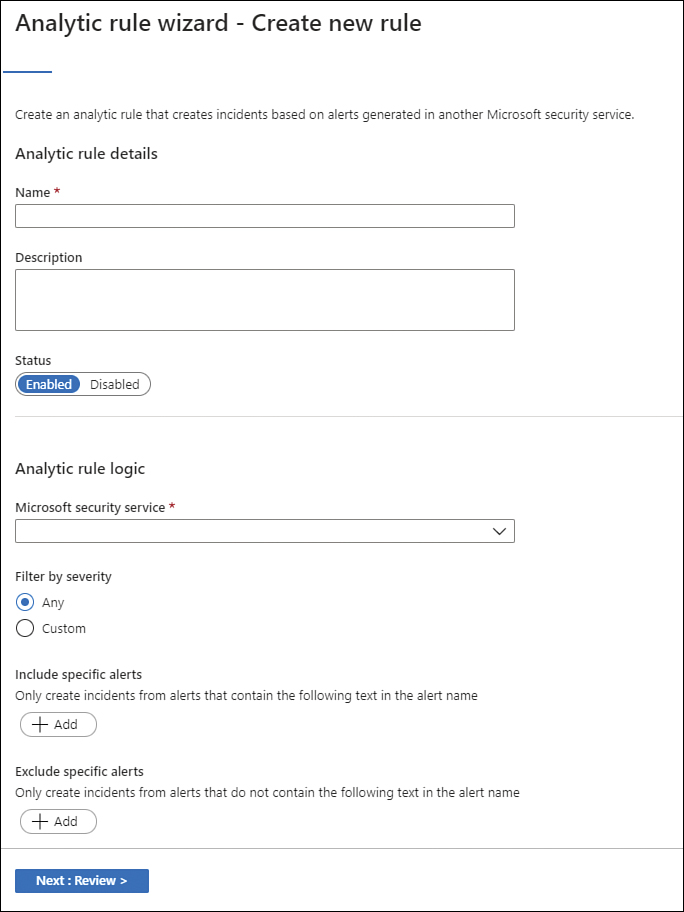
FIGURE 3-50 Creating an alert based on a connected service
Evaluate alerts and incidents in Microsoft Sentinel
Besides the main overview dashboard available in Microsoft Sentinel that displays charts and a summary of the events and alerts, you can also perform direct queries in the Log Analytics workspace or visualize the collected data using Workbooks. If you need to visualize security events quickly, click the SecurityEvent option in the Events And Alerts Over Time tile; the Log Analytics workspace appears with the query result, as shown in Figure 3-51.
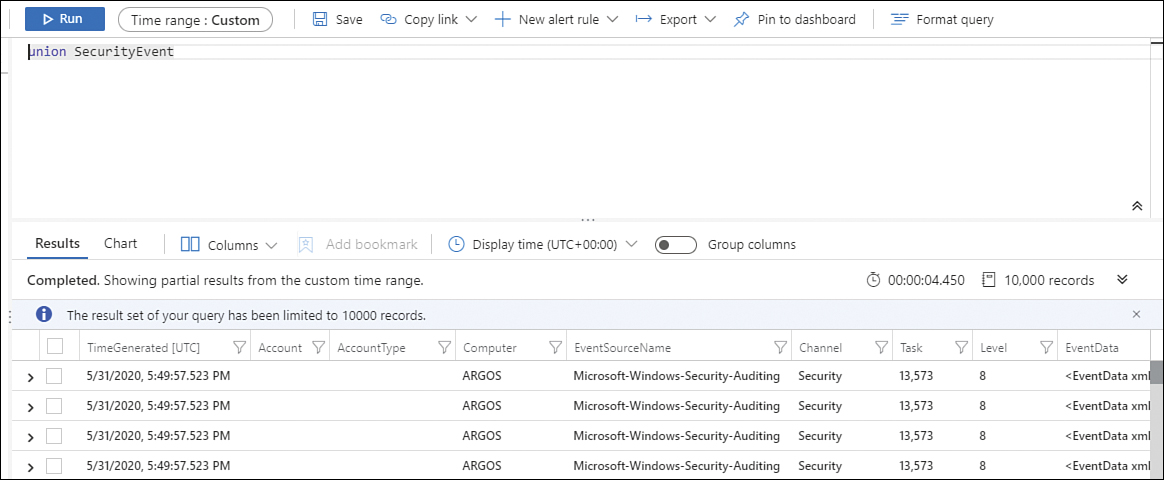
FIGURE 3-51 Security Events
When accessing the information directly from the Log Analytics workspace, you can leverage KQL search to explore further the information that you are trying to find out. This type of approach to query data freely using the Log Analytics workspace is more often used in investigation scenarios (reactive).
For more proactive scenarios, one option is to use Azure Workbooks. Microsoft Sentinel Workbooks provide interactive reports that can be used to visualize your security and compliance data. Workbooks combine text, queries, and parameters to make it easy for developers to create mature visualizations, advanced filtering, drill-down capabilities, advanced dashboard navigations, and more. To leverage a specific Workbook template, you must have at least Workbook Reader or Workbook Contributor permissions on the resource group of the Microsoft Sentinel workspace.
Using a Workbook is a great choice for monitoring scenarios where you need data visualization through a dashboard with specific analytics for each data source. Another use case scenario is when you want to build your custom dashboard with data coming from multiple data sources.
For example, if you need to evaluate Azure Activity Log data that is being ingested in Microsoft Sentinel using the Azure Activity connector, you can use the Azure Activity Workbook. In the main Microsoft Sentinel dashboard, under Threat Management, click Workbooks. Next, click the Azure Activity option and click the View Template button at the right; the Azure Activity Workbook appears, as shown in Figure 3-52.

FIGURE 3-52 Security Events
Leveraging the correct option to evaluate results in Microsoft Sentinel can help you save time identifying the relevant information.
Incidents
Another way to evaluate results in Microsoft Sentinel is by looking at incidents. When an incident is created based on an alert that was triggered, you can review this incident in the dashboard, and you can remediate the incident using a Playbook that you previously created. Also, you can investigate the incident.
To access the incidents dashboard, click Incidents under the Threat Management section on the main Microsoft Sentinel page. Figure 3-53 shows an example of an incident.
When an incident is selected, you will see a summary of the incident details in the right pane. As you triage the incident, you can do the following:
Change the incident’s severity.
Change incident status. (For example, you can change the severity to Active if it is an ongoing investigation.)
Assign the incident to an owner. (By default, the owner is shown as Unassigned.)
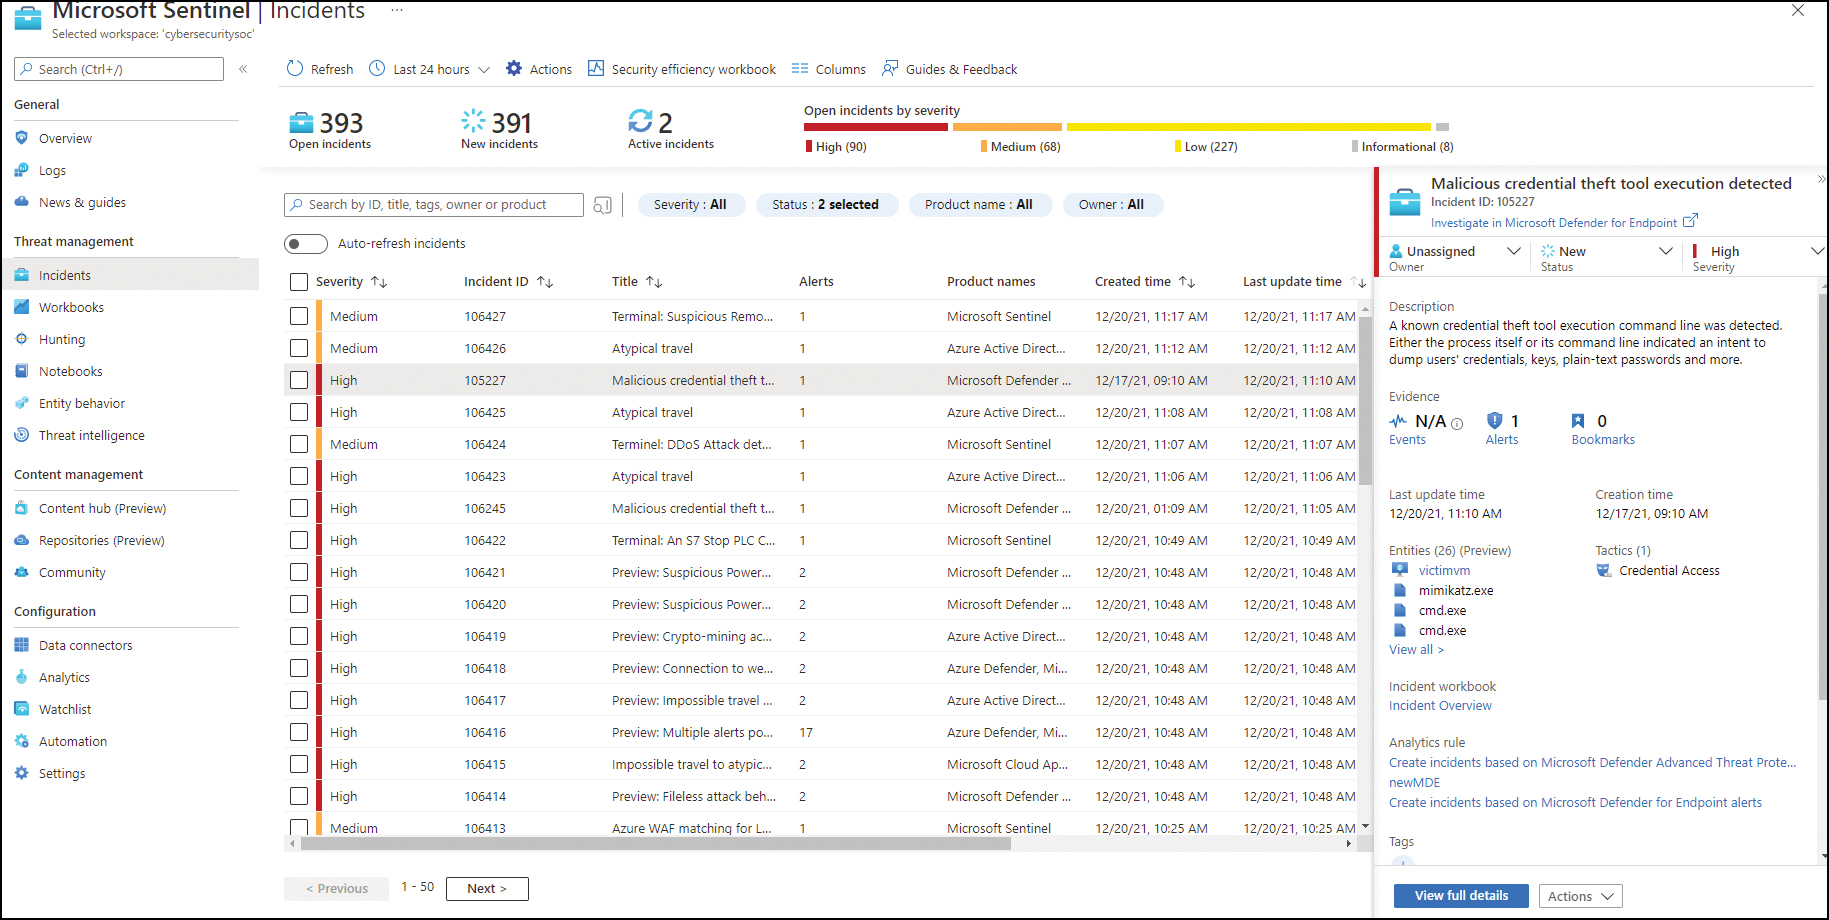
FIGURE 3-53 Visualizing an incident in Azure Sentinel
To see more details about the incident, click the View Full Details button. Figure 3-54 shows an example of a full incident.
Depending on the artifacts that are available about the incident, you will also have access to the Investigation dashboard, as shown in Figure 3-54:
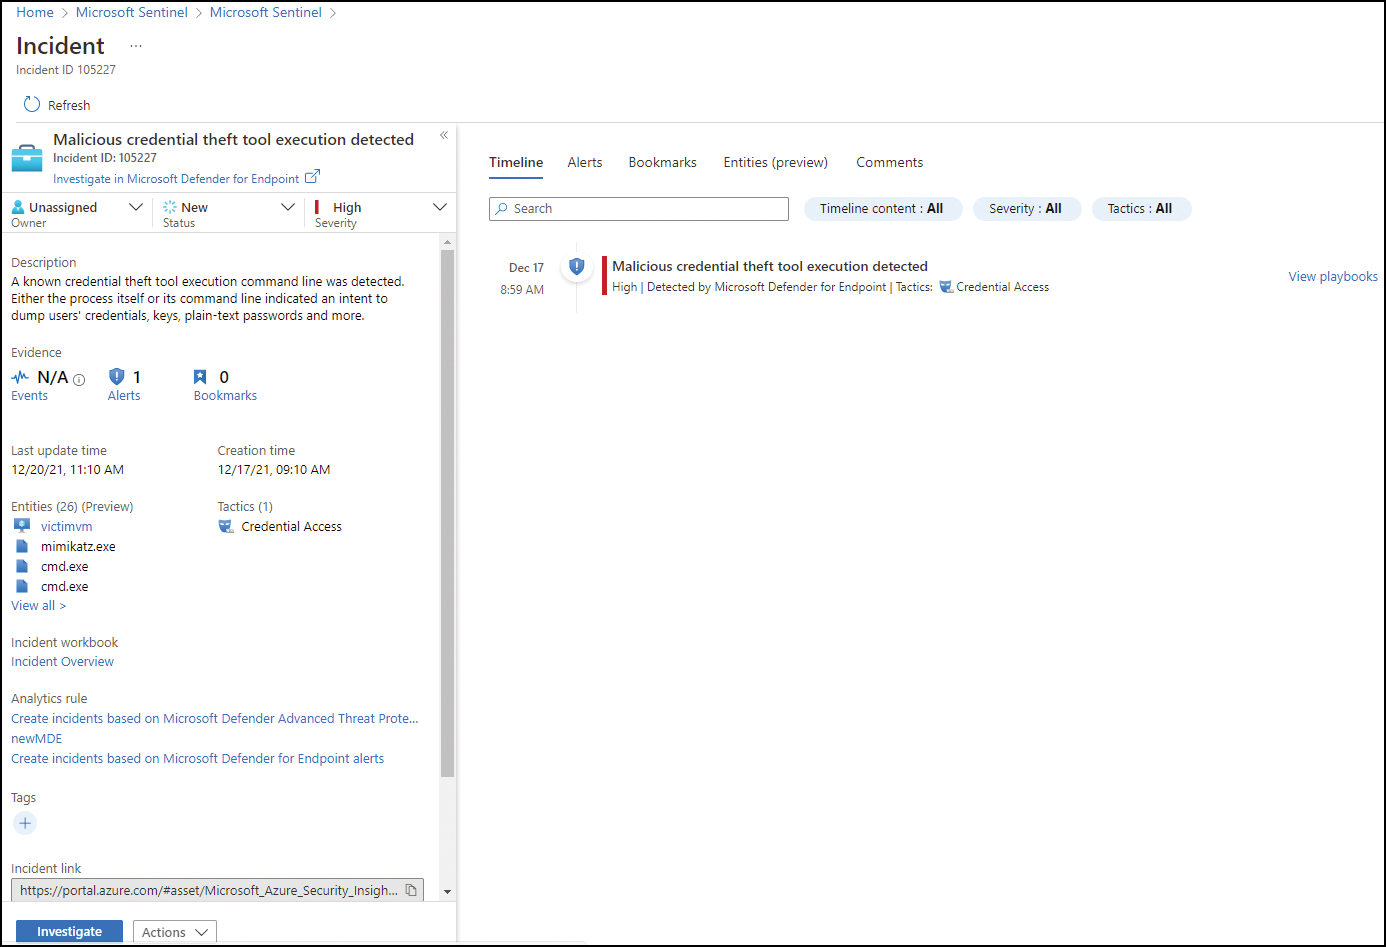
FIGURE 3-54 A full incident
Threat hunting
Threat hunting is the process of iteratively searching through a variety of data with the objective of identifying threats in the systems. Threat hunting involves creating hypotheses about the attackers’ behavior and researching the hypotheses and techniques that were used to determine the artifacts that were left behind.
In a scenario in which a Contoso administrator wants to proactively review the data that Microsoft Sentinel collected to identify indications of an attack, the threat hunting capability is the recommended way to accomplish this task. Proactive threat hunting can help to identify sophisticated threat behaviors used by threat actors even when they are still in the early stages of the attack. To access the threat Hunting dashboard, click Hunting in the Threat Management section on the main Microsoft Sentinel page. Figure 3-55 shows an example of this dashboard.
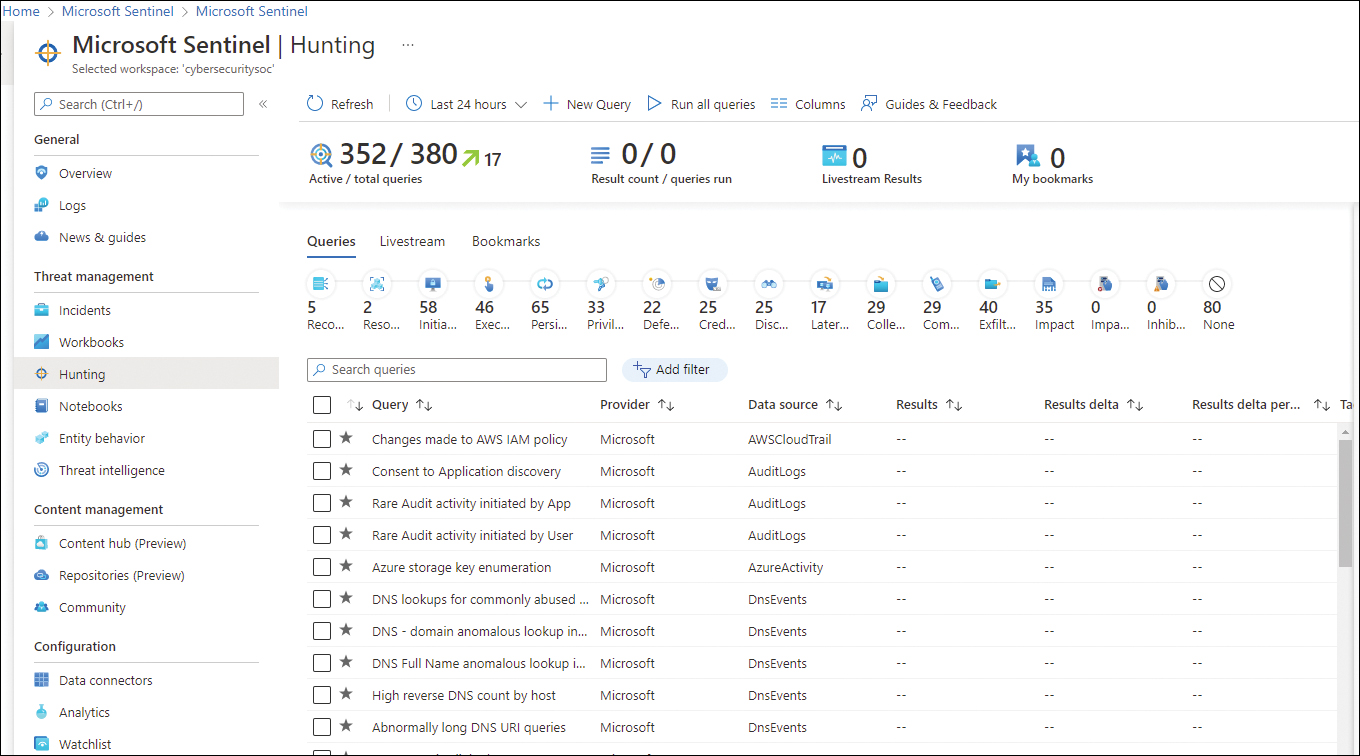
FIGURE 3-55 Hunting capability in Microsoft Sentinel
To start hunting, you just need to select the predefined query, which was created for a specific scenario, and click the Run Query button in the right-hand pane. This pane shows a summary of the results. Click the View Results button to see the full details of the query.
Thought experiment
In this thought experiment, demonstrate your skills and knowledge of the topics covered in this chapter. You can find answers to this thought experiment in the next section.
Monitoring Security at Tailwind Traders
You are one of the Azure administrators for Tailwind Traders, an online general store specializing in various products for the home. As a part of your duties for Tailwind Traders, you need to work with the Security Operations Center (SOC) to ensure that alerts generated by Microsoft Defender for Cloud are ingested in Microsoft Sentinel. The SOC Team also needs auditing information about VM creation, and this information needs to be streamed to Azure Sentinel.
Tailwind Traders has been using Microsoft Defender for Cloud for a while, primarily to obtain alerts. The company now wants to use other capabilities in Microsoft Defender for Servers to reduce the attack surface of its IaaS VMs. One of the requirements is to ensure that management ports are closed by default and will only open when an explicit request is made for a specific period. Because of some internal auditing, Tailwind Traders database administrators also need to have a vulnerability assessment available for the company’s Azure SQL database. With this information in mind, answer the following questions:
Which connectors should be used in Microsoft Sentinel to enable this scenario?
Which feature in Microsoft Defender for Servers will help to reduce the attack surface based on Tailwind Traders’ requirements?
What needs to be done first before enabling SQL Vulnerability Assessment for Tailwind Traders’ databases?
Thought experiment answers
This section contains the solution to the thought experiment.
Microsoft Defender for Cloud and Azure Activity Log.
Just-in-Time VM Access.
First, you need to enable Microsoft Defender for SQL.
Chapter summary
Azure resources logs operations that were executed at the data plane level, while activity logs at the subscription level register operations that were executed in the management plane.
You can customize alerts in Azure Monitor for different data types, including metrics, log search queries, and activity logs events.
Monitoring solutions leverage services in Azure to provide additional insight into the operation of an application or service.
Microsoft Defender for Servers provides built-in vulnerability assessment using native integration with Qualys or TVM.
To enable vulnerability assessment for SQL, you first need to enable the Microsoft Defender for SQL.
The regulatory compliance dashboard in Microsoft Defender for Cloud can be customized to add other standards that are not available out of the box.
To ingest data from different data sources into Microsoft Sentinel, you can use service-to-service connectors or external connectors.