Appendix C. Performance Results
The example programs have shown a variety of alternative techniques to implement the same tasks, such as file copying, random record access, and locking, and it is natural to speculate about the performance advantages of these techniques. Application design requires knowledge of, rather than speculation about, the performance impacts of alternative implementations and the potential performance advantages of various Windows versions, hardware configurations, and Windows features, such as threads, memory mapping, and asynchronous I/O.
This appendix contains tables that compare performance directly on several platforms. There are numerous variations for some tasks; consider, for example, the multiple locking and condition variable combinations. The tables show that performance can often vary significantly among different implementations, but, in other cases, the difference is not significant. The tables also show the effect of multiple processors. The tables here are far more comprehensive than the run screenshots throughout the book, as those tests are usually confined to a single machine.
You can run these tests on your own computer, and the Web site contains all the required executables, DLLs, and shell scripts, as well as a “read me” file.
Test Configurations
Testing was performed with a representative variety of applications, based on examples in the book and a range of host computers.
Applications
The tables in this appendix show the times measured with timep (Chapter 6) for the test programs running on several different machines. The six functionality areas are as follows.
1. File copying. Several different techniques, such as using the C library and the Windows CopyFile function, are measured to determine the performance impact. File copying stresses sequential file I/O without any data processing.
2. Simple Caesar cipher file conversion. This shows the effect of memory mapping, larger buffers, the Windows sequential scan flags, and asynchronous I/O. Conversion stresses file I/O with a small amount of data processing as the data is moved, and converted, from one buffer to another.
3. Word counting. This test set uses the wc program in its single and multithreaded forms. Simple sequential processing is also tested and turns out to be competitive with the two parallel search methods on a single processor. Word counting increases the amount of data processing and minimizes the output.
4. Record Access. This shows the performance differences between direct file I/O (read and write statements) and memory mapping to perform record access in large files.
5. Locking. Chapter 9 discussed several locking models and showed some results, and the table here extends those results.
6. Multithreaded producer/consumer application. This shows the effects of different synchronization techniques for implementing a multithreaded queuing application in order to evaluate the trade-offs discussed in Chapters 8, 9, and 10 among CRITICAL_SECTIONs, condition variables, mutexes, and the signal and broadcast condition variable models.
All application programs were built with Microsoft Visual Studio 2005 and 2008 as release versions rather than debug versions. Running in debug mode can add significant performance overhead. Nearly 80% overhead was observed in one CPU-intensive test, and the debug executable images can be two or three times larger than the release versions.
The VS 2005 builds are all 32-bit, but there are 32- and 64-bit versions of the VS 2008 builds. In most cases, the results are similar when run on a 64-bit computer, but the 64-bit builds allow much larger files and data structures.
Test Machines
Performance was measured on six computers with a wide variety of CPU, memory, and OS configurations. I’ve used a broad range of current and relatively inexpensive machines; nonetheless, anyone reading this list in a few years may be tempted to smile indulgently as technical progress obsolesces these computers.
1. A 1.4GHz Intel Celeron M 1-processor laptop with 1.5GB RAM, running Windows XP SP3 (32-bit). This computer is about 5 years old (as of October 2009), but it is still useful; I’m using it to create this document and expect to use it for years to come.
2. A 2GHz Intel Core2 (2-CPU) laptop acquired in June 2008 with 2GB RAM, running Windows Vista SP2 (32-bit).
3. A new (May 2009) 2.83GHz Intel Core2 Quad (4-CPU) desktop with 4MB RAM, running Windows Vista SP2 (32-bit).
4. A new (June 2009) 2.4GHz AMD Phenom 9750 Quad-Core (4-CPU) desktop1 with 16GB RAM, running Windows Vista SP2 (64-bit). All applications are 64-bit builds. The 64-bit executables are sometimes slower and rarely faster than the 32-bit executables, but they do have the advantage of being able to process large data sets and to map huge files. For a comparison, see test machine 6.
1 Actually, it’s on the floor, but we’ll use the marketing term, and anyhow, the laptops are on the desktop.
5. A 1.7GHz AMD Quad-Core AMD Opteron Processor 2344 HE server with two cores (8 processors total) and 4GB RAM, running Windows Server 2008 SP1 (32-bit).
6. Windows 7 installed on machine 4 to validate operation on Windows 7 and to see if there are any notable performance differences from Vista. All applications are 32-bit builds, whereas the machine 4 builds are 64-bit.
All file systems were less than 50% full and were not significantly fragmented. In addition, the test machines were all idle except for running the test programs. The CPU-intensive applications give a good indication of relative processing speeds.
The timing programs are all in the Examples file so that you can perform these tests on your own test machine.
Performance Measurements
Each application was run five times on the host machine. The batch files clear physical memory before each run of the file access programs so that performance figures would not be improved as the files became cached in memory or the swap file. The tables show the average times in seconds.
Comments are after the tables. Needless to say, generalizations about performance can be perilous because numerous factors, including test program characteristics, contribute to a program’s performance. These tests do, however, show some of the possibilities and show the potential impacts of various operating system versions and different programming techniques. Also bear in mind that the tests measure the time from program start to end but do not measure the time that the computer might take to flush buffers to the disk. Finally, there was no attempt to exploit specific computer features or parameters, such as stripped disks, disk block sizes, multiple disk partitions, and so on.
The Windows performance monitor, available under the control panel’s Administrative Tools, displays CPU, kernel, user, and other activities graphically. This tool is invaluable in gaining insight into program behavior beyond the measurements given here.
The host machine variety also shows the impact of features such as cache size and organization, disk speed, and more. For example, machine 4 (Vista, 4-CPU, 64-bit, 2.4GHz desktop) sometimes outperforms machine 2 (Vista, 2-CPU, 32-bit, 2.0GHz laptop) by factors far beyond what can be explained by CPU count and clock speed alone; see the locking results (Table C-5). In some other cases, the results are nearly the same, as with file copying (Table C-1), which is purely serial. The impact of these features can be difficult, if not impossible, to predict accurately. Ultimately, you need to test your application.
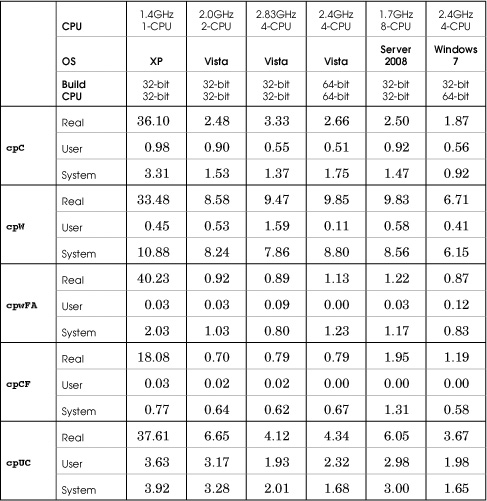
Table C-1 File Copy Performance
One more example will reinforce this point. I recently experimented with a parallelism framework (see Chapter 9) on the 2-CPU Vista laptop (machine 2) and for many programs found consistent performance improvement factors such as 1.5 to 1.9 compared to the serial, single-threaded program. Running on more processors, such as machine 4, gave even better results. However, one test program run on the laptop, a matrix transpose, was consistently slower than the serial version run on the same machine, although the results on other machines were good. The explanation, while not certain, seemed to involve the laptop’s cache architecture.
Finally, here is even more advice. First, do not put too much weight on small performance differences, especially when the total times are small (less than a second, for example). In many cases, such as file copying, results can vary widely from one run to the next. Also, beware of the temptation to gain performance at the cost of correctness; multithreaded applications, for instance, can be challenging to get right.
File Copying
Five file copy implementations copy a 320MB file (5,000,000 64-byte records, generated with Chapter 5’s RandFile program).
1. cpC (Program 1-1) uses the C library. This test measures the effect of an implementation layered on top of Windows, although the library has the opportunity to perform efficient buffering and other techniques.
2. cpW (Program 1-2) is the straightforward Windows implementation with a small buffer (256 bytes).
3. cpwFA is a “fast” implementation, using a larger buffer (8,192 bytes, a multiple of the sector size on all host machines) and the sequential scan flags on both the input and output files.
4. cpCF (Program 1-3) uses the Windows CopyFile function to determine whether the implementation within a single system call is more efficient than what can be achieved with other techniques.
5. cpUC is a UNIX implementation using a small buffer (similar to cpW). It is modified slightly to use the Visual C++ UNIX compatibility library.
While the results are averages of five test runs, the elapsed time can vary widely. For example, cp (first row), with an average of 2.48 seconds in the second column (2-CPU Vista laptop), had a minimum elapsed time of less than a second and a maximum of more than 10 seconds. This wide variation was typical of nearly all cases on all the machines.
Comments
1. The C library gives competitive performance that is superior to the simplest Windows implementation in many cases, but the UNIX compatibility library is slower.
2. Multiple processors do not make a difference, as the implementations do not exploit parallelism.
3. There is no significant difference between the 32-bit and 64-bit build performance (machines 3, 4, and 6).
4. There are elapsed time performance advantages on Vista and Windows 7 machines obtained by using large buffers, sequential scan flags, or a function such as CopyFile.
5. Vista is significantly faster than XP, although the XP laptop may suffer from older disk technology.
6. The Windows 7 times look good compared to Vista on the same hardware platform (machines 4 and 6).
7. Elapsed time results are highly variable, with as much as a 10:1 difference between identical tests run under identical circumstances.
Caesar Cipher File Conversion
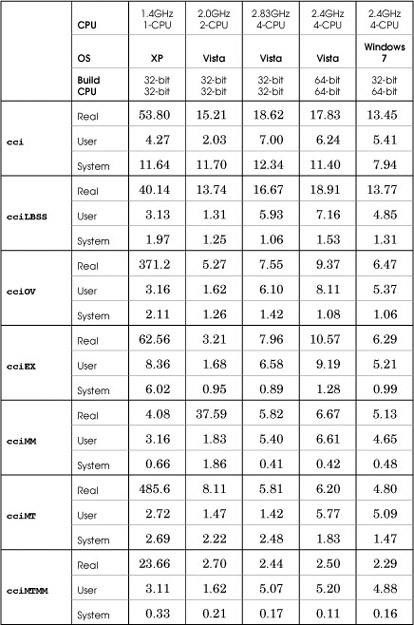
Seven programs tested converting the same 320MB file. Table C-2 shows the results.
1. cci is Program 2-3 and is comparable to cpW using a small buffer.
2. cciLBSS uses both a large buffer and sequential scan flags, and it also presizes the output file to the length required.
3. cciOV, Run 14-1, uses overlapped I/O.
4. cciEX, Program 14-2, uses extended I/O.
5. cciMM uses memory mapping for file I/O and calls the functions in Program 5-3.
6. cciMT is a multithreaded implementation of Chapter 14’s multiple buffer scheme without asynchronous I/O.
7. cciMTMM is a modification of cciMT and uses memory-mapped files rather than ReadFile and WriteFile.
Table C-2 File Conversion Performance
Comments
1. These results show no consistent benefit to using large buffers and the sequential scan flags, possibly in conjunction.
2. The very large cciOV and cciMT times for test machine 1 (Windows XP) are not misprints; these times are repeatable and are only partially explained by clock rate, disk speed, or similar factors.
3. Extended and overlapped I/O performance are excellent on Windows Vista and Windows 7. Notice that the time is predominantly user time and not system time.
4. Multiple threads do not provide any significant benefit unless the threads are combined with memory-mapped files.
5. Memory-mapped I/O can give good performance, except that test machine 2 (Windows XP, 2 processors) showed poor performance consistently. I don’t have a good explanation for this behavior.
Word Counting
Four word counting methods compared the efficiencies of multiple threads and sequential processing (see Table C-3).
1. wc, the Cygwin implementation (a free download from www.cygwin.com), is single threaded but well-implemented.
2. wcMT, a variation of Program 7-1, uses a thread for each file and direct (read/write) file I/O.
3. wcMTMM replaces wcMT’s direct I/O with file memory mapping.
4. wcMT_VTP is the Vista thread pool variation of wcMTMM.
Table C-3 Word Counting Performance
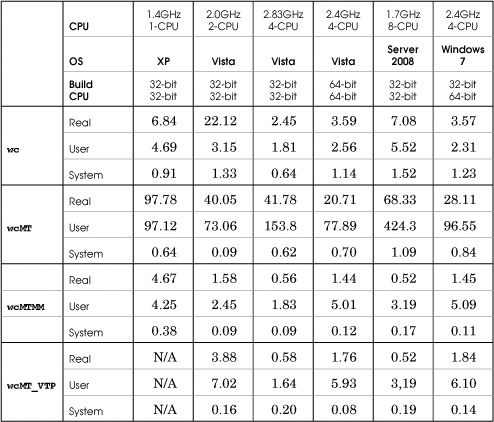
The eight target files used in the test are each 64MB. Using files with significantly different lengths would reduce the parallelism and multithreaded speedup, as some threads would complete sooner than others. However, wcMT_VTP should adjust to this situation and give better results (this would be a good experiment).
Comments
1. wcMT is slow not because of the threads but because of the direct file reading. A single-threaded version showed similar bad results.
2. The Cygwin wc implementation is competitive on a single processor.
3. Memory-mapped files provide a clear advantage, and the threading is also effective.
4. Multiprocessor machines show the performance gains that are possible using threads. Notice that the total user and system times exceed the real time because the user and system times represent all processors. We’ll also see this in other tests.
Random File Record Access
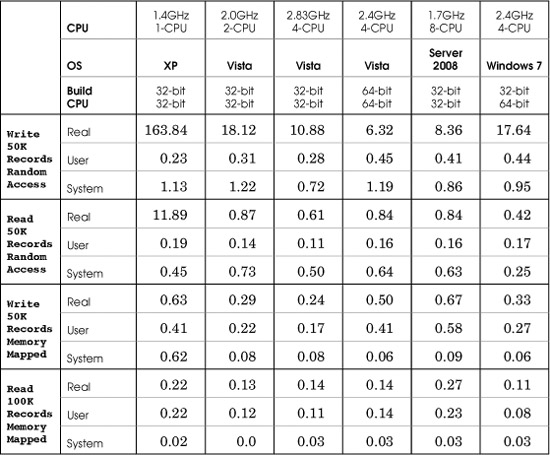
This test set compares RecordAccess (Chapter 3) and RecordAccessMM (Chapter 5). These programs read and write fixed-length records in large, initially empty files. The programs both interact with the user who specifies read, write, delete, or other operations and specifies a record number and data (for write operations). There is no hashing; this record number is an index into the file, as if it were an array.
An additional program, RecordAccessTestDataGenerate, creates text command files to drive the tests. The test set then:
1. Creates empty files with space for 100,000 fixed-length records. The record length is, arbitrarily, 308 bytes.
2. Generates a command file to write 50,000 data records into random locations in the file.
3. Generates a command file to read 100,000 records from the file. Some will not be located, as there are only 50,000 nonempty records.
4. The command files are used as redirected input to both RecordAccess and RecordAccessMM.
Comments
1. Memory-mapped file I/O is always fastest. However, be aware that these tests use small records; you can get different results if your records are larger than the page size.
2. Vista’s random access is much better than XP’s. Windows 7 shows poor random access write performance. This result is repeatable, and there is no apparent explanation.
3. The two programs are single threaded, so multiple processors do not provide an advantage.
Table C-4 Random File Record Access
Locking
The locking tests ran seven of the Chapter 9 stats variations to compare the efficiencies of locking by multiple worker threads (see Table C-5). Chapter 9 lists some partial results. The seven programs, listed in order of expected performance from best to worst, are:
1. statsNS has no locking synchronization, which is valid in this simple program, as there are no shared variables. The NS results show the actual time that the worker tasks require; the remaining tests show the locking overhead.
2. statsIN uses interlocked increment and decrement operations so that locking occurs at the lowest level with atomic processor instructions.
3. statsSRW_VTP uses a slim reader/writer (SRW) lock and a Vista thread pool.
4. statsSRW uses an SRW lock but conventional thread management.
5. statsCS uses a CRITICAL_SECTION, but there is no spin lock adjustment. Spin lock experimentation would be interesting but is not included.
6. statsMX_ST uses a Windows mutex and a semaphore throttle set to the number of processors, or to the number of threads on a single-processor machine. The performance improvement, if any, is marginal with 64 threads but is better with 128 threads (see Table 9-1).
7. statsMX uses a Windows mutex.
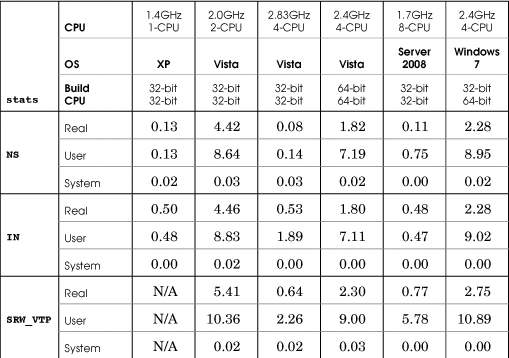
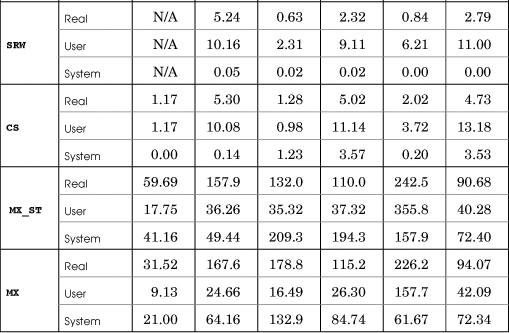
In each case, there were 64 worker threads, with each thread performing 256,000 work units. The results are similar when using more threads or fewer threads, although the differences are harder to distinguish for 16 or fewer threads. The mutex cases (statsMX, statsMX_ST) show the negative impact of more processors contending for the mutex (compare the 4- and 8-processor cases).
See Chapter 9 for more information about these programs and their relative speeds.
Message Passing and Contending for a Single Resource
This test sequence compares different strategies for implementing the queue management functions of Program 10-4, using Program 10-5 (the three-stage pipeline) as a test application. The tests were run on machine 4 (4-CPU, Vista, 32-bit builds) using 1, 2, 4, 8, 16, 32, and 64 threads along with 4,000 work units per thread. Ideally, we would then expect real time to increase linearly with the number of threads, but contention for a single mutex (or CRITICAL_SECTION (CS)) can cause nonlinear degradation as the number of threads increases. Note that these tests do not exercise the file system.
There are six different implementation strategies, and the results are shown in separate columns in Table C-6. The comments following Program 10-4 discuss the results and explain the merits of the different implementations, but notice that the signal model does scale with the number of threads, while the broadcast model does not scale, especially with 32 and 64 threads. Also notice how the broadcast model results in large amounts of system CPU time as multiple threads run, test the predicate, and immediately return to the wait state.
Table C-6 Multithreaded Pipeline Performance on a Four-Processor Desktop
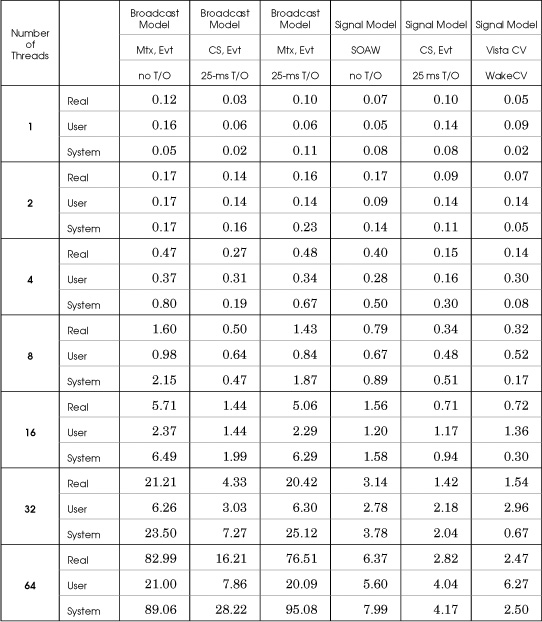
Also notice how CSs compare well with condition variables (the last two columns) in the signal model, even though the CS implementation requires a time-out.
1. ThreeStage. Broadcast model, mutex, event, separate release and wait calls. There is no time-out.
2. ThreeStageCS. Broadcast model, CRITICAL_SECTION, event, separate release and wait calls. The tunable time-out was set to 25 milliseconds, which optimized the 16-thread case.
3. ThreeStage_noSOAW. Broadcast model, mutex, event, with 25-ms time-out.
4. ThreeStage_SIG. Signal model, mutex, event, separate release and wait calls.
5. ThreeStageCS_SIG. Signal model, CRITICAL_SECTION, event, separate release and wait calls.
6. ThreeStageCV. Vista condition variable using WakeConditionVariable (the signal model).
Running the Tests
The TimeTest directory on the book’s Web site includes the following batch files:
• cpTIME.bat
• cciTIME.bat—The word count tests are also in this file
• RecordAccessTIME.bat
• SynchStatsTIME.bat
• ThreeStageTime.bat
The program RandFile creates a large ASCII file used in the first two batch files.
