
16. Representing Designs’ Trajectories and Rationales
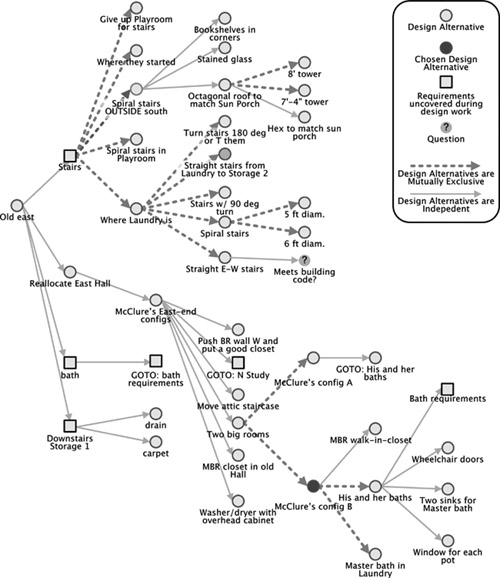
Portion of a Compendium chart for Brooks House Wing design
Sharif Razzaque
In collaboration with Sharif Razzaque
There are many ways of making a fool of yourself with a digital computer, and to have one more can hardly make any difference.
SIR MAURICE WILKES [1959], “THE EDSAC”
Be careful how you fix what you don’t understand.
Introduction
For designers to get the most learning from each design experience, they need to document how it evolves: not only the whats of the design, but also the whys by which it was reached. Moreover, such a rationale document is a priceless aid to system maintainers; it prevents many ignorant mistakes. Documenting trajectories and rationales is much harder than it at first appears.1
Several research groups have tackled the problem of making computer tools to assist in this process.2 So Dr. Sharif Razzaque and I decided to develop a computer representation of a specific design project’s trajectory. We took as our raw material the 235-page prose log that my wife, Nancy, and I contemporaneously kept while designing a 1,700-square-foot addition to our house. (That design project is briefly sketched in Chapter 22. A larger portion of the design tree for this project is posted on this book’s Web site.)
This chapter shares our observations both about the nature of a real design trajectory and about documenting design trajectories. Herein our usage is as follows:
• We for work we did together
• I for work Razzaque did solo
• I for Razzaque’s comments and hypotheses, but
• We when Brooks agrees with them
Linearizing the Web of Knowledge
As Vannevar Bush acknowledged in the design for his proposed Memex system, the representation of all the interrelations among items of knowledge requires a general graph, in general a nonplanar graph.3
But such a graph is difficult to represent and nigh impossible to comprehend. So in all disciplines people linearize the knowledge representation and supplement the linear representation with one or more auxiliary representations.
The process is:
1. Cut edges in the graph until it is a tree. This process imposes a hierarchical order where there was none before, whether that order is wanted or not.
2. Map the tree onto a line in any of the several well-known ways, but usually depth-first.
Consider a book, for example. The subjects it treats are intricately interrelated. But the book itself is perforce linear: page follows page; line follows line; word follows word. So the author organizes the subject matter into a tree and shows the tree in the table of contents: chapters of sections, sections of subsections. The page numbers show the mapping from the tree to the linear form.
The table of contents is, however, not the whole story by any means. In the back of the book is an index, which organizes the book contents alphabetically by term. The page numbers for any given term essentially define a linked chain through the book. The index restores many of the links that were cut in mapping the web of material to the table of contents tree.
The same process yields the organization of a library. The Library of Congress numbering system (or the Dewey Decimal System) maps all the interconnected books to a tree. The tree is mapped via a depth-first traversal to a line, yielding a shelf order. But this mapping is supplemented by multiple indices, each restoring cut links to form chains: an author index, a title index, a subject index.
The subject index is especially interesting because the shelf-order mapping was already based on principal subject. The subject index recognizes that any work treats many subjects besides its principal one.
A Wikipedia article solves this web-structure representation by rich cross-linking, instantaneously accessible. This capability is a significant new addition to our intellectual toolbox.
Any design space has the same sort of web structure, so the representation of designs is challenging. And if designs are difficult to represent efficiently, design processes are inherently more so.
Simon’s Rational Model of design, Chapter 2, seems to assume the existence of a design decision tree that shows at each alternative node the subordinate design decisions occasioned by that choice. Ideally, one would associate with each choice the rationale for that decision. But decisions are interrelated in many complex ways, each with both simple reasons applying to it alone and reasoning that is shared with siblings and cousins.
Our Capture of a Design Trajectory
Our goals were to capture the implicit design tree of the Brooks House Wing design, both to supplement the abbreviated prose case study of that design process in Chapter 22, and to represent the design trajectory through time. More important, we wanted to get insights into the Brookses’ design process:
• How consistent is the log with Fred’s recollections?
• What and where were the struggles?
• When and how did the breakthroughs occur?
• Did Fred and Nancy explore the design tree systematically?
• Do findings from this analysis support the arguments in the rest of this book?
As it turned out, what we learned in trying to reconstruct the design tree is more revealing than the tree itself. In fact, the tree itself yielded disappointingly few insights. This exercise was an experiment that failed.
Our Process for Studying the House Design Process
We started with a search for off-the-shelf software for drawing design trees. We eventually settled on Compendium,4 a tool now primarily intended for recording and focusing the design process as it unfolds.
I seeded the design tree from the notes on the very first page of the log and proceeded page by page, transcribing the notes into nodes and links in the design tree according to a written transcription scheme that I first prepared. We quickly ran into difficulties that forced us to wonder if we were transcribing properly. This led me to tweak the transcription scheme, veering from Compendium’s implied guidelines.
Our process settled into a pattern: Each time we adjusted our transcription scheme, I would go back to page one and rework our Compendium tree to match the new scheme. We would then advance further into the log and inevitably run yet again into a log entry that didn’t fit into our transcription scheme. This would cause us to reexamine
• Our (evolving) transcription scheme
• Our use of Compendium to reconstruct the decision tree
• The design process itself
This process—encountering problems with the transcription scheme, adjusting it, and starting over—happened over and over, every day at first and then less and less frequently. We gradually converged to a better scheme and surrendered to living with the remaining flaws, just so we could make progress transcribing the log into a design tree.
What Is a Design Tree?
It wasn’t until much later that I realized that our problems in finding a transcription scheme for the design tree flowed from our lack of a precise definition of a design tree. My mental definition had been informal, implicit, and vague. The search for a usable tree transcription scheme was also a search for a definition of design tree that would be rigorous, comprehensive, and precise enough to be operationally useful.
Because my definition was informal and implicit, it did not even occur to me to construct a sample pen-and-paper design tree and for it a transcription scheme independent of the software tool.
Our vague starting notion of a design tree matched that in Figure 2-1. This notion is like the tree of options one meets when configuring a built-to-order laptop. Each design question (that is, decision to be made) is a node. Sibling design questions such as “Visibility” and “Alarm” are orthogonal to each other, and the designer must answer each of them. In Blaauw [1997], these are called attribute branches.
Each design-question node has a child node for each of its alternative design options. In the laptop example, one must choose the display size from several options. These options are mutually exclusive alternative branches. The designer chooses one for each independent design question.
Most choices raise more design questions (for example, having decided to use a luminous dial, one must choose its light mechanism). These design-question nodes are children of the previous solution node. Thus such a decision tree includes both independent and mutually exclusive design choices, and the finished product is represented not by the selection of a single node, but rather by the set of many design-alternative nodes, one at the leaf chosen for each independent design question.
To represent rationale within the tree, each option should associate with nodes for its pros and cons. Each design-question node would also have an associated node designating the choice made and why.
This first notion of a decision tree with rationale seemed to fit naturally with Compendium’s predefined node types. I chose this mapping: Each design question was represented as a question icon. Each design alternative was an idea icon. Each idea icon had pro-icon and con-icon children. The alternative chosen became an agreement icon with a why note.
Finally, we thought design questions, even independent ones, should be sorted hierarchically, by house spaces. For example, we expected to group all the Living Room issues under one “Living Room” node to match the structure and labeling of the log entries.
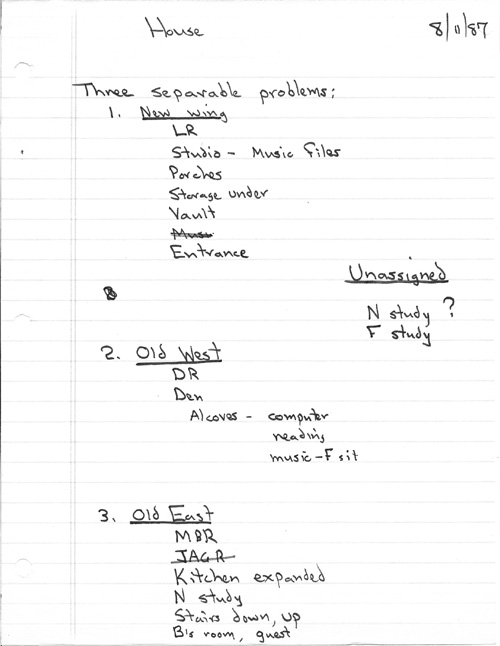
Brooks early on had divided the design task into three separable problems (Figure 16-1).
Figure 16-1 Division of the house wing design task into separable problems
Insights into the Design Process
Design Isn’t Just to Satisfy Requirements, but Also to Uncover Requirements
Page-by-page analysis of the log quickly showed that even though an architectural program had been defined, the requirements were still changing. For example, architect Wes McClure had proposed adding pavilions, one to the north and one to the south.5 The Brookses ultimately rejected this idea because (a) the resulting house did not have any central place where the family would naturally congregate, and (b) the South Pavilion would require removing a precious large black oak tree. But neither the central place nor preserving the oak tree were recognized requirements when McClure devised the pavilions. Analyzing a proposed design solution, the pavilion idea, caused the Brookses to see these requirements.
We see this pattern again and again in the log. Design work doesn’t just satisfy requirements, it elicits them. Our experience resonates with Schön’s theory in Chapter 3. A good design process will encourage this phenomenon, rather than suppress it.
Design Isn’t Simply Selecting from Alternatives, but Also Realizing Their Existence
Once the designer has posed a design question, it’s not usually possible to simply enumerate all the possible alternatives. Some are obvious or preexisting options (perhaps borrowed from exemplars). But others are novel and require breakthroughs. In the log, we see the Brookses struggle between two possible Music Room configurations, and after much analysis and several attempts at tweaking each, neither is deemed acceptable. They discover a third configuration that they instantly like. The log notes: “Config C—A real way forward!”
This pattern also repeats again and again in the log. As Chapter 3 tells, Brooks’s purchase of land from his neighbor was not an obvious solution to the problem of siting the Music Room. A major part of design is realizing that design options exist. Once again our experience resonates with Schön’s theory.
The Tree Changes as the Design Changes—How to Represent That Evolution?
The three separable problems look very much like a laptop configuration tree, except that the lowest nodes are not leaf options, but rather sub-design questions. But the tree indicates that some amount of design has already been done. Why is the Entrance in the New Wing? Assignment to the New Wing, and not the Old West section, is itself a design decision. The tree of the design questions has implicit in it some design decisions.
But as we worked through the log, it became unclear why certain rooms were assigned to one wing versus another during the design process. Brooks then had the insight that he thinks of the house both as the original house (before this construction project) and also as it was finally built. For example, today he thinks of Fred’s Study as a child of the New Wing node, because that’s as built. When he wrote that first log page, Fred’s Study was downstairs, and it was undecided where it would go. But there are many different designs between those stages.
Each of those high-level designs carries with it a different organizational tree structure. As the design changes, the same rooms and parts are grouped under different high-level nodes. For example, the original house and the 1987 design have the Master Bedroom in the East Wing, whereas the final design has it in the New Wing. Which tree structure should we adopt? How do we show the trajectory through time?
Our approach was to hang all nodes off the organizational structure of the as-built house, in order to have a stable structure for the design tree. The final house design is divided into Phase I (in turn subdivided into the New Wing and Old West) and Phase II (Kitchen and Playroom).
Certain design alternatives are necessarily nodes high in the design tree. For example, “Flip house end for end” must be at a level above Phase I and Phase II (or New Wing, Old East, and Old West). But this particular node confuses the reader, because it survived only briefly in the design process. But such a high-level node is always thereafter visible and intrusive.
We considered grouping several such short-lived explorations into a top-level node called “Early Wanderings,” noting that many projects explore several radical designs early on. But abandoned design alternatives occur at each stage of the design. Those abandoned early are really similar to ones abandoned later, except they affect larger portions of the tree; far-reaching changes become fewer and fewer as the design evolves and stabilizes.
The very structure of a decision tree changes over time. Documenting such changes requires a new dynamic tool that doesn’t yet exist. It must track not only how the tree grows leaf-ward over time, but also how nodes and their sub-trees get cut from one branch and grafted into another.
Tree of Decisions versus Tree of Designs
As Figure 2-1 shows, the final complete design (that is, a product) is represented not by a single node in a decision tree, but rather by the set of leaves. From such a tree, it is difficult to visualize what is the best complete design so far on any given day of the design project.
The space of all possible designs is a different tree altogether, where each node specifies a sub-tree of products, alike in all the decisions down to that node, further differentiated below it. We call this the tree of designs. Each leaf is a different complete design.
The tree of designs is combinatorially larger than the corresponding tree of decisions. For example, a decision tree with n independent binary design questions yields a tree of designs with 2n nodes. But for any substantial design this tree will be so large that it seems implausible that a human could construct it, or that doing so would result in any insight. The tree of designs is much too cumbersome for actual use in designing.
But the very concept of a tree of designs is instructive and clarifying. For example, there is an analogy to agile software development: each nightly build corresponds to a node in the tree of designs, and each represents the best complete design thus far.
Modular versus Tightly Integrated Designs
In transcribing the Brooks house decision tree, we found that the selection among a decision’s alternative options is rarely independent of the choices for others. For example, the Music Room could have been in the north or west portion of the New Wing—a high-level decision—but its placement affected the possible placements of the Studies, Living Room, and Kitchen!
This resulted in an awkward decision tree, because some alternative solutions had to be combinations of several attributes. For example, instead of a “Music Room location” decision with a set of simple alternatives, we had these compound alternatives:
Music Room west; Living Room north
Music Room north; Kitchen south
Music Room north; Kitchen north
And even these were not independent of other design alternatives.
In Notes on the Synthesis of Form, Alexander [1964] explains how this tight dependency (that is, lack of modularity) is a disadvantage, because it makes it hard to revise the design. Thus a designer may not just choose among the merits of alternative designs per se, but may intentionally and rightly trade off design quality against the ease of a future modification. This is precisely what Parnas [1979] urges in his extremely fundamental paper, “Designing software for ease of extension and contraction.”6 Moreover, one may need to trade off quality of the design for speed and ease of the design process itself.
Modular designs are more readily represented as decision trees. Indeed, this may be what we mean by a modular design.
On the other hand, complete modularity also has drawbacks. Optimized designs have components that achieve multiple goals. Consider the unibody car: the body is not just for esthetics and holding passengers, it is also the structure. The unibody design is lighter and stronger than a ladder-frame body. But a ladder-framed pickup truck can be converted to an SUV more easily than can a unibodied one.
Compendium and Alternative Tools
We investigated several software packages in hope of finding one suited for reconstructing and analyzing our specific example of a design decision tree. Here’s what we found.
Task Architect
Task Architect7 could indeed be helpful for design, but not in the way we were hoping. Task Architect is a tool to facilitate task analysis—the structured study of how a job is carried out. Examples include both manual tasks, such as installing headlights on a car assembly line, and mental tasks, such as deciding whether to abort a landing.
Thus, for the Brooks house project, Task Architect might have been used to get a better understanding of the Brookses’ use cases (cooking, hosting a meeting, teaching music, and so on). Task Architect is neither designed nor readily adapted for reconstructing the decision tree (but we surely did try!).
Project Management Tools
Like Task Architect, project management tools, such as Microsoft Project, OmniPlan, or SmartDraw, might be useful for the process of designing a system but don’t appear appropriate for representing decision trees.
Critical-path methods such as the Program Evaluation and Review Technique (PERT) are the underlying models of project management tools. PERT seems to support only the Waterfall Model. Because there are no conditional tasks/nodes, the PERT technique implicitly assumes the major design decisions have already been made.8
IBIS and Its Descendants
IBIS (Issue-Based Information System) was designed in the 1980s for collaboratively making decisions and documenting the rationale behind them.9 Like Compendium, it is intended to be used during the decision-making process, to keep design meetings productive and to help identify weak logic.
For each tool we evaluated, I sketched a transcribing scheme to fit our needs to that tool. We first took a quick look at Compendium, and then Task Architect. When we came to IBIS, we found that it very naturally supported many of the fields and node types that we had decided we needed.
IBIS was a command-line program. gIBIS, by Conklin, was a graphical version of IBIS.10 gIBIS would have been more appropriate for our needs than Compendium, but we could not find a version that worked on our computers. Compendium is in fact a descendant of gIBIS. So, back to Compendium.
Compendium
Compendium has many advantages. It is remarkably flexible; it is becoming even more so. An active team of developers is extremely responsive to requests and cries for help. Compendium’s request and bug-tracking database is online and public. A large community of users share a very active online discussion forum. Hence Compendium is always growing to handle new uses.
Nevertheless, in retrospect we can’t recommend this tool either for design itself or for documenting a trajectory and design rationales.
As to design itself, we are concerned that if designers use a structured annotation or software tool during design, it will restrict the ease of having vague ideas, impeding conceptual design. In much in the same way, a CAD tool is too precise for the quick exploration of creative ideas, whereas sketches allow the designer to be vague. Conklin himself noted that gIBIS was too structured and cumbersome for certain creative aspects of the design process.11
For our task of reconstructing the decision tree, I don’t think Compendium is the most appropriate software tool. Our final transcription scheme ended up being very different from Compendium’s target usage. Rather than using Compendium’s affordances to help me reconstruct the design tree, I had to find creative ways of repurposing Compendium’s features (such as using Compendium’s Reference node to describe requirements).
Beyond that, our trees (even with great efforts to reduce their size) appear much bigger than Compendium’s user interface readily accommodates, and this design task was small compared to most substantial software projects. It is difficult to find nodes in such large trees, and even harder to print or graphically export them.
Our final transcription scheme uses
• Work-arounds for Compendium’s structures
• Our own self-enforced structures to ensure a consistent design tree, rather than Compendium’s
Hence I believe that a generic diagramming tool, with features such as automatic layout of trees, automatic rerouting of relationship arrows, and searchable associated notes, is better suited to tree capture. Microsoft Visio or SmartDraw might be such a choice.
DRed12—A Tantalizing Tool
The biggest success story we’ve heard about in computer-aided design rationale documentation is the widespread use of DRed at Rolls-Royce (RR). DRed was developed by Rob Bracewell at Cambridge University’s Engineering Design Centre, under the sponsorship of Rolls-Royce, BAE Systems, and the UK Engineering and Physical Sciences Research Council.13
DRed is designed for capturing design rationales as decisions are made. Its conceptual structure is quite like that of gIBIS. In use, it looks very similar to Compendium. But because it has been used primarily for rationale capture, DRed’s evolution has focused on that function, as distinguished from facilitation of design meetings.14
Adoption of DRed in RR was radically facilitated because there was already a strong rationale-capture culture in RR. (The project’s other sponsor, BAE Systems, has not had such a culture, and DRed has not been widely adopted there.) RR engineers were already required to write a design-rationale prose report. The big step was a management rule that allowed project teams to do a DRed document instead of the previously required prose report. DRed documentation is much easier to do.
As Marco Aurisicchio relates, the adoption at RR has been extensive. Aurisicchio is Cambridge’s point person for the relationship with RR and is most familiar with how RR uses DRed. He teaches many of the use courses at RR. Michael Moss, of the RR corporate staff, is RR’s point person for DRed, to whom RR engineers go for direct support. He also filters and prioritizes feedback to Bracewell’s team at Cambridge. In Brooks’s view, this dedicated two-person link between users and builder has played a major role in DRed’s success.
Use modes vary by group, but it is common for DRed content to be created on a whiteboard during a design meeting. Then one person is tasked to turn the captured whiteboard sketches into formal DRed documentation. DRed is also created during solo design sessions. It is used for both conceptual and detailed design. Designers, reviewers, and downstream manufacturing engineers use DRed themselves, always without a facilitator.
About 30 percent of all RR engineers, some 600 in several divisions and in RR labs across the world, have had at least short-course training in DRed use. New engineers learn RR engineering practice in a six-week project course, in teams of four. A typical project is a real problem that some group wants solved and doesn’t have the manpower to do; but not an essential project, so trainees are allowed to fail.15
The largest DRed tree the Cambridge team has seen comprised 190 charts, with an average of 15 nodes per chart. There is also for such projects an overview chart, with a node for each of the detailed charts.
Of course, RR’s designs evolve. Their DRed charts and other documents evolve with the design. The DRed charts are very useful to both presenters and reviewers in the multiple reviews. The DRed document is not itself under formal revision control. Formal RR revision control is seen as so cumbersome that “if DRed were under it, DRed wouldn’t be used.”
A widespread use the developers never imagined for DRed is as a tool for steering and documenting the diagnosis of faults by product engineering groups responding to field reports from all over the world. “Here’s the data as to when, where, and how the engine quit, and all the readings captured then. Now, what caused it?”
Unfortunately, DRed is not generally available. RR and BAE Systems own the intellectual property, and they currently choose to keep it proprietary.
Notes and References
1. MacLean [1989], “Designing rationale,” and Tyree [2005], “Architecture decisions,” argue for rationale capture. Moran [1996], Design Rationale, is a rather complete compendium of the published papers on design rationale. Madison [1787], Notes on the Debates in the Federal Convention of 1787, is a stunning example of complete rationale capture. Madison’s text is also available on the Web at http://www.constitution.org/dfc/dfc_0000.htm.
2. Noble [1988], “Issue-based information systems for design”; Conklin [1988], “gIBIS”; Lee [1993], “The 1992 workshop on design rationale capture and use”; Lee [1997], “Design rationale systems”; Bracewell [2003], “A tool for capturing design rationale”; Burge [2008], “Software engineering using RATionale.”
3. Bush [1945], “That we may think,” the great paper proposing a Memex system with generalized linking and personalized link trails through a knowledge graph much like today’s World Wide Web. The technology proposed was primitive, but the concepts are visionary and prescient.
4. Shum [2006], “Hypermedia support for argumentation-based rationale”; http://compendium.open.ac.uk/institute/, accessed July 25, 2009.
5. See the plans in Chapter 22.
6. Parnas [1979], “Designing software for ease of extension and contraction,” uses a tree of designs as its basic framework.
7. http://www.taskarchitect.com/index.htm, accessed July 25, 2009.
8. This isn’t exactly right—PERT can help a manager choose among design alternatives, based on the schedule implications for each.
9. Noble [1988], “Issue-based information systems for design.”
10. Conklin [1988], “gIBIS.”
11. Conklin [1988], “gIBIS,” 324–325.
12. This section is based on a joint interview of Bracewell and Aurisicchio by Brooks on June 19, 2008. Brooks saw a full demonstration that showed the system capabilities.
13. Bracewell [2003], “A tool for capturing design rationale.”
14. Aurisicchio et al. [2007], “Evaluation of how DRed design rationale is interpreted.”
15. UNC–Chapel Hill’s software engineering project course applies exactly the same criteria for project selection from real users.