
Charitable Giving
James Andreoni* and A. Abigail Payne†, *University of California, San Diego, USA, †McMaster University, Hamilton, Ontario, Canada
Abstract
This Chapter summarizes the overall facts about charitable giving. Charitable giving has remained an active and important area within Public Economics. Then also discusses about the four main approaches one could take to research on charitable giving. The first approach is to look at giving as a simple individual economic decision, where a quantity of gifts to supply is determined by maximizing a utility function subject to a budget constraint. The second approach is to think of giving as a strategic interaction, with many actors involved. The third and potentially very fruitful approach based on giving as a social exchange. The request may come from a friend, a co-worker, a door-to-door solicitor, a phone call from a fund drive, an on-air campaign from public broadcasting, a television commercial with an emotional appeal, or even from a news report during a time of a disaster. Finally, the fourth and newest approach: giving as a response to conscious, or perhaps even unconscious, empathic, moral, or cultural urges.
Keywords
Fundraising; Taxable income; Taxpayer; Endowment; Leadership gifts; Social welfare; Peer pressure; Matching illusion
1 Introduction
Charitable giving has remained an active and important area within Public Economics since researchers like Martin Feldstein and coauthors published some of the first policy studies on the topic in the 1970s.1 Today, our knowledge on charitable giving draws from important research in applied econometrics, economic theory, game theory, and experimental and behavioral economics.
The applied econometrician, looking either at individual tax returns, survey data, or tax returns of the charities themselves, is interested in how economic variables influence or are correlated with giving. Do givers respond to tax incentives? How does giving change with income? How do receipts of charities vary with dollars spent on fundraising? Do government grants to charities affect the dollars raised by charities and through what mechanism?
The economic theorist is confronted with the issue of what form preferences take. Since charities have primary properties that are similar to public goods, a natural model of charities is as a privately provided public good. However, free riding provides a strong incentive in these models, leading to predictions of very little giving. But most households give something to charity each year, and in many countries average giving is a significant fraction of income—nearly 2% in the US, for instance. This would indicate that motives other than a pure interest in charitable output itself are involved in the decision to give. Unfortunately, these other motives are difficult to detect in survey or tax return data.
With this quandary as a backdrop, much of the recent theoretical, experimental, and behavioral research on giving has focused on identifying the underlying motives. Careful thinking on the theoretical side is necessary to generate hypotheses that can be confronted with data. Since naturally occurring data often lacks the specificity to test theories, data must at times be collected under some experimental control, either in the laboratory or in the field. This branch of the literature on charitable giving is the source of some of the greatest insights and the greatest promise and, in recent years, greatest growth in research.
Once one has a better handle on the underlying preferences for giving, the theorist can begin to tackle broader issues regarding policy toward charitable giving. How does the charitable sector overcome the free rider problem? What are the strategic responses in the market for giving among all the players? Does competition among charities spark efficient innovation or wasteful fundraising? What is the optimal tax policy toward charitable giving, and how can it take advantage of these naturally occurring preferences and institutions to maximize efficiency?
The importance and popularity of research on charitable giving is evidenced by a number of recent review articles. Andreoni (2006b) provides a lengthy summary of research from the prior 25 years of study. List (2011) gives a cogent account of innovations in the study of charity markets since 2006, and in between numerous other chapters and reviews have also appeared.2 Given the availability of other summaries of findings in the literature, this Handbook chapter will be more thematic, programmatic, and prescriptive than what is common for chapters of its type. Certainly we will highlight the main contributions since 2006, but we will use these to construct a lattice for how we think future work in the area would be most informative and productive, highlighting unpublished as well as published works. We hope to provide the new reader with a perspective on the current state of the literature, and for the experienced reader, we hope to point to new and important questions that remain unanswered.
The next section will give a brief summary of the overall facts about charitable giving, in the US and internationally. This will lay out the main facts to be explained or captured in the research. We will then discuss four main approaches one could take to research on charitable giving, highlighting the primary questions and limitations of each approach. Of course, all approaches have value and none in isolation can answer every question.
The first approach is to look at giving as a simple individual economic decision, where a quantity of gifts to supply is determined by maximizing a utility function subject to a budget constraint. This is a natural place to begin and allows an easy framework for approaching simple survey data from individuals, and for identifying simple and important policy goals.
The second approach is to think of giving as a strategic interaction, with many actors involved. This market view of giving suggests that donors are choosing gifts, charities are choosing fundraising efforts and mechanisms, and if the government is involved it is choosing grants to charities and subsidies to donors.3 A fourth player may also be at work: charitable foundations. Foundations are a kind of charitable intermediary. They collect contributions, often qualifying the donor for a tax benefit, and only later spend these dollars on the “end producer” of the charitable goods and services. All four of these types of participants can be acting in response to the choices of the others. We will discuss new theoretical and empirical studies that take account of these interdependencies.
Recently scholars have added a third and potentially very fruitful approach based on giving as a social exchange. In particular, a charitable contribution is rarely made in the absence of an overt request to give. The request may come from a friend, a co-worker, a door-to-door solicitor, a phone call from a fund drive, an on-air campaign from public broadcasting, a television commercial with an emotional appeal, or even from a news report during a time of a disaster. Moreover, when giving is to some degree visible by others, it complicates the social interaction with a league of new influences. What, for example, will someone watching infer about a giver’s character? The important thing about social interactions is that they are likely to be central to understanding changes in giving. While once one becomes a giver, simply answering annual appeals may be a way of “planning” responsible degrees of altruism, if we are to discuss what affects a change in giving, we will need to address the question, “What makes one become a giver in the first place?” The inherent sociality of giving, we conjecture, will be a part of this answer.
This leads naturally to the fourth and newest approach: giving as a response to conscious, or perhaps even unconscious, empathic, moral, or cultural urges. These are the kinds of urges that psychologists, biologists, and anthropologists tell us distinguish humans from most other animals. We tend to have heightened senses of empathy, we are governed more by internal—yet socially agreed upon—notions of justice, and we are concerned with the moral impressions we leave with neighbors and acquaintances. These are all true even though, as a species, we are far removed from the environments that likely implanted these values in our psyche: competing for survival in small communities of clan and kin. Understanding how these pressures are presented today, we conjecture, will be key to the next generation of research on altruism, giving, fundraising, and markets for charity.
How does all this research feed into prescriptions for policy? Historically, there have been two main policy questions regarding charity: What is the price elasticity of giving, and do government grants crowd out private donations? While these questions remain relevant today, recent work has broadened the kinds of policy issues economists face. Most central to these are issues related to fundraising and institutional design. For instance, scientific research can be supported through government taxation and grants to scientists by institutions like the National Science Foundation, or through private foundations that mimic the NSF but are funded through tax-deductable donations. One requires distortionary taxes to fund, while the other may create deadweight loss through the costs of fundraising. The incidence of the two is also quite different—those with high demand pay more under private provision, but their preferences are also more heavily weighted than low demanders. The more we understand these social and financial costs of fundraising, the more we can say about how best to organize society to provide needed social goods.
A related pedagogical issue arises about fundraising. Many studies and experiments help us to understand why people give and what triggers a gift. While this helps us understand foundational economic questions, such as the psychic costs of saying “no” to a fundraiser, it also often yields information that can help fundraisers increase donations. There are two delicate issues here that economic research has yet to debate. First, one must resist the inference that anything that increases donations is good for society. The role of the public economist has always been to find the greatest good for the greatest number, and fundraising for charity is just one of many institutional forms for supporting these goods that are available to society. Second, do we as economists have an obligation or even an interest in uncovering new methods that help charities raise more dollars? We don’t study how for-profits could improve revenues, so if the objective of a study is to find better fundraising methods for non-profits then it is incumbent upon the scientist to argue that it is in the social interest to do so.
2 Background: Facts and Figures on Charitable Giving
Here we summarize the within and between country differences in charitable giving. This seemingly straightforward task is, unfortunately, difficult to accomplish, as data sources vary in the frequency and methods of their collection, and in the fidelity of the reports. Nonetheless we make our best attempt to characterize the general facts about giving.4
Looking at giving as a percent of GDP in 2005, Charities Aid Foundation (2006) ranked the US highest (1.67%), followed by the UK (0.73%), Canada (0.72%), Australia (0.69%), and South Africa (0.64%).5 At the lower end of the scale were France (0.14%), Germany (0.22%), and Turkey (0.23%). These numbers, however, are based on values of reported donations by individuals. This is but a partial picture of philanthropy. Philanthropy also encompasses donating time, helping a stranger, participating in a community event, and even helping one’s family members. Creating measures that compare giving across countries is difficult if countries and/or cultures value these types of giving differently. Depending on the method used to measure giving, which country is more generous will vary. For example, consider the World Giving Index developed by the UK Charities Aid Foundation (CAF) using world survey data collected by the Gallup organization. The index is based on surveys of 150,000 individuals from 153 countries. The following three questions formed the basis of the index: In the month prior to the survey being complete6: (i) Have you donated money to a charity? (ii) Have you volunteered your time to an organization? (iii) Have you helped a stranger or someone you did not know who needed help?
Based on the responses to these questions, CAF assigned to each country a number to reflect their level of giving behavior for 2010 and 2011. As with any survey, however, there are many possible avenues for inaccuracies, and indeed there is a great variation in the index across these 2 years. For example, in 2010 the US ranked fifth in overall giving; in 2011, the US ranked first. The top countries for giving money include Thailand, the UK, Ireland, the Netherlands, Hong Kong, Indonesia, Morocco, Australia, Iceland, and Malta (the US in 2011 was tied for tenth place). Georgia, Russia, Madagascar, and Cote d’Ivoire are at the bottom. The top countries for volunteering are Turkmenistan, Liberia, Sri Lanka, Tajikistan, the US (fifth place), Guinea, Nigeria, Philippines, Uzbekistan, and Myanmar. Greece, Serbia, Croatia, and China are at the bottom. And the top countries for helping a stranger include Liberia, the US (2nd), Ghana, Sierra Leone, Nigeria, Senegal, Sudan, New Zealand, Qatar, and Australia. Madagascar, Rwanda, Burundi, Albania, Indonesia, and Japan are at the bottom.
These statistics illustrate that giving and perceptions about giving vary across the world. They also illustrate that there is no single measure that fully captures generosity or giving.
Next we ask, how has giving changed over time? Let us start by looking at data for the United States. Our numbers are drawn from the annual publication, Giving USA 2012. The analysts for this publication draw their data from several sources and then apply an econometric model to estimate how the general population behaves. This is necessary because there is no single source for identifying either individual donations to charity or the recipients of the donations. For example, reported giving on tax returns only identifies the giving of those with taxable income who itemize. Charity tax returns are only required by organizations that meet a minimum threshold for income and are not religious. Given there is no single source that allows us to measure giving and the charity recipients of the gifts in the US, the figures in the Giving USA 2012 publication represent the best guesses of trained analysts.
In 2010, total contributions to charity by individuals, corporations, foundations, and through bequests were estimated at nearly $296 billion in the US, an increase of approximately 2% over the previous year after adjusting for inflation. The increase in 2010 over 2009, however, came after a 2-year decline in giving. Over the last four decades (1970–2010) the biggest increase in real growth occurred in the late 1990s and again around 2007. These patterns are shown in Figure 1. Giving by individuals as a share of their disposable income has varied over the period but for the most part has hovered around 2% (minimum of 1.7% in the early 1990s; maximum of 2.4% in the mid-2000s). While a high percentage of individuals give to charity today, there is great variance in the levels of giving. Many people give a small amount and a few people give a large amount. There is also variation in the types of charities to which individuals give. For example, as will be shown below, the largest recipient of charitable donations are religious organizations. These gifts come largely from lower income individuals. If one studies individuals that gave more than $1 million, their gifts go mostly to education and health-related organizations.7
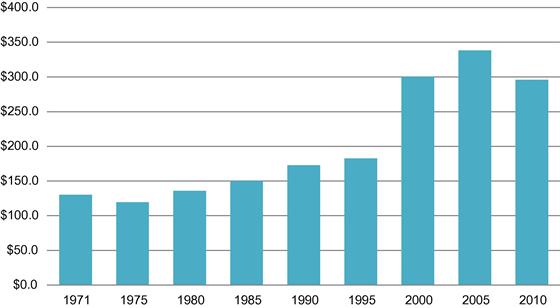
Figure 1 Annual giving by private sources, 1970–2010 $ billions (real, base year 2011). (Source: Giving USA 2012: The annual report on Philanthropy, giving USA.)
In Figure 2, we show the share of private giving by type across four groups: individual giving, giving through bequests, giving by foundations, and corporate giving. The striking phenomenon is that the share of giving from private individuals has declined and the share of giving by foundations has increased over time. While the data currently available make it difficult to understand this trend, there is a sense that the growth in foundation giving may be attributable to a growth in giving by higher wealth individuals who choose to first direct their giving to a foundation and then to use the foundation as a vehicle for giving to charities.
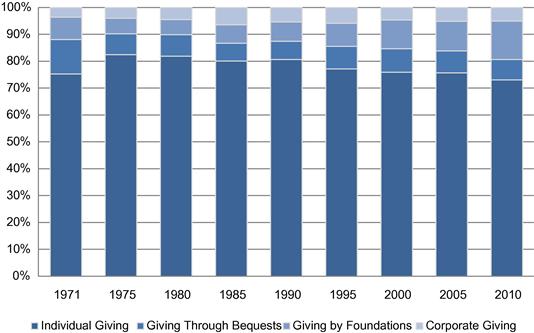
Figure 2 Share of private giving, by type of donor, 1970–2010. (Source: Giving USA 2012: The annual report on Philanthropy, giving USA.)
The above figures are similar to those observed in other countries, especially Canada and the UK. Using tax returns filed in Canada by individuals that reside in urban areas, we can depict the level of giving across neighborhood types defined by the average household income for the neighborhood (defining a neighborhood as a postal code area that covers approximately 5000–8000 households). Figure 3 depicts the total reported charitable giving by individuals for neighborhoods broken down into income terciles. Giving by those living in higher income neighborhoods has grown much faster in the 1990s and early 2000s than for the other two groups.
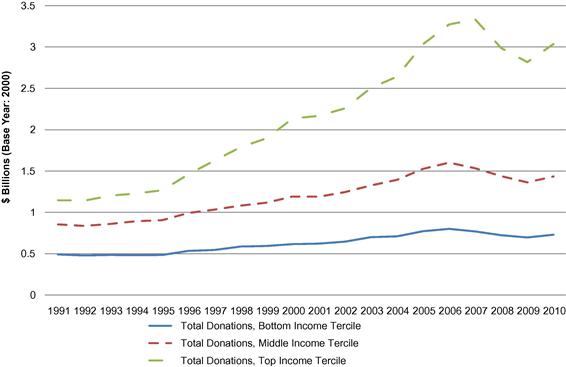
Figure 3 Reported tax receipted gifts in Canada by neighborhood income grouping. (Source: Data at neighborhood level for reported giving on individual tax returns, statistics Canada, as modified by public economics data analysis laboratory, McMaster University, 2012.)
Notice that Figures 2 and 3 are pointing to an interesting pattern. Giving is becoming increasingly concentrated with the wealthy, either through individual giving or from foundations. In the US, the number of foundations increased by 54% between 1999 and 2009, to over 120,000 (National Center for Charitable Statistics, 2011, Nonprofit Sector in Brief: Public Charities, Giving, and Volunteering). In Canada, foundations grew by 74% between 1992 and 2008, from 5400 to 9400. This raises interesting questions about the influence of foundations on giving by others and in promoting the stability of the charitable sector.
While tax laws impose some requirements around the distribution of funding, foundations are able to harbor their endowments well into the future. They have flexibility in how they use their funds intertemporally, and in how they target funding to support certain types of charitable activities. Increasingly, however, we are observing foundations taking on a bigger policy role in that they can influence charity activity and can use their funds to leverage donor behavior. One example of this leverage is the lead that has been taken by the Gates Foundation to focus on big issues (e.g., eradication of polio, fixing the public educational system) and to encourage others to match their funding. For example, the Gates Foundation teamed up with Rotary International and encouraged Rotary groups all over the world to raise funds in support of eradicating polio.
In a broader context, foundations and well-positioned individuals can influence charitable giving. An example of the dynamics of using wealth and/or prestige to influence giving is found in the activities being undertaken by the Clinton Global Initiative (CGI). While CGI is not an organization to which individuals can donate, it views itself at the “eBay of philanthropy, bringing together buyers and sellers in the world of giving.” (“How Clinton Changed Philanthropy,” Time Magazine, October 1, 2012, page 32). The CGI seeks to influence giving by promoting philanthropic policies and raising awareness of issues that can affect the decisions of donors about what causes to support. The CGI is an example of how social networking by influential individuals (versus direct donations) can affect the growth of certain charities and the direction of charitable giving in a significant way.
If wealth that supports charities is held in the hands of a few, this can create a greater divide between charities with significant assets and those with virtually none. Despite the large numbers of charities in the US and elsewhere, most charities operate on very small budgets and have few if any assets. In 2010, for instance, 16.5% of charities reported total expenditures greater than $1 million; 45% of charities reported expenditures less than $100,000. These statistics exclude the very small charities (Urban Institute, The Nonprofit Sector in Brief: Public Charities, Giving, and Volunteering, 2012). If tax policy promotes giving by those with higher incomes and greater wealth, then it is important to understand how these policies affect charity operations. For instance, if donors with greater wealth support bigger charities, then we will observe a greater divide between charities with and without sufficient capital to operate. This hypothesis would hold up if there is a strong correlation between the wealth of the benefactors and charity size.
While most charities would not begrudge funding from any donor, if charities are reliant on a few major donors, this places them in a vulnerable position. For example, if the few donors change preferences or change their behavior with external events (like changes in the economy, or natural disasters) this could cause gifts to swing across charities, making the charities too vulnerable in the whims of their financiers.
Who are the recipients of these contributions? In 2010 there were close to 1.3 million 501(c)(3) organizations in the US—this excludes churches, nonprofits, and social enterprises. In the last decade, the number of charities has grown by close to 59% (from 632,000 in 1999). Other types of nonprofits, those classified as 501(c) but not 501(c)(3), experienced very little growth (approximately 3%).8 The types of nonprofits that benefit the most from private giving are those in the area of religion, which accounts for 35% of the total contributions. Educational organizations are the second biggest recipient (14%), followed by foundations (11%), human services (9%), health (8%), and public-society (8%). Contributions to other types of charities (arts, international affairs, environment, and animal-related organizations) accounted for less than 5% of private giving. Figure 4 illustrates these differences and the growth in giving by charity type for US charities between 1970 and 2010.
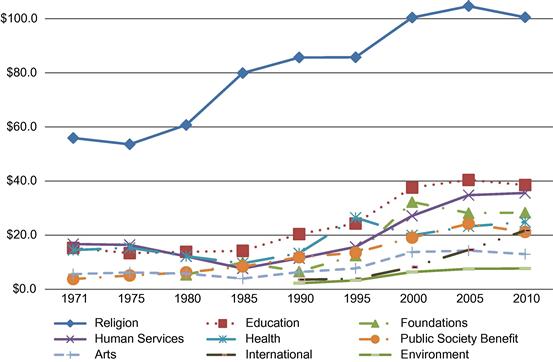
Figure 4 Total private giving by charity classification, $ billions (2011 base year). (Source: Giving USA 2012: The annual report on Philanthropy, giving USA.)
Figure 4 illustrates that religious giving dominates other forms and, perhaps, should be analyzed separately from other types of giving. For example, do individual donations to churches respond to tax incentives the same as other forms of giving? The figure also illustrates difference in the contributions and growth (or lack thereof) in contributions across sectors, demonstrating that one might want to explore these sectors separately when studying the impacts of tax and other policies. Second is the growth foundation giving. In 1980 this was the smallest of the categories, but by 2010 it was the third largest category, just below gifts to education-based charities.9 We will return to these and other issues throughout the discussion below.
3 Approach 1: Individuals
We begin this section by briefly reviewing what we have learned through controlled experiments and how this helps to better frame a characterization of preferences. We then turn to econometric applications of this approach to data on individuals.
3.1 Preferences for Giving
Consider an individual i with post-tax income ![]() who consumes a composite private numeraire good
who consumes a composite private numeraire good ![]() and gives
and gives ![]() dollars to charity. With n individuals, let
dollars to charity. With n individuals, let ![]() be the total contributions to the charity. If individuals gain utility from only the final output of the charity, sometimes called pure altruism (Andreoni 1989), then G is a public good. The natural first model, therefore, is to assume preferences
be the total contributions to the charity. If individuals gain utility from only the final output of the charity, sometimes called pure altruism (Andreoni 1989), then G is a public good. The natural first model, therefore, is to assume preferences ![]() . As shown by Bergstrom, Blume, and Varian (1986) and Andreoni (1988), such a model leads to many absurd conclusions, including that only a sliver of the population should be contributors to the charity. Hence, any model that is going to capture the empirical findings is likely going to require that individuals, through some means, experience greater utility from their own contributions than those of others, that is,
. As shown by Bergstrom, Blume, and Varian (1986) and Andreoni (1988), such a model leads to many absurd conclusions, including that only a sliver of the population should be contributors to the charity. Hence, any model that is going to capture the empirical findings is likely going to require that individuals, through some means, experience greater utility from their own contributions than those of others, that is, ![]() , where utility is increasing in the third argument.10 This impure altruism was (somewhat pejoratively) dubbed warm-glow giving by Andreoni (1989, 1990).11
, where utility is increasing in the third argument.10 This impure altruism was (somewhat pejoratively) dubbed warm-glow giving by Andreoni (1989, 1990).11
Evidence for a warm-glow has come from many quarters. Laboratory experiments find responses to manipulations that most often support a basic “joy of giving” explanation. A laboratory experiment by Crumpler and Grossman (2008) showed that 57% of subjects made a contribution to charity, even though the contribution had no impact on the dollars received by the charity, but only on the composition of the dollars given—the subjects’ contributions completely displaced the experimenter’s contribution. This strongly supports a warm-glow. Tonin and Vlassopoulos (2010) look for a warm-glow in a real-effort field experiment on pro-social behavior. Using a manipulation similar to that of Crumpler and Grossman, these authors tell subjects that a charity will get ![]() regardless of the subject’s actions, but that the more effort the subject chooses the more of this
regardless of the subject’s actions, but that the more effort the subject chooses the more of this ![]() will be credited to the subject. They find that this manipulation creates a significant increase in effort. Many other laboratory tests find similar patterns in which own and others’ contributions are not perfect substitutes, as the warm-glow hypothesis requires.12 Konow (2010) develops a model of warm-glow that is founded on affective (emotional) states. He shows in theory and experiments that not all giving is the same—those gifts connected with a greater sense of need or deservingness also create more warm feelings. In a theme we will return to when discussing the fourth approach, giving and the utility of the warm-glow depends critically on the context, the need, and the impact of one’s donation. That is, the utility of the warm-glow is not separate from the altruistic concern one has for the recipient.
will be credited to the subject. They find that this manipulation creates a significant increase in effort. Many other laboratory tests find similar patterns in which own and others’ contributions are not perfect substitutes, as the warm-glow hypothesis requires.12 Konow (2010) develops a model of warm-glow that is founded on affective (emotional) states. He shows in theory and experiments that not all giving is the same—those gifts connected with a greater sense of need or deservingness also create more warm feelings. In a theme we will return to when discussing the fourth approach, giving and the utility of the warm-glow depends critically on the context, the need, and the impact of one’s donation. That is, the utility of the warm-glow is not separate from the altruistic concern one has for the recipient.
Perhaps the most convincing and provocative evidence for warm-glow comes from the neuroeconomics experiments done by Harbaugh, Mayr, and Burghart, published in Science in 2007. Subjects were told that some of their payment fee of $100 would be donated to charity involuntarily in some cases, as in the case for taxation, or only if they approved in other cases. Even though the outcome for the charity was the same in both scenarios, the subjects’ brains reflected significantly greater pleasure when the choice was made voluntarily. The effect was shown within subjects. A surprising finding, however, is that subjects preferred larger donations to smaller ones, even when they were made involuntarily. That is, people enjoy giving through taxation or voluntarily, but they enjoy the latter the most. This is precisely the foundational assumption of the model of warm-glow giving.
3.2 Analysis of Data on Individual Givers
One way of encouraging giving is to lower its price. Many countries provide some form of an income tax credit or deduction for giving. In the United States, for example, tax filers who itemize deductions may claim charitable donations as a deduction against taxable income. With a marginal tax rate of t, this creates a price of 1−t, that is, a gift g only costs the giver (1−t)g out-of-pocket. This has led to a surfeit of research measuring the compensated elasticity of giving, effectively asking the question, if there is a 1% change in price, 1−t, how responsive is giving, g. Bakija and Heim (2011) summarize this research and provide the most recent estimates of the price elasticity using a panel data set of individual tax returns spanning the period 1979–2006. Much of the research they report suggests the elasticity of giving, ![]() , is close to −1. A few find an inelastic response,
, is close to −1. A few find an inelastic response, ![]() , and Bakija and Heim suggest giving may most likely be elastic,
, and Bakija and Heim suggest giving may most likely be elastic, ![]() .
.
There is more to understanding how tax policies affect giving than simply trying to measure a price elasticity for giving. Across countries, there are a variety of schemes in place to provide individuals incentives to donate. In some countries (e.g., Denmark, Finland, Germany, Italy, Switzerland) some or all individuals are obligated to donate as the laws require a fixed percentage of individual taxes be allocated to churches or other charities.13 With respect to voluntary donations, some countries provide direct incentives to all taxpayers (e.g., the US, Canada, the UK, Germany, Australia, India, Indonesia), others only to those with high incomes or high levels of donations, some strictly limit how much one can offset tax liability with her donation (e.g., Argentina [limited to 5% of taxable base], China [up to 30% of taxable income], Czech Republic [limit of 10% of income if at least 2% is donated], France [limit of 20% of taxable income], Russia [limit of 25% of taxable income], South Africa [limit of 10% of taxable income]), and others provide no incentives (e.g., Afghanistan, Brazil, Croatia, Israel [incentives given only for donations to public institutions]).
In recent decades, many of the changes in tax policies related to charitable giving provide greater incentives for wealthier individuals to donate. For example, in Australia donations of more than $5000 (AUD) receive a more advantageous tax treatment than donations of lesser amounts. In Germany, while donations are limited to 20% of income, an individual can deduct up to $1 million Euros if the donation is for the endowment of a foundation. In the US and Canada, donations of publicly traded securities and other property such as ecologically sensitive land have a lower effective price of giving than a cash donation of the same value. The reason for this is that the donor is allowed to take a charitable deduction against taxable earned income for the fair market value and not incur any capital gains on the difference between the fair market value and the basis of the securities or property. These changes may help to explain the growth in donations to foundations and faster growth in giving by individuals in higher income tax brackets. In Canada, for instance, a high proportion of foundations report receiving gifts of publicly traded securities. An extremely low proportion of registered charities, by contrast, report gifts of publicly traded securities. Very little work, however, has been done to explore the impacts of these policies on the price elasticity of giving, on the substitution between donations of cash and publicly traded securities, or the growing divergences in giving between higher and lower income individuals.
What if tax policy did not benefit the taxpayer but benefited the charity? For most taxpayers this is exactly what happens in the United Kingdom. Taxpayers receive neither a tax credit nor a deduction, unless they are high earners. Instead a system called “Gift Aid” is used. When an individual donates to a charity and identifies herself as a UK taxpayer, the charity can receive from the UK government the equivalent of the credit that the taxpayer would receive. For every pound donated, a charity can claim from the UK government a match that is based on the lowest tax rate for individuals (20%). Effectively this means that the charity can receive ![]() for every
for every ![]() donated (tax price is
donated (tax price is ![]() ). The exception to this system is for high income taxpayers. If they complete a form, they can receive a tax credit for their donations. Effectively this means that for every pound donated by a high rate taxpayer the price is
). The exception to this system is for high income taxpayers. If they complete a form, they can receive a tax credit for their donations. Effectively this means that for every pound donated by a high rate taxpayer the price is ![]() . Scharf and Smith (2010) explore whether high rate taxpayers giving differs across the scheme whereby the charity receives an amount equivalent to the credit and the scheme whereby the taxpayer receives the credit. If individuals understand the relationship, the government disbursement of revenues (in the system where charities receive the credit) is equivalent to receiving a tax credit on a reported donation to the government, then both systems should yield the same results. In the context of a survey of known high rate taxpayers that are donors, they randomly assigned questions about an increase in tax incentives (in the form of gift aid or in the form of a direct tax credit) to the donors. They find, despite the equivalence financially, that donors are likely to respond more positively to an increase in the gift aid amount than to an increase in the direct tax credit.
. Scharf and Smith (2010) explore whether high rate taxpayers giving differs across the scheme whereby the charity receives an amount equivalent to the credit and the scheme whereby the taxpayer receives the credit. If individuals understand the relationship, the government disbursement of revenues (in the system where charities receive the credit) is equivalent to receiving a tax credit on a reported donation to the government, then both systems should yield the same results. In the context of a survey of known high rate taxpayers that are donors, they randomly assigned questions about an increase in tax incentives (in the form of gift aid or in the form of a direct tax credit) to the donors. They find, despite the equivalence financially, that donors are likely to respond more positively to an increase in the gift aid amount than to an increase in the direct tax credit.
3.3 Households as Decision Makers
The analysis to this point has made the simplifying assumption that charitable decisions are made by individuals. In many cases, however, giving will be made by households. If men and women have different tastes about giving—or about the opportunity costs of giving—this presents a more complex and interesting question about how households resolve this conflict.
One could imagine a number of scenarios about how couples treat giving differently than individuals. For instance, if the couple shares the same tastes, then charitable giving could be seen as an enjoyable joint activity that couples do together. This could make couples give more to charity than individuals, and do so together. However, suppose that the couple disagrees either about the size or type of gifts. For example, one wants to support the homeless while the other prefers the opera. This might result in the couples bargaining with each other but making donation decisions jointly that effectively monitors or reins in each other’s spending. Another alternative is that one spouse may have stronger feelings about charity, better information, stronger social reasons (like giving at work), or lower transactions costs (like payroll deductions) that lead spouses to a delegate giving to one spouse. Finally, imagine a household where spouses keep separate finances. These spouses are likely to make independent decisions on giving.14
Two papers have explored these questions and come to many similar, but several importantly different conclusions. Andreoni, Brown, and Rischall (2003) use a question on the 1992 and 1994 Survey of Giving and Volunteering (SGV) in the United States that asked, “Who in your household is considered most involved in deciding which charities your household will give to?” The answers could be the respondent, spouse, or both. Yörük (2010) replicates this study, instead using the 2002 wave of the Center on Philanthropy Panel Study (COPPS), the Philanthropy Module of the PSID. This survey asks, “Who in your family was involved in decisions about how much support to give individual charities in 2002?” The answer could be the husband, wife, decide together, or decide separately. Thus the category, “both” from the SGV is more finely separated into “decide together” and “decide separately.” The two surveys differ in other important ways. While respondents have similar mean ages, the COPPS survey was taken 8–10 years later than the SGV survey, thus shifting the mix of marital cohorts. This shows up in other areas. The COPPS respondents have more education; there are about 7.7% points greater likelihood of being a college graduate among men, and about 6% points among women. Perhaps the biggest difference is that in the SGV data the likelihood that the husband is the primary earner is about 90%, while in the COPPS data the partnerships show more parity, with only about 60% of households having male as primary earners. If households are bargaining, therefore, one would expect more equal bargaining power in the COPPS than the SGV. This is exactly what is observed.
Adjusting for observables, both studies show little to no differences in amounts given by single males and females, but both show significant differences in the number of causes supported. Women appear to prefer giving less to more causes, while men prefer to specialize in one or two causes. Male deciders were also more sensitive to price in both data sets, especially when the price was low.15 In the SGV data, when both spouses decide (which could include both deciding together and independently), the analysis shows that households give about 6% less than had they each decided unilaterally and, moreover, the husband was estimated to have the dominant bargaining power, with his preferences getting more than twice the weight given to hers.16 COPPS data, by contrast, showed that couples deciding jointly (but not independently) actually gave 7% more than one would predict if they acted unilaterally. Moreover, bargaining power was nearly identical between spouses, with the wives estimated to actually have a bit more leverage than their husbands.
The degree of similarity between the two studies of Andreoni, Brown, and Rischall (2003) and Yörük (2010) tends to make the differences between the two all the more fascinating.17 Could it be that the differences in household bargaining could be due to cohort effects as more progressive values are represented in the newer data, and that these households are more likely to have female earners with good salaries and thus greater bargaining power? If so, does this parity among spouses actually create a more harmonious attitude toward giving, making it an enjoyable shared activity rather than a contentious case of spousal monitoring? These and other questions remain fascinating and important areas for understanding not simply charitable giving, but also for uncovering how households make decisions in general.
3.4 Experiments on Individual Givers: Price
An individual with consumption c, giving g, income y, and a marginal tax rate t, faces a budget constraint of ![]() , or
, or
![]() (1)
(1)
Letting ![]() then we see that the tax deduction lowers the price of giving, resulting in an out-of-pocket donation of
then we see that the tax deduction lowers the price of giving, resulting in an out-of-pocket donation of ![]() . A difficulty with estimating the effects of
. A difficulty with estimating the effects of ![]() and y on g is that t and y are determined jointly. One way to break the link between price and income is to look for an unanticipated change in the relationship, such as from a tax reform. Another way to get identification is through laboratory or field experiments that independently vary p or y.
and y on g is that t and y are determined jointly. One way to break the link between price and income is to look for an unanticipated change in the relationship, such as from a tax reform. Another way to get identification is through laboratory or field experiments that independently vary p or y.
A popular avenue for manipulating price both in actual fundraising and in experiments is from matching contributions. Suppose a rich philanthropist offers to match every dollar donated, d, with m dollars of his own. An out-of-pocket donation of d results in the charity receiving a gift of ![]() . Then when the charity receives g dollars, it only costs the giver
. Then when the charity receives g dollars, it only costs the giver ![]() , that is
, that is ![]() . For instance, under a 2-for-1 match it costs the donor $1 to give $3, so
. For instance, under a 2-for-1 match it costs the donor $1 to give $3, so ![]() . This results in a budget
. This results in a budget
![]() (2)
(2)
Notice that Eqs. (1) and (2) are quite similar. If ![]() then the two are the same.
then the two are the same.
A significant side issue is that, in practice, matching contributions typically have a limit. For instance, a philanthropist may pledge to match the first $100,000 donated. Then if donations exceed $100,000, the philanthropist’s “match” becomes equivalent to a direct contribution to the charity—no individual is being subsidized on the margin. If the limit is likely to be exceeded or, equivalently, the philanthropist cannot credibly commit to not giving the full limit pledged even if the match limit is not reached, then it is rational for givers to treat the match as simply a single unconditional grant. If this is the case, then the “matching grant” could in theory be expected to reduce individual donations d through an income effect. Since most matches do have limits that are exceeded,18 there is a question of whether donors suffer from a “matching illusion,” that is, whether they perceive that their contributions will actually result in more donations from the rich philanthropist, resulting in a substitution effect (encouraging giving) and an income effect (discouraging giving), or whether there is no matching illusion and a match results in only the income effect on d.
A second manipulation on price may be to offer a rebate. Suppose an individual gives g to the charity, and then shortly thereafter receives a rebate of r per dollar donated. The rebate could come from the government, a philanthropist, or the experimenter. This rebate now means that to give an additional dollar to the charity costs only ![]() to the donor, that is a gift g to the charity costs
to the donor, that is a gift g to the charity costs ![]() out-of-pocket. Thus the budget is
out-of-pocket. Thus the budget is
![]() (3)
(3)
Equations (1) and (3) are identical as long as ![]() . In fact, this point makes it clear that the tax deduction is in fact a rebate—only when one’s taxes are finally reconciled is the benefit of the deduction realized in a higher tax refund or lower tax bill. Looking at (1)–(3), modulo the “matching illusion” problem, if
. In fact, this point makes it clear that the tax deduction is in fact a rebate—only when one’s taxes are finally reconciled is the benefit of the deduction realized in a higher tax refund or lower tax bill. Looking at (1)–(3), modulo the “matching illusion” problem, if ![]() then the prediction from simple economic theory would be that the outcomes are the same.
then the prediction from simple economic theory would be that the outcomes are the same.
Experimental research on rebates and matches began with a provocative of experiment by Eckel and Grossman (2003). Endowing laboratory subjects with cash, they allowed subjects to give some of the money to a favored charity at set rebate rates r of 0, 0.2, 0.25, and 0.5. Another group of subjects faced the equivalent tasks but framed as a match, with m of 0, 0.25, 0.33, and 1. They found matching significantly dominated subsidies, with the charity receiving 27–88% more with matching. They also found an interesting pattern that we will return to later. Under the matching scheme, the out-of-pocket cost to the subject, that is ![]() , is a nearly identical fraction of the endowment on average for every value of
, is a nearly identical fraction of the endowment on average for every value of ![]() , ranging only between 47 and 52%. In other words, when one looks at the out-of-pocket donation
, ranging only between 47 and 52%. In other words, when one looks at the out-of-pocket donation ![]() , subjects allocated about the same d as fraction of their endowment to the charity, regardless of m. This could lead one to infer that the match does not matter. However, when looked at as the gift received,
, subjects allocated about the same d as fraction of their endowment to the charity, regardless of m. This could lead one to infer that the match does not matter. However, when looked at as the gift received, ![]() , it would lead one to infer that matches are hugely influential. In fact, if utility depends on the gift g, then the match has an income effect that should suppress d: a 1-to-1 match can reach the same g at half the d. But it also creates a substitution effect that should increase d. Thus, only if g is elastic with respect to p,
, it would lead one to infer that matches are hugely influential. In fact, if utility depends on the gift g, then the match has an income effect that should suppress d: a 1-to-1 match can reach the same g at half the d. But it also creates a substitution effect that should increase d. Thus, only if g is elastic with respect to p, ![]() , will d not fall in response to an increased match. Eckel and Grossman confirm this by estimating an elasticity of g with respect to p of about −1.1. If instead they had looked at the effects of m on d, the inference would have been that, after accounting for the endowment, m and d are virtually unrelated.19
, will d not fall in response to an increased match. Eckel and Grossman confirm this by estimating an elasticity of g with respect to p of about −1.1. If instead they had looked at the effects of m on d, the inference would have been that, after accounting for the endowment, m and d are virtually unrelated.19
A series of field experiments on matching grants finds results that in many ways parallel the laboratory studies. Karlan and List (2007) team with an actual nonprofit to send fundraising letters to over 50,000 potential donors, one third of whom acted as a control group. The letters to those treated varied in ways that are intended to capture the issues raised above. Letters included either no match, a 1-to-1, 2-to-1, or 3-to-1 match, that is, ![]() , or 0.25, respectively. They also addressed the “matching illusion” by claiming in the letter that matches would go up to $25,000, $50,000, or $100,000, thus increasing the likelihood that a giver would feel their contribution would truly be subsidized (assuming they see any unmatched portion of the limit as credibly not given).
, or 0.25, respectively. They also addressed the “matching illusion” by claiming in the letter that matches would go up to $25,000, $50,000, or $100,000, thus increasing the likelihood that a giver would feel their contribution would truly be subsidized (assuming they see any unmatched portion of the limit as credibly not given).
The mailing received a response rate of 2%, which is not atypical for charitable solicitations of this type. Of the 50,083 mailings, they received 300 control responses, and 735 treatment responses (roughly 245 per match level). While individual characteristics of the donors were not observable, the authors could control for census-level characteristics based on the zip codes of potential donors. Note also, there is no way to know that the envelopes were opened and, thus, who was treated. The authors would ideally wish to control who was treated and examine the effect of the treatment on the treated. Since this is impossible, the authors’ analysis uses either all 50,000 mailings as observations, or simply the 1035 who responded.20
The presence of any match had a significant impact on the likelihood of giving (0.018 for the control and 0.022 for the treatment), increasing the propensity by 22% (that is, 0.022/0.18–1). It also increased the donation d per solicitation by 19%, from $0.81 to $0.97. However, as the match increased from 1 to 2 to 3-to-1, out-of-pocket donations d per mailing remained flat at $0.94, $1.03, and $0.94, respectively, which is not a significant difference. However, if one looks at the total gift including the match, ![]() , one would conclude the match greatly increases generosity, going from $1.87 in the 1-to-1 match up to $3.75 per mailing in the 3:1 match.21
, one would conclude the match greatly increases generosity, going from $1.87 in the 1-to-1 match up to $3.75 per mailing in the 3:1 match.21
Interestingly, Karlan and List found no effect of the ceiling on the dollars to be matched. This would indicate that either donors did not suffer from a matching illusion, other than to perhaps change the timing of donations to fall under the period of the match, or that they all suffered similarly from marginal-illusion and the elasticity of g is roughly ![]() −1, which implies a constant d. Harkening back to the parallels with the laboratory study of Eckel and Grossman, who also found d independent of m, there is something yet to be understood about how individuals see a match as affecting the price.22 We return to this in the next section when we discuss leadership giving.
−1, which implies a constant d. Harkening back to the parallels with the laboratory study of Eckel and Grossman, who also found d independent of m, there is something yet to be understood about how individuals see a match as affecting the price.22 We return to this in the next section when we discuss leadership giving.
3.5 Experiments on Individual Givers: Leadership Gifts
A rule of thumb that fundraisers use when launching a fundraising campaign is that about one third of the announced goal should be committed prior to the announcement of the public campaign. That is, pledges made from a small group of donors to provide seed money—called “leadership gifts” by fundraisers—are seen as an essential part of fundraising.23
Andreoni (1998) presented a theory of seed money based on the charity having fixed costs (or equivalently, a range of increasing returns) associated with its operations. The consequence of the fixed costs is that even if there is an equilibrium that would allow the charity to reach its goal, there will also be an equilibrium in which no donations are received as long as the fixed costs exceed what any donor is willing to pay alone. The way the charity can eliminate the undesirable equilibrium is to get enough pledges to (almost) fully cover the fixed costs.24 Vesterlund (2003) and Andreoni (2006a) provide alternative explanations of seed money as conveying information. In both models there is a first mover (or movers) who are given or endogenously acquire superior information about the quality of the charity. Only by making large gifts can these informed players credibly convey that the charity is worth supporting at a high level.25
Bracha, Menietti, and Vesterlund (2011) provide a direct test of the fixed-costs model in a laboratory setting. The experiment has an elegant ![]() design. Groups play a public goods game where giving is either simultaneous (no lead giver) or sequential (a designated lead giver), interacted with the presence or absence of a fixed cost. In the presence of fixed costs that are binding on subjects (that is, they exceed the equilibrium with no fixed costs) the combination of high fixed costs and sequential play significantly increases the level of donations and the likelihood that the threshold is met. The experiment neatly supports the model’s predictions.
design. Groups play a public goods game where giving is either simultaneous (no lead giver) or sequential (a designated lead giver), interacted with the presence or absence of a fixed cost. In the presence of fixed costs that are binding on subjects (that is, they exceed the equilibrium with no fixed costs) the combination of high fixed costs and sequential play significantly increases the level of donations and the likelihood that the threshold is met. The experiment neatly supports the model’s predictions.
List and Lucking-Reiley (2002) provide a direct test of the effect of seed money in a field study. They contact donors to give to small public goods ($2000 computer work stations) with varying degrees of seed money provided. As in the laboratory, those solicitations that included the highest seed money gained the greatest likelihood of giving and the largest donations.
A recent field study by Huck and Rasul (2011) combines the reasoning about leadership givers with that of matching grants described above. They note that the very existence of a matching contribution is itself meaningful in the same way that a leadership gift can provide credibility that a fundraising goal will be met. Huck and Rasul test these ideas in a field experiment to raise money for disadvantaged families in Germany. The fund drive was sponsored by the Bavarian State Opera House, whose patrons served as the subjects in the field experiment.
The opera house mailed 14,000 solicitation letters to individuals who had purchased tickets to operas or ballets. This likely means the sample will be weighted toward more educated and higher income individuals. A control group did not receive any mention of a lead giver or a match. Treatment group 1 was simply told of a ![]() leadership gift. In two additional treatment groups the
leadership gift. In two additional treatment groups the ![]() leadership gift was mentioned, but it was framed as a limit on matching contributions. Treatment group 2 was told the match was 0.5-to-1, for an effective price of giving g of
leadership gift was mentioned, but it was framed as a limit on matching contributions. Treatment group 2 was told the match was 0.5-to-1, for an effective price of giving g of ![]() in, while in treatment group 3 the match 1-to-1, yielding a
in, while in treatment group 3 the match 1-to-1, yielding a ![]() . The inclusion of treatment group 1 distinguishes this study from Karlan and List and allows one to identify the effect of the match independent of the mere presence of a lead donor. That is, comparing the control to group 1 captures the effect of a lead donor, then comparing group 1 to groups 2 and 3 allows isolation of the effect of a match.
. The inclusion of treatment group 1 distinguishes this study from Karlan and List and allows one to identify the effect of the match independent of the mere presence of a lead donor. That is, comparing the control to group 1 captures the effect of a lead donor, then comparing group 1 to groups 2 and 3 allows isolation of the effect of a match.
Huck and Rasul found the biggest effect of the experiment was announcing the lead gift itself. Control group giving averaged ![]() , which increased to
, which increased to ![]() in group 1. That is, simply announcing the lead gift, without any match, raises giving by 78%. Adding the 0.5-to-1 match raised giving to
in group 1. That is, simply announcing the lead gift, without any match, raises giving by 78%. Adding the 0.5-to-1 match raised giving to ![]() , a 14% increase over group 1, and the 1-to-1 match raised giving to
, a 14% increase over group 1, and the 1-to-1 match raised giving to ![]() , a 40% increase over group 1. While these averages indicate that the gift g responds to reductions in price, the response is inelastic. This means that the match actually causes the out-of-pocket donation to fall in response to the match. Relative to group 1 there
, a 40% increase over group 1. While these averages indicate that the gift g responds to reductions in price, the response is inelastic. This means that the match actually causes the out-of-pocket donation to fall in response to the match. Relative to group 1 there ![]() , in group
, in group ![]() , and in group
, and in group ![]() .
.
Huck and Rasul have two important conclusions. First, using a control group that received a solicitation that has no mention of the lead gift, then one would find a very small effect of the match on out-of-pocket donations, as was found by Karlan and List. Second, and most importantly, they find that the largest effect of a match is in announcing the leadership gift, not in lowering the price. In fact, the charity in this experiment is best off by simply announcing a leadership donation and not including a match at all. This can explain why Karlan and List report that the existence of a match and not the size of the match is what matters. Huck and Rasul allow an even stronger statement: for the population of opera patrons in the study, giving g is mildly responsive to the match but is inelastic with respect to price. However, giving is highly responsive to the announcement of the lead gift, meaning that leadership gifts can encourage giving by others, but converting leadership giving into matching grants is counterproductive for the charity.
3.6 Experiments on Individual Givers: Give more Tomorrow
Thaler and Benartzi (2004) made famous a simple device that is successful at getting people to save in retirement funds. The program, called Save More Tomorrow (SMT), allows workers to commit in the present to save more at a date sufficiently far into the future. Compared to asking them to commit to save more immediately, the SMT program increases savings over the long run.
Breman (2011) uses the same logic to motivate an intervention she calls Give More Tomorrow (GMT). She works with a charity in Sweden that allows donors to sign up for automated monthly donations that are made electronically. In the control group, the charity calls donors with a request to increase their monthly donation starting at the next billing date, as is typical for charity operations. In two treatment groups, an identical script is used by the solicitor, except that they offer to begin the increased donation in 1 month or 2 months past the next billing date. She finds that a delay of 2 months, but not 1 month, had a significant positive effect on the increase in donations. Moreover, a year after the intervention, individuals who were treated with GMT continued to have higher donations and, compared to asking people to give more today, GMT increases the total receipts of the charity. This effect could be due to present-bias or planning constraints, or simply because it is harder to say “no” to requests for obligations far off into the future.26
3.7 The Salience of Incentives to Give
All of this analysis of the effect of tax incentives, matching grants, on individuals is, of course, built on the assumption that individuals understand the financial consequences of their donations on both themselves and the charities. A recent paper on the salience of “tax expenditures” by Goldin and Listokin (2012) uses a survey of US taxpayers to show that, while 72% of all tax filers correctly identify their eligibility to benefit from a charitable deduction, people systematically underestimate the value of the deduction. For instance, only 18% of those with a marginal tax rate of 0.28 correctly identified the subsidy on giving as “20–40%,” and 78% stated that the subsidy was below “20%.” As other findings of a lack of awareness of sales taxes and EITC benefits have led to a discussion of the impact and incidence of these policies (Chetty & Saez, 2013; Chetty, Looney, & Kroft, 2009), the lack of salience about the charitable deduction could generate similar conversations among academics and policy makers. Moreover, some of the differences discussed above could be explained through salience. For instance, do matching grants during fundraising campaigns make the consequences and costs of a gift more salient, and that is why they can be more effective? Are men more aware of marginal tax rates, and could this explain why households in which men decide on giving are more price sensitive? These and other effects of salience are, it would appear, promising and important areas of future research.
4 Approach 2: The Charitable Sector as a Market
The machine of charitable giving has many moving parts. Charities receive grants from the government, gifts from foundations, donations from individuals, and raise money through ordinary appeals like mailings, phone banks, and advertising, but also through fundraising events, like galas, walkathons, charity auctions, sponsorships, and in some cases by charging fees for services. The use, intensity, and effectiveness of each channel is likely affected by the use, intensity, and effectiveness of the other channels. This interdependence is clearly important and, obviously, presents a tremendous challenge for researchers. With charities as demanders of funds, donors as suppliers, and the government providing policy interventions that are dependent on choices made by donors and charities, identifying the “equilibrium” in this market becomes a delicate and difficult issue. This section looks at new theoretical and econometric studies that try to understand charitable giving from this more holistic approach.
4.1 Theories of Charity from the Supply Side
Early thinkers in the area of nonprofits, such as Weisbroad (1991) and Rose-Ackerman (1996), deserve credit for identifying and advocating a broad approach to charitable giving, and since then the research that takes both demand and supply aspects into account has grown tremendously. Most recently, an elegant theoretical model by Correa and Yildirim (2013) combines and generalizes models by Rose-Ackerman (1982), Andreoni (1998), Andreoni and McGuire (1993), and Andreoni and Payne (2003) to describe the equilibrium among donors and fundraisers, and to explore the impacts of government policies. In the model, fundraising is costly, individuals give only if they are solicited by the charity, each potential “target” donor has a different propensity to give based on heterogeneity across givers.27 Correa and Yildirim provide a solution in which the charity determines the set of potential donors for whom the “profits” are the highest, that is, for whom the marginal donation most greatly exceeds the margin cost of solicitation. Since the charity chooses the set of donors, and commits to a total fundraising cost C, it forces the donors into a subgame with fixed costs. In this subgame the set of donors who are solicited must contribute at least C or the charity will provide no net services. This non-convexity effectively creates a threshold, which in turn creates an equilibrium at giving zero (Andreoni, 1998). Correa and Yildirim show that if there also exists an equilibrium among some set of donors where this equilibrium at zero can be overcome, then a clever charity can select the set of donors that guarantee it will be overcome and the charity will have a successful fundraising campaign.
The Correa-Yildirim model also has interesting and important policy predictions. Foremost among these is the prediction about crowding out of private donations by government grants to charities. The classic model of charity coming from purely altruistic motives indicates that individuals should be indifferent to giving directly or through their taxes, thus grants should crowd out donations dollar-for-dollar. Since crowding out is often measured as incomplete, one reason could be that preferences are not purely altruistic but include a warm-glow, as discussed in the prior section. This is a supply side explanation. The Correa-Yildirim model, maintaining altruistic preferences, provides a demand side explanation instead (while the proofs are provided under an assumption of pure altruism, the results are made only stronger by including a warm-glow). Because of the strategically active charity, and the endogeneity of the set of donors through fundraising, the model prediction is that grants will only be partially crowded out, and that some of this crowding out will be attributable to reductions in fundraising efforts by the charity in addition to classic direct crowding out of donors. As we see below, this is fully in line with the results from recent econometric analyses of charitable organizations.
4.2 Econometric Evidence
The most natural policy question applying the market approach to charities is crowding out. Testing theories of crowding out, however, has been a challenge. For instance, how does one pair private giving to public funding for the same type of good, and should the analysis constrain coefficients that measure crowding out to be the same across different types of charitable goods? What about donors who may give to multiple goods—can government grants to one charity affect giving to another? And could the government actually crowd in giving by providing a signal of quality, and should this vary depending on how easily quality can be publicly verified?
What is the best methodology for pairing private and public funding?28 Kingma (1989) was the first to match private giving and public funding directly by focusing on giving to local public radio stations.29 Schiff and Weisbrod (1991) gathered measures of private giving from non-profit tax returns but then matched these measures to aggregated measures of government funding. Hungerman (2005) and Gruber and Hungerman (2007) match church spending on charitable goods with aggregate measures of government spending. Khanna, Posnett, and Sandler (1995) and Payne (1998) were among the first to match both private and public giving to specific charities and for a large sample of charities. Another approach, taken by Andreoni and Payne (2011a), is to look at crowding out by different categories of donations, that is, tax receipted versus non-tax receipted giving by individuals, and transfers from foundations and from other charities.
An underlying econometric issue when seeking to measure the relationship between private and public funding is how best to control for dynamic changes in giving. Primary estimation issues revolve around concerns of heterogeneity in the charities due to size, scope, mission, and location. One means to help control for this heterogeneity is in the use of panel data (e.g., Khanna, Posnett & Sandler, 1995; Payne 1998, 2001; Gruber & Hungerman, 2007; Hungerman, 2005; Okten & Weisbrod, 2000; Ribar & Wilhelm, 2002; Andreoni & Payne 2003, 2011a, 2011b). With panel data, one can include organizational fixed effects to help control for time-invariant differences across charities.
A second key concern in estimation is the potential omitted variable bias due to time-varying events that could drive both the government and private donors to simultaneously change giving. For example, a natural disaster (Haiti earthquake, Hurricanes Katrina and Sandy) is likely to increase both private and public funding. Failing to control for these positive correlations in demands will lead to a biased understatement of the degree of crowding out, and could erroneously even suggest crowding in.
There is likely a similar downward bias associated with the endogeneity in public funding, the third main concern. As pointed out by Payne (1998), donors are also voters. If voters’ preferences are reflected in both public policy and in private donations, it will create a biased impression that crowding out is low. Hence, even with panel data estimation, one must be concerned about the exogeneity of government funding in a specification that has private giving as a dependent variable.
Estimations of crowding out, thus, should control for the heterogeneity among charities and take into account potential omitted variable and endogeneity biases. This suggests that unless one has conducted a field experiment or has a strong natural experiment, an OLS type of regression will underestimate (bias toward a more positive coefficient) the effect of government funding on private donations. Most of the current research has relied on two-stage least squares (“2SLS”) framework to address issues of endogeneity and omitted variable bias. This requires that one find measures that directly explain variations in government funding but only indirectly (through the government funding channel) explain private giving. Although 2SLS is a popular and useful technique, it has its limitations. The biggest concern is weak instruments (see, Bound, et al., 1995; Choa & Swanson, 2005; Cruz & Moreira, 2005). If one uses instruments that only weakly identify the level of government funding, the estimates of crowd out will still be biased. In any 2SLS estimation, therefore, the researcher should ensure that the instruments work, that there is a good story to explain how the instruments affect government funding, and that the instruments do not directly explain private giving.
The literature that employs a 2SLS technique, generally finds that government funding crowds out private giving. Hungerman (2005) suggests that public social welfare funding crowds out revenues by faith-based organizations on the order of 67 cents for every dollar of public funding. Andreoni and Payne (2011a) find an overall crowd out of 70 cents for every dollar of government grants when studying charities involved in the provision of goods related to social welfare and community development. These use data from the United States. Andreoni and Payne (2011b) use data on Canadian charities and measure crowding out at close to dollar-for-dollar.
Is the measure of crowding out usually the same across different types of charities? While crowding out seems large for social welfare organizations, there is no evidence of crowd out for health organizations or for overseas and relief organizations.30 Borgonovi (2006) studies the effects of changes in government funding on private giving to American non-profit theaters. He presents evidence to suggest that small levels of government funding crowd in private donations but large levels of funding crowd out donations. However, Borgnovi only studies a small sample of charities. In the context of education, the analysis of both Connolly (1997) and Payne (2001) suggests that donors may not be as informed about the goods and services provided by universities, potentially allowing the government grants to serve as a signal of quality to private donors, especially when the signal relates to grants associated with research activity. Both empirical analyses support this conjecture. Recent work by Blume-Kohout (2012) also suggests that government research grants provide a signal of quality to private donors.
Overall, however, while there are numerous studies that explore crowd out as it relates to the provision of social services, there are too few studies that examine crowding out in other charity sectors, such as environmental, health, education, and the arts.
If crowding out ranges from 70 cents to 1 dollar, is this mostly attributable to a change in donor behavior? There are several things to consider in answering this. First, donors may be latent givers, that is, they must be encouraged to give through fundraising and marketing campaigns. Second, charities are likely more concerned about service provision than revenue growth. That is, as non-profits, charities may not be net revenue maximizers and instead may view fundraising as a “necessary evil.” Third, it is important to control heterogeneity among charities when analyzing the interaction between private and public funding. In short, it is important, yet delicate, to treat charities as active players when it comes to the collection of private donations.
Andreoni and Payne (2003, 2011a) shed light in the role of charity fundraising on crowding out using US data. In 2003 they demonstrate that for both arts and social welfare charities, increases in government funding to an organization significantly decrease fundraising efforts by the organization. In 2011 they study a panel of more than 8000 charities operating in the United States. They measure an overall level of crowding out on the order of 75%. This crowding out can be decomposed into the portion that is attributable to donors independently changing their contributions and the portion attributable to a change in fundraising behavior. Their research suggests the bulk of the crowding out is due to a change in charity fundraising. Depending on the specification, in fact, donors may be slightly crowded in by government grants. The maximum level of crowd out attributable to a direct change in donors’ giving is 30%. Thus, the portion of crowding out attributable to a change in the charity’s behavior ranges between 70% and 100%.
Andreoni and Payne (2011b) expand upon these findings with a rich data set of more than 13,000 charities involved in the provision of social welfare and community services in Canada over more than 15 years. For overall private giving, they measure crowding out of close to 100%. Similar to the US data, approximately 77% of this crowding out is attributable to change in charity fundraising. Unlike the US data, however, Andreoni and Payne can examine whether crowding out is similar across different types of private givers to the charity: individuals that give directly, individuals that give through participation in fundraising events (such as gala dinners or other non-tax receipted revenues), and donations from other charities and charitable foundations. The analysis suggests that individuals that give directly do not reduce their giving when the charity receives a government grant – instead they increase their giving, suggesting a crowding in effect as would occur if individuals use government funding as a signal. The crowding out is attributable to a decline in revenues from fundraising events (likely because the charities reduce their fundraising efforts) and a decline in revenues from other charities and foundations. These other charities and foundations are likely better informed about the activities of the charities under study and, thus, more likely to change their funding levels when the charity receives government funding.
Despite the great attention to crowding out, there remain many open questions. Crowding out clearly differs across the types charitable good or service being provided, and it differs across each source of private revenue, in ways that are not yet understood. Moreover, if giving is crowded out, where does the giving go? Do donors give it to another cause or use it for private consumption. Conversely, if a fundraiser succeeds in attracting a new donor, is that money simply moved from another charity, or is the new donor also giving new dollars to the charitable sector.31 One thing that is clear, however, is that viewing organizations as active players in the market for donations has brought rich new insights to questions of crowding out and the effectiveness of government policy.
4.3 Evidence from Field Experiments
The main models of fundraising discussed above are built on the assumption that there are some latent transaction costs to giving. Contacting donors with a request to give, perhaps providing a return envelope and information about the organization, can lower the transaction costs and hence trigger a gift. We start this section by discussing a paper by Huck and Rasul (2010) that attempts to measure the selection into giving based on a model of transaction costs.
Notice that if an individual faces random transaction costs—one’s day could be particularly busy or unusually slow—this effect cannot be captured in a single request to give. Thus, one needs at least two requests to identify a model of selection into the set of donors. Huck and Rasul conduct a study using the same fund drive described above. Potential donors received a detailed solicitation letter that varied across donors with respect to whether a leadership gift was mentioned and potential matching rates for donations. Six weeks later these donors received a brief reminder of the earlier mailing but carried no new information. Let ![]() be the response rate on the first mailing and
be the response rate on the first mailing and ![]() be the response rate on the second mailing. Let s stand for the share of donors who would like to give if transaction costs were sufficiently low and let t be the probability that an individual draws a transaction cost that is at or below the threshold at which they will find the time to consider the solicitation and mail a check. Assuming s and t are the same across solicitations (the authors provide cogent arguments about why the data support this assumption), then with two mailings the response rates would be defined as
be the response rate on the second mailing. Let s stand for the share of donors who would like to give if transaction costs were sufficiently low and let t be the probability that an individual draws a transaction cost that is at or below the threshold at which they will find the time to consider the solicitation and mail a check. Assuming s and t are the same across solicitations (the authors provide cogent arguments about why the data support this assumption), then with two mailings the response rates would be defined as ![]() , and
, and ![]() . These two equations can be solved for s and t. The authors do this for both a control group that was not told of a lead giver, and for a treatment group that was. Solving for the control group, s is 0.069 and t is 0.54, while for the treatment group, s is 0.061 and t is 0.57. The fact that these numbers are so similar, despite the fact that the treatment group gives higher amounts at both the initial and reminder solicitations, is supportive evidence for an underlying model of fundraising built on notions of transaction costs of givers.32
. These two equations can be solved for s and t. The authors do this for both a control group that was not told of a lead giver, and for a treatment group that was. Solving for the control group, s is 0.069 and t is 0.54, while for the treatment group, s is 0.061 and t is 0.57. The fact that these numbers are so similar, despite the fact that the treatment group gives higher amounts at both the initial and reminder solicitations, is supportive evidence for an underlying model of fundraising built on notions of transaction costs of givers.32
An important implication and lesson of field experiments using mailings that is worth emphasizing is clarified in this multiple-solicitation technique. The reminder letter mentioned nothing about the leadership gift or matching rates. Yet, those who gave after the second solicitation but had gotten letters mentioning the lead gift in the first solicitation gave more. This leads one to ask whether the differential propensity to be treated—that is, opening the envelope on the first solicitation—is interacting with the willingness to give in the second mailing. Backing up one more stage, one could also imagine that those willing to open envelopes from charities in the first mailing are also hopeful to have something to support, which in turn may select themselves into being treated based on an openness to being influenced by, say, a leadership giver. This self-selection into being treated, along with the low response rates, means that these experiments are not informing us about a general population, but a self-selected and potentially extreme subset of potential givers. Charities that offer matches over a telephone solicitation, radio advertising, or using a social network, for instance, may find entirely different patterns of responses.
4.4 Further Evidence from Experiments
Here we discuss other laboratory and field experiments that consider charities as participants in a complex strategic game among several players. We highlight two issues: crowding out and sequential giving.
Early experiments on crowding out focused on abstract public goods provided in the laboratory (Andreoni (1993); Bolton & Katok (1998); Chan, Godby, Mestelman, & Andrew Muller, 2002). These found incomplete crowding out, suggesting that subjects’ preferences included some imperfect willingness to substitute own giving for forced giving through “taxation.” The strength of this approach is that it clearly identifies the role of preferences apart from any context brought into the experiment from the real world, or any value placed on being a “donor,” either through conscience, identity, audience effects, or other elements that may account for the warm-glow. However, this narrowness is also a weakness. What if context (that is, giving to an actual public good in the world) interacts with warm-glow to change its impact?
In a simple and clever manipulation by Eckel, Grossman, and Johnson (2005), laboratory subjects play a dictator game33 with an actual charity.34 Using the setup of Bolton and Katok (1998), both the individual and the charity were endowed with an initial split of $20, either $18 for the subject and $2 for the charity, or $15 for the subject and $5 for the charity. Subjects could then “top up” the small forced donation. The hypothesis of complete crowding out is the final allocation should be independent of this initial allocation. The interesting twist here was a further manipulation in how the initial endowment was framed. If it was stated simply as a starting allocation, crowding out was seen as essentially zero—giving did not depend on the starting allocation. However, if subjects were told that they had $20 to start with and that $2 (or $5) had been “taxed” away from them, this tax was incorporated into the contribution leading to 100% crowding out.
What accounts for this difference in framing? Obviously it cannot be that subjects have utility functions over the final provision of the charitable good, since otherwise giving would have been zero in all conditions.35 Instead, it is likely that the frame affects how subjects perceive themselves or how they feel they are perceived by others. It would appear that publicly framing the initial allocation as a tax served to create the mutual knowledge that subjects would get credit for this contribution.36 Li, Eckel, Grossman, and Brown (2011) show this must be the case. In another “real donation” setup, subjects can give to private charities, or to government agencies that would appear to be providing a near-perfect substitute (such as disaster relief, or cancer research). Individuals made similar levels of donations to the government or private sector provider, although the 22% going to the government was smaller than the 27% going to the private alternative.37 Nonetheless, this study shows that people are not opposed to taxation, but will voluntarily pay a tax, as long as it is clear to all sides, and perhaps especially the subject herself, that the “gift” includes the dollars going to the government.
Next we turn to sequential giving. Much of the intuition for markets for giving is based on static models in which all givers move simultaneously. In life, as has already been noted in the discussion of leadership giving, giving is often sequential. Often these “leadership gifts” will come from a small set of large donors. It is believed, however, that this way of organizing donations is the best way to guarantee the success of the fund drive.38 Several theoretical papers have suggested that the leadership giver may have an incentive to become better informed than other donors, thus the lead gift conveys useful information (Andreoni, 2006a; Vesterlund, 2003). Another hypothesis is that leadership givers are instrumentally giving to promote reciprocal gift exchange. A clever experiment by Potters, Sefton, and Vesterlund (2007) shows that when leadership givers reveal private information using a credible signal, leadership giving is effective. This supports the model of signaling over reciprocity.
Another feature of real-world giving is that it unravels slowly over time. In an important paper by Marx and Matthews (2000), giving is modeled as an iterative mechanism. Building off of Schelling’s (1960) intuition, giving little-by-little can help solve the free rider problem since each giver only risks a small amount of money and reveals only a small bit of information about his willingness to pay. Marx and Matthews show formally, however, that for this to be true there must be a discontinuous “completion benefit.” If there is, and if players are sufficiently patient, iterative giving can have the effect suggested by Schelling. Duffy, Ochs, and Vesterlund (2007) find iterative giving is indeed more successful but, in contrast to the formal model, the success does not depend on the existence of a discontinuous completion bonus.
A final way sequential giving could be important in the real world is that it helps givers form beliefs about what size gift is “appropriate.” Giving, as we have argued, has many components of a purely social good, such as audience effects, identity, and status, and as such how much a person wants to give could be a positive function of what others give. Sequential giving allows people to learn from those who came before. In an experiment using public radio donors, Shang and Croson (2009) manipulated information given to donors calling into a station to make a pledge. When they announced the largest of recent donations, this indeed had a positive effect on giving.
5 Approach 3: Giving as a Social Act
Markets, as economists have idealized them, are impersonal. Supply meets demand. There is no courtship, no flattery, no salesmanship—just exchange. Thinking of charity as existing in a market with many players is a necessary step toward understanding how the different participants respond to each other. But the extremely personal nature of charitable giving, the fundamentally human aspect of giving and helping, suggests that perhaps this idealized analog of a market is missing some fundamental aspects of the giving dynamic that could be critical to understanding why people give, and why we rely on charity to provide so many social goods and services. Understanding giving as a social act will allow us to ask whether this structure is efficient or whether, as is often the case in textbook markets, the exchanges are fraught with “market” imperfections.
To make the point starkly, as researchers in the area of giving and altruism will surely affirm, a perennial question asked of us is, “Why do people give?” Why is this question asked in the first place? Do labor economists get asked, “Why do people work?” Do newspapers print headlines asking, “Why do people buy food?” Giving, altruism, charitable feelings, and behaviors are as common to everyone’s personal experience as getting a job or eating a meal, yet charitable behavior remains something that has escaped an easy explanation and remains a topic of great fascination, both in and out of academia.
One reason economists have, perhaps, struggled to provide a simple answer to the question is that the answer goes beyond the borders of mainstream economics. Sociology and psychology may be needed as well. Scientists from these areas will tell us that giving typically involves at least two steps. First is an intellectual recognition of a need. But this is clearly in itself not enough. For nearly everyone on the planet there is someone they know (or know of) who is in much greater need than themselves, or is aware that there are causes whose social benefit greatly exceeds one’s own private benefit of the last dollar of consumption. Awareness is not enough. So what else is needed to move awareness into action?
This section will explore several answers to what could be part of that “what else.” All of these will revolve around the inherent sociality of giving.
Begin with the trivial observation: giving requires a recipient. Giving is rarely anonymous and even more rarely is it unnoticed or unknown. That is, someone is typically watching and the fact of an audience may influence giving. But even when no one truly knows about a gift, the giver herself knows.39 Are we, as Adam Smith wrote in The Theory of Moral Sentiments, our own audience?
Another feature common in the giving exchange is a request to give. It is a fair approximation to say that virtually all giving is accompanied by a direct request, a fundraising solicitation, a phone number or web address on a television screen, or an extended hand. Rarely does a donor get “hungry” for more giving, instead the recipient tends to come seeking the donor. People may be more or less willing to put themselves on life paths to do good deeds, such as the person who becomes an overworked and underpaid teacher or nurse rather than an accountant or statistician. On a day-to-day scale, a willingness to give will often be correlated with a willingness to let oneself be asked. And when being asked is truly exogenous, a willingness to give may be correlated with a weakness of will to say no.
If asking is so powerful, this leads us to imagine what hold asking has on people. Why does asking work? Economists are just beginning to examine these questions, but the answer, we will conjecture, lies in another key ingredient to the chain of mental states that leads to giving. In particular, once one intellectually acknowledges the needs of another, an emotional experience of those needs is most often present in those who give. That is, humans feel great empathy.
5.1 Audience Effects
Public Broadcasting fundraisers read names aloud on the air, the symphony lists donors in the program, and after class reunions the names of those who gave will be printed in the annual college newsletters.
These tactics apparently work to increase donations, but why? One hypothesis is that, for whatever accident of evolution—biological or cultural—individuals form judgments about others and, more to the point, people care that they themselves are judged positively. Two papers published in the same year discussed the importance of such audience effects, Ariely, Bracha, and Meier (2009) and Andreoni and Bernheim (2009). Here we discuss the second of these, though each had a similar intent.
The paper by Andreoni and Bernheim uses a simple dictator game in which the dictator has $20 to share with a recipient. It seems obvious that most people will agree that the socially acceptable—some would say normative—choice in this dictator game is a 50-50 split. People, however, may have heterogeneous values for how much they personally care about adhering to this 50-50 norm. The key innovation in this analysis is to assume that in addition to caring about others and about adhering to the norm, people also care their “social image.” That is, people care that others perceive that they are altruistic.
Suppose that with no audience Alice would most prefer to give Bob a 45% share of the pie, keeping 55% for herself. Notice, that with an audience it will cost just 5% more of the pie for Alice can appear just as generous as those who care infinitely about conforming to the 50-50 norm. By giving 45%, conversely, she reveals her true type. Here the audience makes her behave more generously.
Instead, suppose Alice would, without an audience, be willing to give Bob 2% of the pie. With an audience Alice will be seen almost as poorly as those others who are taking everything. To gain an extra 2% of the pie Alice relinquishes almost nothing in her social image and, depending on the distribution of the preferences for conforming to the norm, could find the trade-off makes her better off. That is, an audience makes her behave more selfishly.
Combining these two effects, the audience can create a “double pooling equilibrium,” and this outcome exactly captures the specific data from experiments.
Andreoni and Bernheim follow this theory with a new experiment. They do this by adding noise to a Dictator Game choice. For instance, regardless of what the dictator chooses, there could be a 50% chance that her choice will be substituted with “give nothing.” Thus, when a recipient gets nothing it is unclear whether the dictator or the experimenter is responsible. The theory neatly shows, as this likelihood of being “forced” to be selfish grows, the pool at giving 50:50 should shrink and the pool at “give nothing” should grow. This is precisely what happens in the experiment.40
The model and experiment of Andreoni and Bernheim, while not about charitable giving per se (although Ariely et al. do contain elements of charitable giving), provides a structure and a backing for understanding the social aspects of an audience that may bring richness to future studies of giving.
5.2 The Power of the Ask
Fundraisers are fond of saying that there are two kinds of mistakes to make in a fund drive: asking for too little and asking for too much. Ask for too much, they say, and you get nothing. Ask for too little and you get what you asked for. A recent experiment by Andreoni and Rao (2011) illustrates this wisdom, but with a twist about how giving is activated.
Again, a laboratory Dictator Game is the backdrop. In a baseline game there was no communication between dictators and recipients. In the Ask condition, recipients could make a request of dictators, including a short written statement. In the Explain condition, the dictators could include a short explanation along with their choice. Both of these allow only one-way communication. In Ask-Explain and Explain-Ask conditions, communication goes two ways, but who speaks first is switched in the two conditions.
As is common, the baseline resulted in about 16% given. Asking improved this. Most recipients asked for 50%, said something about fairness, and this boosted giving to 24%. With explaining came the first big surprise: giving dropped to 6% and dictators most commonly said, “I’m sorry.” However, combining asking and explaining does not result in an averaging of the result. Recipients again ask for a 50-50 split, but now both dictators and recipients tend to mention fairness, regardless of which player moved first, and giving surges to almost 29%, with significantly more 50-50 splits—the highest among all conditions.
Andreoni and Rao added one more manipulation. They re-ran the two one-way communication conditions, but before subjects made their choices they actively engaged in imagining themselves in the other’s shoes. That is, they engaged in empathic thinking about the other player. The result was that one-way communication with induced empathic thinking looked indistinguishable from that in two-way communication.
What does this teach us? While the mental processes are not measured, the behavior is consistent with a simple story that linguists, sociologists, and language specialists would tend to support. Communication—a fundamental feature of any social interaction such as giving—requires empathic reasoning. Without communication we can maintain an intellectual awareness of a need yet still maintain a “willful indifference” to the emotions that an “empathic awareness” might then ignite. Perhaps, it is conjectured, asking is powerful because it forces people beyond an intellectual awareness into an empathic awareness, and it is the latter that is necessary for an altruist to become a giver.41
5.3 Diversity and the Socio-economics of Giving
In urban centers across North America and Europe, neighborhood diversity is increasingly common. This diversity is often lauded as a virtue in and of itself. From a public economics perspective, however, public good provision often decreases in the presence of diversity. The observed decrease in public goods includes spending less on schools, roads, and hospitals (Alesina et al., 1999, 2004; Poterba, 1997; Goldin & Katz, 1999). What is less clear is how diversity affects the support for privately provided public goods such as charities. Standard economic models suggest the predictive effect of diversity on privately provided public goods is unclear. If individuals sort into groups that are distinct based on characteristics such as ethnicity, religion, or income, then increased diversity may foster greater participation in organizations that allow for this sorting, resulting in an increase in giving to these types of groups. But if charities are perceived to benefit individuals that are outside of one’s group, then we might observe a decrease in giving.
Andreoni, Payne, Smith, and Karp (2011), using data from Canadian tax-filers, begin to shed light on this issue. Their data is at a neighborhood level (approximately 5000 households per neighborhood) spanning up to four censuses (15 years) and using over 17,000 neighborhood-year observations. They use an empirical methodology adapted from Vigdor (2002, 2004). By using shares of the population as a measure for group affiliation, one can develop a Fragmentation Index to measure the level of diversity in the neighborhood. This index is widely used in the literature and is easily interpreted as the probability that any two randomly selected individuals in the community belong to different groups. The authors observe that while the average adult donates approximately $200/year, an increase of 10% points in the Fragmentation Index for ethnic diversity implies a decrease in giving of $27, approximately a 14% reduction. The decline is attributable to the intensive (amount of giving) and not on the extensive (number of givers) margin. That is, increased diversity appears to make givers give less.
The research suggests that different ethnic groups respond differently to diversity. For a 10% point increase in the share of the identified group, giving by whites is higher by $92, by blacks is higher by $390, by east Asians is lower by $111. Moreover, there are strong effects of diversity based on the educational background of the neighborhoods. For a 10% point increase in the share of the identified religious grouping, Catholics’ donations increase by $69 but there is no statistically significant change in the level of giving by those affiliated with other religious groups.
Other work has also found that race and religion matter to givers. Hungerman (2008) found that charitable spending by all-white church congregations is more sensitive to increases in the shares of blacks in the county than more diverse congregations. He did not find a similar sensitivity, however, to changes in shares of other races (e.g., Hispanics). Hungerman (2009) also provides evidence to suggest that the effect of changes in government spending on church spending varies across communities that is tied to measures of racial diversity. Experimental work by Fong and Luttmer (2009, 2011) shows that racial composition affects perceptions about giving. This literature suggests there is more to understand about the impacts of diversity on charitable giving and the provision of charitable goods. If governments are looking to transfer more of their services to charities, then we should consider more how diversity affects charity operations and how these effects could affect the delivery of public goods by charities and other private groups.
6 Approach 4: The Giver’s Mind
Recently, decision scientists and economists have conducted experiments that have had an eye-opening effect on the study of giving. Dana, Cain, and Dawes (2006) showed that, rather than enter a $10 dictator game with an anonymous partner, many people would accept $9 and be allowed to leave with the potential recipient not being made aware of the choice to exit. This would seem to violate revealed preference—entering and taking $10 is optimal for a selfish person, and entering and giving $1 and keeping $9 would seem to be preferred by an altruist. So why would people prefer to exit? A second study, with Dana, Weber, and Kuang (2007), hid from people the consequences of their own actions on another subject—a maximizing choice for oneself either harmed or helped another. Subjects could find out whether their interests were aligned or opposed simply by clicking a box on the computer screen before making their choices. A surprising fraction refused the free information and made the choice that maximized their own payoff, willfully remaining ignorant of the consequences. Subjects were, the authors argue, preserving “moral wiggle room” that allowed them to escape the guilt of creating a negative externality by preserving a belief that maybe the externality was actually positive.42
This led people to ask, do people actually dislike giving? Are fundraisers, by putting people in the social situation that creates an expectation of meeting some norm or standard of generosity, actually making people worse off? Should we care about this from a public policy perspective?
These observations and arguments are reminiscent of a recent but important question raised about the efficient subsidies to the provision of public goods through private charities. Most notably, Diamond (2006) asked whether the warm-glow of giving is something that those concerned with social welfare should take into account. Andreoni (2006b) summarizes and amplifies these arguments. While the institutions themselves may manipulate warm-glow as an impulse or incentive to give, these authors argue that it is the final allocations of actual public good that should be what enters the welfare calculus. In contrast to this question, there is no debate about whether we should change welfare calculus to include the delight one might feel at getting a new sweater at a bargain price, nor the remorse one feels buying the sweater the day before the price was discounted. There is common agreement that welfare should depend on the allocation of sweaters and prices paid. What makes markets for giving different? Should social welfare calculations consider the means to an end in charity markets? Obviously, if the state has a compelling interest in the institutions per se then institution itself becomes a public good whose utility should be counted, but this is not the argument being made. This line of reasoning suggests that the answer to the question of how to calculate costs and benefits of giving—physical and social—should not lie solely in uncovering what is in the minds or hearts of donors, but include the consequences for the set of public goods that are provided by them and the deadweight cost of acquiring them. Moreover, the calculation must depend on the value relative to the next best alternative, which would appear to be government provision.
There is also a further question about what one can infer from an individual who shows reluctance to give, or a desire to avoid a solicitation. Obviously, one cannot and should not give on all occasions, just like one cannot and should not eat whenever food is available. A resistance to give may not indicate a lack of altruism, but could be a sign of discipline, restraint, and adherence to careful spending plans. What about an unwillingness to even be asked to give? Just as the smell of freshly baked cookies may make it difficult to be disciplined when on a diet, being asked to give may trigger psychologically uncomfortable feelings—feelings that exist in our minds because of natural instincts to be benevolent when it is helpful and when we can afford it—and avoiding temptation helps maintain our self-discipline.
In the next two subsections we summarize two recent papers that examine, in different contexts, the willingness of individuals to be solicited to give. Both provide evidence of individuals who appear to be very aware, perhaps at a subconscious level, of the need to exert control over how intensely they are solicited to give.
6.1 Social Costs of Social Pressure
DellaVigna et al. (2012) present an ambitious and important study on the “social pressure” costs of fundraising.43 They conducted a door-to-door fundraising field experiment that visited over 7600 homes in 2009. The baseline experiment was a standard cold call, where the fundraiser arrives at the door unexpectedly. A second condition announced the potential visit by leaving a flier on the front door of the home, indicating that a fundraiser would visit the home the next day at a specified time. A third condition used the fliers again, but this time the resident could check a box on the flier asking not to be disturbed. Finally, in a separate manipulation to estimate the opportunity cost of time, the fundraiser offered to pay the resident a small fee to take a short survey, with rates of pay and lengths of the survey varying. The study explored two key questions. First, do people avoid fundraisers, yet give because of some social pressure? Second, what is the social cost of fundraising, including the cost of social pressure?
Key to their analysis is the structural estimation of the utility equation
![]()
where ![]() is income,
is income, ![]() is the gift to the charity,
is the gift to the charity, ![]() is a utility parameter for the warm-glow of giving,
is a utility parameter for the warm-glow of giving, ![]() is a utility shift parameter,
is a utility shift parameter, ![]() is an estimated parameter for the social pressure cost, and I
is an estimated parameter for the social pressure cost, and I![]() is a function equal to 1 if the gift was under $10, that is, the authors assume that social cost is felt most severely when giving nominal amounts. Notice, the
is a function equal to 1 if the gift was under $10, that is, the authors assume that social cost is felt most severely when giving nominal amounts. Notice, the ![]() and
and ![]() parameters are identified from the random assignment to the “do not disturb” conditions, from the willingness to accept payment for answering a short survey, that is, to be inconvenienced in the service of a good cause, and by assuming the
parameters are identified from the random assignment to the “do not disturb” conditions, from the willingness to accept payment for answering a short survey, that is, to be inconvenienced in the service of a good cause, and by assuming the ![]() are normally distributed across individuals.44
are normally distributed across individuals.44
Estimating this utility function through iterated method of moments, the authors are able to estimate the desire to avoid and, by estimating the ![]() and
and ![]() , gain a sense of the net social pressure cost of fundraising. They are able to find evidence for both warm-glow altruism and social pressure. About half of donors they sample would prefer not to be contacted by the fundraiser. Moreover, the parameter estimates suggest refusing a request for a $1 donation has a social pressure cost of around $4, indicating that, in this study, the social costs of door-to-door fundraising are likely negative at the individual (although not necessarily societal) level.45
, gain a sense of the net social pressure cost of fundraising. They are able to find evidence for both warm-glow altruism and social pressure. About half of donors they sample would prefer not to be contacted by the fundraiser. Moreover, the parameter estimates suggest refusing a request for a $1 donation has a social pressure cost of around $4, indicating that, in this study, the social costs of door-to-door fundraising are likely negative at the individual (although not necessarily societal) level.45
6.2 Avoiding the Ask
The second study complements the DellaVigna et al., results by approaching a different venue. Andreoni, Rao, and Trachtman (2012) teamed with the Salvation Army for 4 days in December 2009 to perform a natural field experiment at a suburban Boston supermarket. The supermarket was chosen to be typical in that it faced a large parking lot and had two main entrances facing the lot. In a ![]() design, college aged women stood in Salvation Army aprons and rang bells at one door or both doors, and either simply rang or rang and said, “Merry Christmas, please give today.” Thus, a quarter of the patrons had an indirect ask that was easy to avoid (one door, just ringing), another quarter had an indirect ask that was difficult to avoid (both doors covered), a third quarter had direct asks that were easy to avoid (one door and “please give”), while a final quarter were directly asked to give and were difficult to avoid (two doors of “please give”).
design, college aged women stood in Salvation Army aprons and rang bells at one door or both doors, and either simply rang or rang and said, “Merry Christmas, please give today.” Thus, a quarter of the patrons had an indirect ask that was easy to avoid (one door, just ringing), another quarter had an indirect ask that was difficult to avoid (both doors covered), a third quarter had direct asks that were easy to avoid (one door and “please give”), while a final quarter were directly asked to give and were difficult to avoid (two doors of “please give”).
The four conditions were randomized into 16 blocks over four consecutive days, the “kettles” were swapped out 64 times to count donations, helpers counted the number of passings through each door, and the number of givers. In all, over 17,000 entrances and exits were counted. The randomization allowed the authors to account for those wishing to avoid, those seeking an opportunity to give, the gifts of those opting to pass by the bell ringer and to forecast the lost contributions of those who avoided the bell ringer.
Notice the experimental manipulations here were very minor, as were the costs to avoid—a person may need to spend 45 s walking farther through the parking lot to avoid a simple “please give today.”
The findings were that shoppers did almost nothing to avoid the simple bell ringing. However, when the ringing was accompanied by a direct ask, about 30% of shoppers used an alternative entrance when they could. Only about 1.5% actively sought an opportunity to give. Surprisingly, however, those who were captured by the coverage of two doors gave, on average, just as frequently and just as much as those shoppers who did not avoid being asked, a result similar to that found in field data (Meer & Rosen, 2010). In other words, there appeared to be virtually no sorting on the magnitude or propensity to donate. People, it seemed, were not avoiding giving a small amount or saying “no,” but instead appeared to be avoiding saying “yes.” Much like the self-control or present-bias literature, people appeared to be using the tactic of avoiding being asked as a means to control their impulse to give when directly asked by a human to give to a worthy cause.
6.3 Is Fundraising Bad for Society?
The last two sections indicate that many, if not most, people dislike being asked to give. Does that mean that fundraising is bad for society? The only way to answer this is with another question: compared to what? There are many ways to organize a society to achieve certain social goals, and each leads to a different set of burdens and distortions. For instance, most people dislike paying taxes but like a rich set of public services. Their efforts at avoiding taxes are what we call deadweight loss of taxation, and the consequence of taxes on the distribution of consumption is what we call the incidence of taxation. If instead of mandated giving through taxes we opt for voluntary giving through charities, we create another type of distortion and incidence. One distortion is that people must tolerate saying “no” or avoid saying “yes” to many worthy causes. A question of incidence is that the “tax” of charitable fundraising falls disproportionately on those who are the most “charitable,” that is, those who are most willing to give. Moreover, compared to government provision, where preferences are represented by votes, with private giving the preferences of people are expressed by their donations. Hence, the distribution of goods provided through giving is likely to focus more on goods enjoyed by the wealthy, such as operas, art museums, and elite colleges, rather than on goods favored by the poor, such as parks, crime prevention, and primary education.
The question of whether fundraising is bad, therefore, relies on how one feels about the efficiency and incidence of different systems of providing social goods. For instance, how costly is it for givers to decline requests to give? Is the cost ephemeral and easily forgotten, or long lasting? Can givers adopt cognitive strategies that make dealing with fundraisers less stressful, such as planning annual giving budgets and sticking to them? Or is asking the donor with the big heart for a gift like asking the chronic overeater if he would like to see the desert menu—is it cruelly preying on the vulnerable? Is it inequitable for a society to let those with the greatest wealth also have the greatest say in what kinds of goods are provided, or is it efficiency enhancing to let wealthy donors build self-named monuments (think of Andrew Carnegie) for their own and society’s benefit?
These questions about how to organize institutions, examining the distortions and incidence of each institutional framework, are deep, difficult, important, and largely unexplored within economics.46 Breaking the issue down, starting with attempting an estimate of the deadweight loss of fundraising, would open up a much-needed discussion in the literature on public policy toward charitable giving.47
7 Fundraising and the Giver’s Mind
In the prior sections we have taken the perspective of the social planner by asking what are the impacts on welfare of certain institutions, such as tax deductions for donations, and the relative costs of fundraising versus government taxation. Here we take the perspective of the charity that, with a fundraising goal, is looking for the most efficient and effective way to reach it. This literature, which is blossoming quickly, is often built on the assumption that, since fundraising is a reality in our society, economists can use what we know about incentives and equilibria to help build better fundraising mechanisms.
Before proceeding with this section, it is worth placing a few questions in the backs of readers’ minds. First, is this a topic for economics, or is it better thought of as marketing? The pragmatic answer could be that, given that a society has chosen fundraising and charity as the means to, for instance, subsidize education, it implies that economists can be helpful in making this successful in the most efficient way. But this answer begs an important question: how is efficiency defined within the context of fundraising schemes that may prey on primal desires for empathy, conformity, and social approval, among other “social distortions?” Certainly not every fundraising scheme that raises more money is also a scheme that improves efficiency. This literature, which is of great intrinsic and practical interest, is presented here along with a notice that there remain many unanswered questions about the impacts of these ideas on social welfare.
7.1 Charity Auctions
John Morgan (2000) first asked why so many charities raise money through lotteries. The charity offers a prize P, itself paid for through donations, and sells raffle tickets for a chance to win P. If they sell n raffle tickets, each ticket has a ![]() chance of winning. The remarkable thing that Morgan shows is that such a raffle can actually increase donations. If each dollar donated buys one ticket, then in expectation a donation of d costs only
chance of winning. The remarkable thing that Morgan shows is that such a raffle can actually increase donations. If each dollar donated buys one ticket, then in expectation a donation of d costs only ![]() . Hence, the lottery mechanism has qualities similar to a subsidy and in theory should increase donations. The brilliant innovation, however, is that this subsidy requires no government and no taxation. Morgan and Sefton (2000) confirm in a laboratory study that lotteries do indeed increase giving.
. Hence, the lottery mechanism has qualities similar to a subsidy and in theory should increase donations. The brilliant innovation, however, is that this subsidy requires no government and no taxation. Morgan and Sefton (2000) confirm in a laboratory study that lotteries do indeed increase giving.
This work inspired others to consider new auction or prized-based mechanisms for raising funds. One such mechanism is an all-pay auction: people bid for the prize, the highest bidder wins it, but all bids—even the losing bids—must be paid. Theoretically, the all-pay auction should be superior to an auction in which just the winner pays. The reason is intuitive. Without the donation aspect of bids, all-pay and winner-pay should yield identical revenue. Now add in that profits go to charity and imagine the second highest bidder in a winner-pays auction. By becoming the top bidder the person gains the object, but loses the other person’s donation to the public good, making winning less sweet. The incentive in the charity auction, therefore, is to bid less aggressively. This same effect is not present in all-pay auctions, since all bids are paid, win or lose.48
Despite the clear theoretical predictions, evidence on the relative performance of lotteries, winner-pay, and all-pay auctions is mixed. Schram and Onderstal (2009) confirm the prediction, while Corazzini, Faravelli, and Stanca (2009) show that all-pay fares worse than the other two. An important field experiment by Carpenter, Holmes, and Matthews (2008) again shows that all-pay auctions fare relatively poorly, but because of the setting they are able to offer an additional concern about all-pay auctions: people appear not to like them–many people in the field experiment chose not to participate in the auction.
Carpenter, Holmes, and Matthews (2010, 2011) recently add a variation to all-pay that shares elements of the giving little-by-little mechanisms presented earlier. They call it a bucket auction. Imagine donors sitting in a circle. One donor begins by placing a dollar in a bucket and passing it left. The next donor puts in another dollar then passes the bucket left, and so on. If a donor passes the bucket without adding a dollar, the donor loses all prior contributions and any chance at winning the prize. The winner of the prize is the last one to contribute. Carpenter et al. show that the bucket auction raises more money than any prize-based fundraising device considered. Why? One can think of the bucket auction as a modification of a Dutch clock auction. These are known to be easy to explain, easy to understand, and to extract great surplus from bidders. So, even though it also has elements in common with all-pay auctions, the bucket auction is both successful and, apparently, revealed preferred by the donors in the authors’ field experiments.
7.2 Motivational Crowding
In a famous study by Titmus (1970), he argued that paying for blood donations might actually make people less likely to supply blood than if it is accepted as a pure donation. The reason, he conjectured, is that by paying for blood one is denying the individual the joy of acting unselfishly. In modern terms, reducing the cost of giving blood in turn diminishes the (possibly self-) signaling value of being a blood donor, “crowding out” this incentive to give.
Although Titmus’ book was heavily scrutinized and often dismissed by scholars, there have been mounds of evidence that all manner of moral choices are subject to such “motivational crowding out.”49 Recently Mellstrom and Johannesson (2008), using a very clever field experiment, revisited Titmus’ conjectures. They explored whether introducing compensation for donations of blood reduces the number of donors willing to donate blood. The researchers divided their subjects into three groups: those asked to donate blood with no compensation, those asked to donate blood with compensation, and those asked to donate blood with compensation but an opportunity to donate that compensation to a charity. The authors found little difference in behavior by men across the three treatments, but found the cash payment appeared to crowd out the willingness to contribute by women. However, the motivational crowding by women was undone when they were given an opportunity to donate the payment to a charity. That is, by restoring the signaling value, the motivation to give was restored as well.
7.3 Peer Pressure
If, as argued earlier, individuals are sensitive to an audience when making charitable choices, should not the response be especially strong when that audience is a true peer? Meer and Rosen (2011) examine this using data on a lengthy panel of alumni donations to an anonymous university. See also Apinunmahakul and Devlin (2008). The data is rich with personal information, including not only one’s year of matriculation, but also major, extracurricular activities, SAT score, grade point average, and, most importantly, a person’s randomly assigned freshman roommate. The development office offered one more key piece of data: did an alumnus who volunteered as a fundraiser for the university attempt to contact their freshman roommate to seek a solicitation?
Meer and Rosen take great care to address issues of selection into volunteering and other potential confounding correlates with willingness to give. In the end the data show something surprising about the power of being asked by a peer, rather than by an unknown other alumnus. Peers increase the likelihood of a donation by 8.5%, increasing total donation by about 10.2%. Interestingly, these numbers are very close. This is because the peer solicitation has only a small and insignificant impact on the amount given, conditional on giving. That is, the marginal donors lured in by peer pressure give about the same as those lured in simply by an unknown alumnus, and so the predominant effect of peer pressure is on the likelihood of giving, rather than the amount given.
7.4 The Giving Habit
Can charitable values be taught? Can the habit of giving be acquired? The popular belief is that the answer to both questions is yes. Parents are encouraged to provide a good example so that children will adopt the giving practices they see in their parents, and charities believe that if they can get a donor to start giving, that not only will they continue to give as a habit but that as they become more wealthy they will give more and more.
The question of whether charitable giving can be taught was explored by Wilhelm, Brown, Rooney, and Steinberg (2008). Using the charitable giving supplement to the PSID, they found a strong positive correlation between the religious giving of adult children and their parents—the correlation matched that of the two households’ incomes. Non-religious giving was significantly correlated too, although the correlation was smaller. This parallels findings in the psychology literature that suggest charitable values can be “inherited” by the example set by parents.
Do adults gain a habit of giving? Meer (2013) looks at alumni of a university who become givers—typically very small givers—directly after graduation. He forms a somewhat mixed view of the giving habit. Those who begin giving right after graduation are more likely to be givers several years later, as the fundraisers believe. However, contrasting that, they do not appear to become more generous givers with time. Thus, the habit is formed on the extensive rather than the intensive margin.
7.5 Giving to Disasters
Imagine a hurricane or tsunami that causes immediate and great harm and, moreover, is intensively covered by the news. If, as conjectured earlier, empathy is an important step, how does this very emotional situation affect giving to help the victims, and does helping during disasters reduce other forms of giving?
Eckel, De Oliveira, and Grossman (2007) find interesting evidence of overstimulated empathy causing a reduction in giving. When people in Texas were primed with emotionally moving stimuli about hurricane Katrina victims shortly after the disaster, their giving fell, while those in Minnesota, with presumably less exposure, gave more when primed.50
This effect is reminiscent of the well-known “identifiable victim” problem of Thomas Schelling (1968), and studied more recently by Loewenstein, Slovic, and colleagues.51 A single flood victim pulls at one’s heart strings, and to deal with empathic feelings one can give. But thousands of victims present an emotionally overwhelming problem and instead, the hypothesis goes, our minds treat them as “statistical victims” in order to regulate our overwhelming empathy. More information on the depths of the disaster, in other words, can reduce giving.
The question often asked about giving during disasters is, does this giving draw donations away from other charities? Systematic evidence on this is difficult to find. Anecdotally, charities unrelated to the disaster report drops in giving in the midst of the disaster, but only small or imperceptible effects over the longer horizon. Brown, Harris, and Taylor (2012) study donations made in 2004 and 2006 to explore the effects of the 2004 Indian Ocean tsunami on donations to natural disasters. Backing up the consensus view, they find little evidence to suggest that donations given to support the tsunami relief efforts divert donations away from future donations to other charitable causes.
7.6 Giving Bundled with Consuming
When a for-profit company promises to give a share of its sales or profits to a charitable cause, is it because the firm has a heart? Perhaps, but it also has keen business sense according to McManus and Bennet (2011). In a field experiment run in collaboration with an online store, they found that shoppers paid little attention to the details of this bundled donation and consumption, but instead showed particularly strong preferences for the bundled good versus a good without the bundled donation, even though providing a donation directly to the charity and purchasing the good separately would have saved the consumer considerable sums.
Gneezy, Gneezy, Nelson, and Brown (2010) ran a field experiment showing further the large effect bundling a good with a charitable donation has on the willingness to pay for the bundle. Subjects were told that they could pay any price they wished to for a good, and that half the price would go to charity. Compared to a posted price, this “pay-what-you-want” pricing strategy created greater revenue and higher profits for the firm, despite the fact that the posted price was available for consumers to choose in pay-what-you-want.
These results show how savvy marketers can exploit the giver’s weakness for their own profit and, arguably, for society’s gain as well.
8 Conclusion
This chapter’s goals were to summarize and integrate the main contributions since the last large survey written in 2006 and to present and discuss the themes and questions that we think will carry the field forward.
A fresh look at the data revealed several interesting trends in giving. First, while giving has remained high in the US, the composition of those gifts is shifting. Individuals, who made up about 80% of the giving dollars from 1970 to 1990, now only comprise about 72%. Bequests, which were about 12% in 1970, had fallen to 8% by 2010. Corporate giving was constant at about 2% of all giving. Foundations, however, grew from about 6% of all giving in the 1970s and 1980s to about 14% of donations by 2010. Part of this shift to foundations could be for tax reasons—reductions in estate taxes may have led people to give while alive in order to take deductions against income. Another reason could be the rapid concentration of wealth in the US over the past 20 years. This means that both the demographics of who gives, and the means by which they give, has changed in ways economists have yet to adequately study.
These changes are reflected in the data when it is broken down by the average household giving in the postal code. Since 1990 the gap in dollars given by those in the top income tercile and those in the low and middle terciles has exploded. This confirms that high income and high wealth donors are taking a larger role in the charitable sector. Giving by this economic class has been difficult for economists to study, largely because of data restrictions, but should be an increasingly important focus for policy analysis.
In addition to, or perhaps because of, the shift in the economic class of donors, the composition of donations has changed too. Religious giving in some countries (such as the US) has grown far faster than most other types of giving, followed by giving to educational institutions. Economists are only just beginning to take seriously the fact that religious giving may respond differently to taxation and fundraising incentives, and now that its dominance has become so much greater, the urgency and interest in understanding the special nature of religious giving has grown too.
A number of other themes have become apparent in preparing this survey. First is that interest in fundraising has reached a fever pitch. While we see this as a healthy recognition of reality and a powerful way for economists to use their tools of experimental analysis, econometric rigor, and theory of mechanism design in a purposeful way, we also think that time has come to step back and ask what purpose we are serving. As public economists, our first concern is to ask what does the greatest good for the greatest number. Selecting an institution of private philanthropy and fundraising rather than, for instance, government provision and taxation, is to swap one social aggregator with its incumbent distortions for another. Private provision means people vote with their dollars rather than their ballots, and pay the distortionary costs of avoiding fundraisers and saying no rather than the distortionary costs of avoiding taxation. Explicit recognition that each institutional form offers its own costs, benefits, and incidence is, we think, essential to moving forward to understanding how to improve the world we inhabit. Moreover, economists should avoid the automatic assumption that just because a charity raises money it also raises welfare or affects social equity. There are many poorly understood costs and benefits of the charitable sector that need to be accounted for when thinking of charitable giving from the standpoint of welfare.
Another main lesson of this review is that asking for donations is essential to understanding the strategic relationship between a charity and its donors, and understanding this relationship more clearly will help both fundraisers and policy makers.
Another key next step in understanding the strategic forces in charity markets is to look at how charities compete with each other. Here there are a number of open areas for research. First, when one charity gains a new donation, does another charity lose one? That is, is fundraising socially wasteful by simply moving donations among charities? Second, do the competitive forces among charities lead to innovations in fundraising which rise or fall under competitive pressures? Just as competition brought us technical innovations with private goods, does it bring us better charitable goods, better fundraising mechanisms, and more efficient private provision of charitable goods?
The next area that seems ripe for investigation is the effect of the Internet on the relationship between donors and the charity. Reducing donations to a few quick clicks is a dramatic reduction in transaction costs, which should increase giving, but also a severe depersonalization of donation experience, which undercuts some of the key motivators of giving. Which effect dominates? Is Internet fundraising better for society?
A closely related topic is the role of social networks in giving. We learned that being asked by a friend is even more powerful than being asked by a stranger, even if it is a distant friend. With the pervasiveness of social media websites, are there new frontiers for fundraising as well, or new perils?
Finally, collecting charity is just one side of the social welfare equation, and the other side has gone virtually unstudied. That is, what is the effect of a charity on the recipients of that charity? Does receiving food, shelter, education, a cure for cancer, comfort and refuge, esthetic beauty, or a safe place for children to play make for a stronger, more sympathetic, and more tolerant society? Or does giving donations to private schools that benefit one’s own children, or to churches, synagogues, mosques that benefit one’s own faith, or to operas and museums that benefit one’s own class create a more segregated world, isolated from the needs of others, and thus tearing at the fabric of society?
We have presented a number of important and valuable findings about charity and have issued a number of challenges as well. All is meant in the spirit of inspiring research and encouraging a broader view of the kinds of questions economists can and should ask about giving, fundraising, and consuming charitable goods and services.
References
1. Abrams BA, Schmitz MA. The crowding out effect of government transfers on private charitable contributions. Public Choice. 1978;33:29–39.
2. Abrams BA, Schmitz MA. The crowding out effect of government transfers on private charitable contributions: Cross sectional evidence. National Tax Journal. 1984;37:563–568.
3. Alesina A, Baqir R, Easterly W. Public goods and ethnic divisions. The Quarterly Journal of Economics. 1999;114(4):1243–1284.
4. Alesina Alberto, Baqir R, Hoxby C. Political jurisdictions in heterogeneous communities. Journal of Political Economy. 2004;112:348–396.
5. Andreoni J. Privately provided public goods in a large economy: the limits of altruism. Journal of Public Economics. 1988;35(1):57–73.
6. Andreoni J. Giving with impure altruism: Applications to charity and Ricardian equivalence. The Journal of Political Economy. 1989;97(6):1447–1458.
7. Andreoni J. Impure altruism and donations to public goods: A theory of warm-glow giving. The Economic Journal. 1990;100(401):464–477.
8. Andreoni J. An experimental test of the public-goods crowding-out hypothesis. American Economic Review. 1993;83:1317–1327.
9. Andreoni J. Toward a theory of charitable fundraising. Journal of Political Economy. 1998;106:1186–1213 [December].
10. Andreoni J. Leadership giving in charitable fund-raising. Journal of Public Economic Theory. 2006a;8:1–22.
11. Andreoni J. Philanthropy. In: Kolm S-C, Mercier Ythier J, eds. Handbook of Giving, Reciprocity and Altruism. Amsterdam: North Holland; 2006b;1201–1269.
12. Andreoni J, Bernheim BD. Social Image and the 50–50 Norm: A Theoretical and Experimental Analysis of Audience Effects. Econometrica. 2009;77(5):1607–1636.
13. Andreoni J, List JA. Special issue on charitable giving and fundraising. Journal of Public Economics. 2011;95.
14. Andreoni J, McGuire MC. Identifying the free riders: A simple algorithm for determining who will contribute to a public good. Journal of Public Economics. 1993;51:447–454.
15. Andreoni J, Miller JH. Giving according to GARP: An experimental test of the consistency of preferences for altruism. Econometrica. 2002;70(2):737–753.
16. Andreoni J, Payne AA. Do government grants to private charities crowd out giving or fundraising? American Economic Review. 2003;93:792–812.
17. Andreoni J, Payne AA. Is crowding out due entirely to fundraising? Evidence from a panel of charities. Journal of Public Economics. 2011a;95(5–6):334–343.
18. Andreoni, J., & Payne, A.A. (2011b). Crowding-out charitable contributions in Canada: New knowledge from the north. No. w17635. National Bureau of Economic Research. Cambridge, MA.
19. Andreoni J, Rao J. The power of asking: How communication affects selfishness, empathy, and altruism. Journal of Public Economics. 2011;95:513–520.
20. Andreoni J, Brown E, Rischall I. Charitable giving by married couples: Who decides and why does it matter? Journal of Human Resources. 2003;38:111–133.
21. Andreoni, Harbaugh, & Vesterlund (2008). Altruism in experiments in the new palgrave dictionary of economics (2nd ed.).
22. Andreoni, J., Payne, A., Smith, J.D., & Karp, D. (2011). Diversity and donations: The effect of religious and ethnic diversity on charitable giving. No. w17618. National Bureau of Economic Research. Cambridge, MA.
23. Andreoni, J., Rao, J.M. & Trachtman, H. (2012). Avoiding the ask: A field experiment on altruism, empathy, and charitable giving. No. w17648. National Bureau of Economic Research. Cambridge, MA.
24. Andreoni J, Vesterlund L. Which is the fair sex? Gender difference in altruism. Quarterly Journal of Economics. 2001;116(1):293–312.
25. Apinunmahakul A, Devlin RA. Social networks and private philanthropy. Journal of Public Economics. 2008;92(1):309–328.
26. Ariely D, Bracha A, Meier S. Doing good or doing well? Image motivation and monetary incentives in behaving prosocially. American Economic Review. 2009;99(1):544–555.
27. Bakija J, Heim BT. How does charitable giving respond to incentives and income? New estimates from panel data. National Tax Journal. 2011;64(2):615–650.
28. Bardsley N. Dictator game giving: Altruism or artefact? Experimental Economics. 2008;11(2):122–133.
29. Bekkers RHFP. Volunteerism. In: Darity Jr WA, ed. International encyclopedia of the social sciences. 2nd ed. Detroit: Macmillan Reference USA; 2008;641–643.
30. Bekkers R, Wiepking P. A literature review of empirical studies of philanthropy. Nonprofit and Voluntary Sector Quarterly. 2011;40(5):924–973.
31. Bergstrom T, Blume L, Varian H. On the private provision of public goods. Journal of Public Economics. 1986;29(1):25–49.
32. Blume-Kohout ME. Does targeted, disease-specific public research funding influence pharmaceutical innovation? Journal of Policy Analysis and Management. 2012;31:641–660.
33. Bolton GE, Katok E. An experimental test of the crowding out hypothesis: The nature of beneficent behavior. Journal of Economic Behavior and Organization. 1998;37(3):315–331.
34. Borgonovi F. Do public grants to American theatres crowd-out private donations? Public Choice. 2006;126(3):429–451.
35. Bound J, Jaeger DA, Baker RM. Problems with instrumental variables estimation when the correlation between the instruments and the endogenous explanatory variable is weak. Journal of the American Statistical Association. 1995;90(430):443–450.
36. Bowles S. Endogenous preferences: The cultural consequences of markets and other economic institutions. Journal of Economic Literature. 1998;36(1):75–111.
37. Bowles S, Hwang S-H. Social preferences and public economics: Mechanism design when social preferences depend on incentives. Journal of Public Economics. 2008;92(8–9):1811–1820.
38. Bracha A, Menietti M, Vesterlund L. Seeds to succeed?: Sequential giving to public projects. Journal of Public Economics. 2011;95(5):416–427.
39. Breman A. Give more tomorrow: Two field experiments on altruism and intertemporal choice. Journal of Public Economics. 2011;95(11):1349–1357.
40. Brown S, Harris MN, Taylor K. Modelling charitable donations to an unexpected natural disaster: Evidence from the US panel study of income dynamics. Journal of Economic Behavior and Organization. 2012;84(1):97–110.
41. Carpenter J, Holmes J, Matthews P. Charity auctions: A field experiment. Economic Journal. 2008;118:92–113.
42. Carpenter J, Holmes J, Matthews PH. Endogenous participation in charity auctions. Journal of Public Economics. 2010;94(11–12):921–935.
43. Carpenter J, Holmes J, Matthews PH. Jumping and sniping at the silents: Does it matter for charities? Journal of Public Economics. 2011;95(5–6):395–402.
44. Chan KS, Godby R, Mestelman S, Andrew Muller R. Crowding-out voluntary contributions to public goods. Journal of Economic Behavior and Organization. 2002;48(3):305–317.
45. Chao JC, Swanson NR. Consistent estimation with a large number of weak instruments. Econometrica. 2005;73(5):1673–1692.
46. Chetty, R. (2009). Bounds on elasticities with optimization frictions: A synthesis of micro and macro evidence on labor supply. No. w15616. National Bureau of Economic Research. Cambridge, MA.
47. Chetty R, Looney A, Kroft K. Salience and taxation: Theory and evidence. American Economic Review. 2009;99(4):1145–1177.
48. Chetty R, Saez E. Teaching the tax code: Earnings responses to an experiment with EITC recipients. American Economic Journal: Applied Economics. 2013;5(1):1–31.
49. Connolly. Does external funding of academic research crowd out institutional support? Journal of Public Economics. 1997;64(3):390–406.
50. Corazzini L, Faravelli M, Stanca L. Royal economic society. The Economic Journal. 2009;120(547):544–555.
51. Cornes R, Sandler T. The theory of public goods: non-Nash behaviour. Journal of Public Economics. 1984;23(3):367–379.
52. Correa A, Yildirim H. A theory of charitable fundraising with costly solicitations. American Economic Review. 2013;103(2):1091–1107.
53. Crumpler H, Grossman PJ. An experimental test of warm glow giving. Journal of Public Economics. 2008;92:1011–1021.
54. Cruz LM, Moreira MJ. On the validity of econometric techniques with weak instruments inference on returns to education using compulsory school attendance laws. Journal of Human Resources. 2005;40(2):393–410.
55. Dana J, Cain DM, Dawes RM. What you don’t know won’t hurt me: Costly (but quiet) exit in dictator games. Organizational Behavior and Human Decision Processes. 2006;100(2):193–201.
56. Dana J, Weber RA, Kuang JX. Exploiting moral wiggle room: Experiments demonstrating an illusory preference for fairness. Economic Theory. 2007;33(1):67–80.
57. DellaVigna S, List JA, Malmendier U. Testing for altruism, and social pressure in charitable giving. Quarterly Journal of Economics. 2012;127(1):1–56.
58. Diamond P. Optimal tax treatment for private contribution for public goods with and without warm glow preferences. Journal of Public Economics. 2006;90(4–5):897–919.
59. Duffy J, Ochs J, Vesterlund L. Giving little by little: Dynamic voluntary contribution games. Journal of Public Economics. 2007;91(9):1708–1730.
60. Eckel CC, Grossman PJ. Rebate versus matching: Does how we subsidize charitable contributions matter? Journal of Public Economics. 2003;87(3):681–701.
61. Eckel CC, Grossman PJ, Johnston RM. An experimental test of the crowding out hypothesis. Journal of Public Economics. 2005;89(8):1543–1560.
62. Eckel C, De Oliveira A, Grossman P. Is more information always better? An experimental study of charitable giving and Hurricane Katrina. Southern Economic Journal. 2007;74.
63. Engers M, McManus B. Charity auctions. International Economic Review. 2007;48(3):953–994.
64. Feldstein MS, Clotfelter C. Tax incentives and charitable contributions in the United States: A microeconometric analysis. Journal of Public Economics. 1976;5(1–2):1–26.
65. Feldstein MS, Taylor A. The income tax and charitable contributions. Econometrica. 1976;44(6):1201–1222.
66. Fong CM, Luttmer EF. What determines giving to Hurricane Katrina victims? Experimental evidence on racial group loyalty. American Economic Journal: Applied Economics. 2009;1(2):64–87.
67. Fong CM, Luttmer EF. Do fairness and race matter in generosity? Evidence from a nationally representative charity experiment. Journal of Public Economics. 2011;95(5):372–394.
68. Franzen A, Pointner S. The external validity of giving in the dictator game: A field experiment using the misdirected letter technique. Experiment Economics. 2013;16(2):155–169.
69. Gneezy A, Gneezy U, Nelson LD, Brown A. Shared social responsibility: A field experiment in pay-what-you-want pricing and charitable giving. Science. 2010;329(5989):325–327.
70. Goeree J, Holt C, Gomez R. Private costs and public benefits: Unraveling the effects of altruism and noisy behavior. Journal of Public Economics. 2002;83(2):257–278.
71. Goeree JK, Maasland E, Onderstal S, Turner V JL. How (not) to raise money. Journal of Political Economy. 2005;113(4):897–926.
72. Goldin C, Katz LF. The Shaping of higher education: The formative years in the United States, 1890–1940. Journal of Economic Perspectives, American Economic Association. 1999;13(1):37–62 [Winter].
73. Goldin J, Listokin Y. Tax expenditure salience. In: 7th annual conference on empirical legal studies paper. 2012.
74. Gruber J, Hungerman DM. Faith-based charity and crowd-out during the great depression. Journal of Public Economics. 2007;91(5):1043–1069.
75. Harbaugh WT, Mayr U, Burghart DR. Neural responses to taxation and voluntary giving reveal motives for charitable donations. Science. 2007;316(5831):1622–1625.
76. Huck S, Rasul I. Transactions costs in charitable giving: Evidence from two field experiments. The BE Journal of Economic Analysis and Policy. 2010;10 Article 1.
77. Huck S, Rasul I. Matched fundraising: Evidence from a natural field experiment. Journal of Public Economics. 2011;95(5):351–362.
78. Hungerman DM. Are church and state substitutes? Evidence from the 1996 welfare reform. Journal of Public Economics. 2005;89(11):2245–2267.
79. Hungerman DM. Race and charitable church activity. Economic Inquiry. 2008;46:380–400.
80. Hungerman DM. Crowd-out and diversity. Journal of Public Economics. 2009;93(5):729–740.
81. Jackson & Yariv (unpublished). Collective dynamic choice: The necessity of time inconsistency. unpublished.
82. Jack AI, Dawson AJ, Begany KL, et al. fMRI reveals reciprocal inhibition between social and physical cognitive domains. Neurolmage. 2013;66:385–401.
83. Jenni KE, Loewenstein G. Explaining the identifiable victim effect. Journal of Risk and Uncertainty. 1997;14(3):235–257.
84. Karlan D, List JA. Does price matter in charitable giving? Evidence from a large-scale natural field experiment. The American Economic Review. 2007;97(5):1774–1793.
85. Karlan D, List JA, Shafir E. Small matches and charitable giving: Evidence from a natural field experiment. Journal of Public Economics. 2011;95(5–6):344–350.
86. Khanna J, Posnett J, Sandler T. Charity donations in the UK: New evidence based on panel data. Journal of Public Economics. 1995;56:257–272.
87. Kingma BR. An accurate measurement of the crowd-out effect, income effect, and price effect for charitable contributions. Journal of Political Economy. 1989;97:1197–1207.
88. Konow J. Mixed feelings: Theories of and evidence on giving. Journal of Public Economics. 2010;94(3):279–297.
89. Lazear E, Malmendier U, Weber R. Sorting in experiments with application to social preferences. American Economic Journal: Applied Economics. 2012;4(1):136–163.
90. Li SX, Eckel CC, Grossman PJ, Brown TL. Giving to government: Voluntary taxation in the lab. Journal of Public Economics. 2011;95(9):1190–1201.
91. List JA. On the interpretation of giving in dictator games. Journal of Political Economy. 2007;115:482–493.
92. List JA. The market for charitable giving. The Journal of Economic Perspectives. 2011;25(2):157–180.
93. List JA, Lucking-Reiley D. The effects of seed money and refunds on charitable giving: Experimental evidence from a university capital campaign. Journal of Political Economy. 2002;110(1):215–233.
94. Manzoor SH, Straub JD. The robustness of Kingma’s crowd-out evidence: Evidence from new data on contributions to public radio. Public Choice. 2005;123:463–476.
95. Marx LM, Matthews S. Dynamic voluntary contribution to a public project. Review of Economic Studies. 2000;67(2):327–358.
96. Masatlioglu Y, Nakajima D, Ozbay EY. Revealed attention. The American Economic Review. 2012;102(5):2183–2205.
97. McManus B, Bennet R. The demand for products linked to public goods: Evidence from an online field experiment. Journal of Public Economics. 2011;95(5):403–415.
98. Meer J. Brother, can you spare a dime? Peer pressure in charitable solicitation. Journal of Public Economics. 2011;95(7):926–941.
99. Meer, Jonathan (2013). The habit of giving, economic inquiry. http://dx.doi.org/10.1111/ecin.12010.
100. Meer J, Rosen HS. Family bonding with universities. Research in Higher Education. 2010;51(7):641–658.
101. Meer J, Rosen HS. The ABCs of charitable solicitation. Journal of Public Economics. 2011;95(5):363–371.
102. Mellström C, Johannesson M. Crowding out in blood donation: Was Titmuss right? Journal of the European Economic Association. 2008;6(4):845–863.
103. Morgan J. Financing public goods by means of lotteries. Review of Economic Studies. 2000;67(4):761–784.
104. Morgan J, Sefton M. Funding public goods with lotteries: Experimental evidence. The Review of Economic Studies. 2000;67(4):785–810.
105. Okten C, Weisbrod BA. Determinants of donations in private nonprofit markets. Journal of Public Economics. 2000;75:255–272.
106. Palfrey TR, Prisbrey JE. Anomalous behavior in public goods experiments: How much and why? American Economic Review. 1997;87(5):829–846.
107. Payne AA. Does the government crowd-out private donations? New evidence from a sample of non-profit firms. Journal of Public Economics. 1998;69:323–345.
108. Payne AA. Measuring the effect of federal research funding on private donations at research universities: is federal research funding more than a substitute for private donations? International Tax and Public Finance. 2001;8:731–751.
109. Poterba, J. (1997). The estate tax and after-tax investment returns. No. w6337. National Bureau of Economic Research. Cambridge, MA.
110. Potters J, Sefton M, Vesterlund L. Leading-by-example and signaling in voluntary contribution games: An experimental study. Economic Theory. 2007;33(1):169–182.
111. Ribar DC, Wilhelm MO. Altruistic and joy-of-giving motivations in charitable behavior. Journal of Political Economy. 2002;110:425–457.
112. Rose-Ackerman S. Charitable giving and excessive fund-raising. Quarterly Journal of Economics. 1982;97:193–212.
113. Rose-Ackerman S. Altruism, nonprofits, and economic theory. Journal of Economic Literature. 1996;34(2):701–728.
114. Scharf, K., Smith, S. (2010). The price elasticity of charitable giving: Does the form of tax relief matter? IFS Working Papers W10/07. Institute for Fiscal Studies.
115. Schelling TC. The strategy of conflict. Cambridge Massachusetts: Harvard University Press; 1960.
116. Schelling TC. The life you save may be your own. Problems in Public Expenditure Analysis. 1968;127:129–130.
117. Schiff J. Does government spending crowd out charitable contributions? National Tax Journal. 1985;38:535–546.
118. Schiff J, Weisbrod BA. Competition between for-profit and nonprofit organizations in commercial markets. Annals of Public and Cooperative Economics. 1991;62(4):619–640.
119. Schram AJ, Onderstal S. Bidding to give: An experimental comparison of auctions for charity. International Economic Review. 2009;50(2):431–457.
120. Shang J, Croson R. A field experiment in charitable contribution: The impact of social information on the voluntary provision of public goods. The Economic Journal. 2009;119(540):1422–1439.
121. Small D, Loewenstein G. Helping a victim or helping the victim: Altruism and identifiability. Journal of Risk and Uncertainty. 2003;26(1):5–16.
122. Small D, Loewenstein G, Slovic P. Sympathy and callousness: The impact of deliberative thought on donations to identifiable and statistical victims. Organizational Behavior and Human Decision Process. 2007;102(2):143–153.
123. Steinberg R. Voluntary donations and public expenditures in a federal system. American Economic Review. 1987;77(1):24–36.
124. Thaler RH, Benartzi S. Save more tomorrow™: Using behavioral economics to increase employee saving. Journal of political Economy. 2004;112(S1):S164–S187.
125. Titmuss R. The gift relationship: From human blood to social policy. London: Allen & Unwin; 1970.
126. Tonin M, Vlassopoulos M. Disentangling the sources of pro-socially motivated effort: A field experiment. Journal of Public Economics. 2010;94(11):1086–1092.
127. Vesterlund LD. The informational value of sequential fund-raising. Journal of Public Economics. 2003;87:627–657.
128. Vesterlund L. Why do people give? In: Steinberg R, Powell WW, eds. The nonprofit sector. 2nd ed. Yale Press 2006.
129. Vigdor JL. Locations, outcomes, and selective migration. Review of Economics and Statistics. 2002;84(4):751–755.
130. Vigdor JL. Community composition and collective action: Analyzing initial mail response to the 2000 census. Review of Economics and Statistics. 2004;86(1):303–312.
131. Weisbrod BA. The nonprofit economy. Cambridge Massachusetts: Harvard University Press; 1991.
132. Wiepking P, Bekkers R. Does who decides really matter? Causes and consequences of personal financial management in the case of larger and structural charitable donations. Voluntas: International Journal of Voluntary and Nonprofit Organizations. 2010;21(2):240–263.
133. Wiepking P, Bekkers RHFP. Who gives? A literature review of predictors of charitable giving Part two: Gender, marital status, income, and wealth. Voluntary Sector Review. 2012;3(2):217–245.
134. Wilhelm MO, Brown E, Rooney PM, Steinberg R. The intergenerational transmission of generosity. Journal of Public Economics. 2008;92(10):2146–2156.
135. Yörük BK. Charitable giving by married couples revisited. Journal of Human Resources. 2010;45(2):497–516.
1See Feldstein and Clotfelter (1976), Feldstein and Taylor (1976), and the important book by Clotfelter (1985).
2See, for example, Vesterlund (2006), Andreoni (2001), Andreoni, Harbaugh, and Vesterlund (2008), Bekkers (2008), Bekkers and Wiepking (2011), Wiepking and Bekkers (2012), or the special issue of the Journal of Public Economics, edited by Andreoni and List (2011).
3The idea of charities as markets was first introduced in Andreoni and Payne (2003) and later developed in Andreoni (2006b) and List (2011).
4Bekkers (2012) provides additional information on regional differences in philanthropy.
5International comparisons of charitable giving, November 2006, Charities Aid Foundation briefing paper.
6World Giving Index 2011: A global view of giving trends, Charities Aid Foundation, 2011.
7In addition to there being differences in giving based on measures of family income, other observed differences include: donors that believe the most in the afterlife are less sensitive to changes in economic conditions; women are more likely to donate than men, and, conditioning on income, will give more; higher wealth families are less sensitive than lower wealth families to economic conditions in their giving; the decline in giving through a bequest is mostly attributable to a decline in giving by those estates valued at less than $2 million. See Giving USA 2011 and 2012 for details on these findings.
8Examples of other 501(c) nonprofits include civic leagues, business leagues, fraternal societies, social clubs, and agricultural organizations.
9One might also add a third observation: the languishing of giving to the arts.
10Also see Ribar and Wilhelm (2002) for a limit result arguing that for large n, only the warm-glow component of utility is going to have any significant influence on the margin of any person’s decision.
11See also Cornes and Sandler (1984) and Steinberg (1987). The pejorative nature of the term is deliberate, and meant to remind the reader that the notion of a warm-glow is something of a black box. That is, there are many notions—sympathy, guilt, norm adherence, social approval—that could fall under the umbrella of impure altruism, the essential feature is that, once the model is reduced to its barest form, own and others’ contributions.
12See Andreoni (1993), Bolton and Katok (1998), Konow (2010), Eckel, Grossman, and Johnston (2005), Palfrey and Prisbey (1997), Goeree, Holt, and Gomez (2002), and Andreoni and Miller (2002).
13The US International Grantmaking website, http://www.usig.org/index.asp, provides details on differential treatments of donations across countries.
14Besides having differing tastes about charity, spouses have another reason to bargain. As noted in a recent paper by Jackson and Yariv (unpublished), if spouses have differing discount rates, then the tastes of the spouse who is most impatient will be dominant in the decisions made about the present. The more impatient spouse will trade consumption in the future for preferred consumption today, and the more patient spouse will agree. The studies we discuss here are purely cross-sectional so they cannot address relative discounting, but this part of the bargaining process could be interesting if data on discount rates could be combined with data on choices of giving.
15This mimics lab data from dictator games in which male subjects showed greater price elasticity. See Andreoni and Vesterlund (2001).
16More detailed analysis revealed that the strong presence of religious giving, which men prefer to specialize in, was largely responsible for the strong male bargaining power. Separating religious from other giving, males and females had much more equal bargaining power, although still showed more “conflict” than in Yörük’s (2010) analysis.
17Contributing to the intrigue, Wiepking and Bekkers (2010) examine data on couples in the Netherlands and find that the household choices depend heavily on the “marital capital” and commitment, for which the Dutch collect more specific data (they code for cohabitants, committed couples who live apart, and married couples who live together). For instance, males were more likely to decide in heavily religious households, and relative education, not relative income was the more powerful determinant of bargaining power.
18If the matching grant is not fully utilized on one fund drive, it is often the case that the remainder will be recycled and used as a match for later fundraising campaigns. That is, in practice most “matching grants” are equivalent to unconditional cash gifts.
19Begin with the measurement ![]() . Substitute to find
. Substitute to find ![]() . Rearrange to see
. Rearrange to see ![]() , which indicates an elasticity of d with respect to m of virtually zero.
, which indicates an elasticity of d with respect to m of virtually zero.
20If the propensity to open envelopes is independent of the vulnerability to matching, then this will lead to unbiased estimates of the effect of matching, conditional on self-selecting into being treated. If opening the envelopes is itself a uncorrelated with a willingness to give, once treated, then the estimates will be unbiased measures of the effect of the treatment on the treated. Later sections on self-selection into treatment suggest that this assumption may not be met. The authors are interested in the more practical issue of the effect of mailings on giving, and thus welcome the influences of self-selection into treatment. The point of this footnote is to alert the reader to be cautious in generalizing these results.
21The experiment used a left-wing political organization and ran the experiment shortly after the election of George W. Bush as President in 2004. Further analysis on voter trends found the effects of the match were only significant in counties that one would expect to have felt most bitter about the tightly contested election, such as those living in a Republican leaning county or state. This feature diminishes the generalizability of the results to other charitable organizations.
22In an effort to shed more light on this issue, Karlan, List, and Shafir (2011) conducted a field experiment on 20,000 prior donors to a particular charity, looking at 1-to-1 and 3-to-1 matches. The sample includes both recent and “lapsed” donors who may not have given for over a decade. This experiment found a small positive effect of the match m on d, but only for those donors who are active givers.
23See Greenfield, The Nonprofit Handbook: Fundraising (2001) as well as the discussion in Andreoni (1998) on the support for this observation.
24The technical condition is that leadership gifts must be large enough that best replies by other givers will cover the fixed costs, thus eliminating the inferior equilibrium.
25The problem for the lead givers is that they are better off if they can convince others that the quality of the charity is higher than it truly is. The reason is that this will counteract the free riding problem, get more donations, and make the lead giver better off. Thus the lead gift must be large enough that the leader would only make such a large gift if the charity truly had high quality.
26This technique is well known, and is often applied by editors of Handbooks to encourage authors to agree to prepare chapters with distant due dates.
27The model attributes heterogeneity to income alone, for ease of analysis. However, it is also possible to interpret heterogeneity to preferences as well as incomes. The main aspect is to identify the best reply function of each donor, and to apply the Andreoni and McGuire (1993) algorithm for identifying donors for a given level of fundraising effort. Any heterogeneity can be subsumed into this solution, regardless of its source.
28The first studies relied on individual tax return data and/or survey data for measures of individual giving. However, it is difficult to identify the types of charitable goods to which the individuals are giving and the locations of the charities that are receiving these donations, making this accurate pairing impossible. See, e.g., Abrams and Schmitz (1978, 1984), and Schiff (1985).
29Although, see Manzoor and Straub (2005) for a challenge to Kingma’s results.
30For both of these types of organizations the effects are imprecisely measured. Health organizations can be difficult to study because these organizations exist in the private, public, and charitable sectors, making it difficult to understand the incentives and the organizational structures of the institutions that qualify as a charity. Relief organizations can also be difficult to study because in many cases the funds collected in one community are used in another community.
31Reinstein (2011) discusses a framework for thinking about displaced giving, while Rose-Ackerman (1982) discusses the potential for fundraising to only reallocate givers without actually raising more funds for the charitable sector as a whole. Both papers raise important issues that seem worthy of additional research.
32Huck and Rasul (2010) argue convincingly that other explanations of choice cannot explain the data. For instance, the fact that the second mailing gets any response is evidence that either preferences or transaction costs of giving have some random element. A random utility model, however, is contradicted by the fact that response rates fall by half in the reminder. This leaves randomness in transaction costs as a likely explanation. The simple two equation approach is, obviously and necessarily overly simple—it is the most one can do with two solicitations.
33People often ask about the validity of an experimental dictator game to explain behavior outside the laboratory, pointing to potential experimenter demand effects as a possible confound (List, 2007; Bardsley, 2008). Recently, Franzen and Pointner (2013) correlate behavior in the laboratory with real choices made many weeks later with a real solicitation for a charity, and found laboratory and field choices were significantly correlated. One way to reconcile the intuition of demand effects with this result is that in the field there are “fundraiser demand effects” that are similar to those in the laboratory, and affect similar people. This would then turn the argument upside down—dictator games are excellent games for studying giving in the field precisely because they contain demand effects.
34The authors offer each subject a choice from a menu of charities. The idea is to increase the likelihood that subjects are paired with a charity they support. One could imagine, however, using this selection as a commitment device: choose a charity that one dislikes so as to make it easier to say no in the giving stage. While the authors found no evidence of the strategic use of choice, the hypothesis was not given a clear test; all charities offered were likely to be supported by some degree by all subjects.
35A closely related paper by Crumpler and Grossman (2008), discussed earlier, makes this point clearly. In a similar set up, lab subjects can play a dictator game with a charity. However, the experimenter has already guaranteed the charity a large donation. Any gifts from subjects will be deducted from the experimenter’s guarantee. Thus, subjects’ gifts will have no marginal effect on total giving, but will have a compositional effect of including more money from the subject. Despite the strong incentives to give zero, the authors find 57% of subjects donate, and about 20% of endowments go to charity. This is striking evidence in favor of a warm-glow motive.
36It is amusing how this also mirrors the political debates. Those who favor smaller government tend to discuss the government in terms of “your taxes,” while those wanting a larger presence for government discuss policy in terms of “your schools” or “your highways.”
37This set of results is also striking in line with the results of a neuro-economics study by Harbaugh, Mayr, and Burghart (2007), which showed that people enjoyed giving to charity, even if it was a forced versus a voluntary gift, but the joy of voluntary giving (as measured by neural activity in the pleasure centers of the brain) was higher than for involuntary giving.
38See Andreoni (1998) for a discussion of these practices and a theory of seed money as signals for charitable giving, and see List and Lucking-Reiley (2002) for a field experiment supporting this model.
39Adam Smith famously discussed this self-monitoring in the Theory of Moral Sentiments as the notion that inside our minds is an “impartial spectator” who evaluates the moral value of our choices, and whose opinion of us matters greatly. Smith did not speculate as to whether this spectator, while impartial, was also naïve. That is, are we capable of hiding our true intentions from the impartial spectator? Stated differently, do we benefit from signaling our true types to the spectator (or perhaps hiding our true types by pooling), or is the spectator, who, after all lives in the same neighborhood as our consciousness, smart enough to know our true types, but simply judges us by our choices.
40In a complementary condition, the random device instead forced dictators to “give 1”. Even though no subjects ever gave just one in the first condition, as the likelihood of this forced choice grew, the pool at give 1 did as well.
41Recent neurological studies back this up. Jack, Dawson, Begany, Leckie, Barry, Ciccia, and Snyder (2013) show that the cool intellectual aspects of reasoning suppress the impulsive empathic parts of the brain, and vice versa. This suggests a physiological reason to avoid a fundraiser—an awareness that being asked will stimulate your emphathy and thus make it harder to engage your intellect when making a giving decision.
42See also Lazear, Malmendier, and Weber, (2012).
43See also Meer (2011) who shows the additional effect of peer pressure over and above any social pressure. When a college roommate calls to ask for a donation to the alma mater, both the likelihood and amount of giving rise significantly. Fong and Luttmer (2011) show as well that similarity among potential recipients and the donors also matters.
44While the “i” dimension refers to individuals, the “j” dimension refers to the fact that there were two charities under consideration in this field experiment. One was local and well known, and the other was conspicuously not local and likely unfamiliar.
45When the charity was the unfamiliar out-of-state charity, the cost appeared far higher–$37 cost of declining a $1 request. In other words, the benefit to society would need to be 37 times the value of the $1 to the individual in order to make the request a net positive for the world.
46Samuel Bowles (1998) argues for similar interactions between preferences, institutions, and welfare in a wide-ranging survey article including, among other things, institutions that shape social preferences.
47An important consideration here is how to infer preferences if indeed people are avoiding being asked as a means of self-control. Masatlioglu, Nakajima, and Ozbay (2012) discuss the difficulties of inference about preferences when individuals selectively pay attention to only a portion of the entire choice set.
48See Goeree et al. (2005), and Engers and McManus (2007). Extending this to endogenous participation, see Carpenter et al. (2009).
49See Bowles and Hwang (2008) for an application to giving.
50Fong and Luttmer (2009) study individual reactions to the characteristics of individual victims. They found that potential donors who report feeling affinity for those of their own ethnic or racial group tend to give more if the victims they see are from this group. Those who don’t express this affinity show no racial preference in giving.
51See Jenni and Loewenstein (1997), Small and Loewenstein (2003), Small, Loewenstein, and Slovic (2007), to name a few.