
Social Insurance: Connecting Theory to Data
Raj Chetty*,† and Amy Finkelstein†,‡, *Harvard University, †NBER, ‡MIT
Abstract
We survey the literature on social insurance, focusing on recent work that has connected theory to evidence to make quantitative statements about welfare and optimal policy. Our review contains two parts. We first discuss motives for government intervention in private insurance markets, focusing primarily on selection. We review the original theoretical arguments for government intervention in the presence of adverse selection, and describe how recent work has refined and challenged the conclusions drawn from early theoretical models. We then describe empirical work that tests for selection in insurance markets, documents the welfare costs of this selection, and analyzes the welfare consequences of potential public policy interventions. In the second part of the paper, we review work on optimal social insurance policies. We discuss formulas for the optimal level of insurance benefits in terms of empirically estimable parameters. We then consider the consequences of relaxing the key assumptions underlying these formulas, e.g., by allowing for fiscal externalities or behavioral biases. We also summarize recent work on other dimensions of optimal policy, including mandated savings accounts and the optimal path of benefits. Finally, we discuss the key challenges that remain in understanding the optimal design of social insurance policies.
Keyword
Unemployment; Health; Disability; Adverse selection; Market failures; Optimal policy; Sufficient statistics; Asymmetric information
1 Introduction
Over the last century, social insurance—government intervention in providing insurance against adverse shocks to individuals—has emerged as one of the major functions of government in developed countries.1 Social insurance programs began by providing limited coverage for risks such as injury at work and unemployment (Baicker, Goldin, & Katz, 1998; Fishback & Kantor, 1998). Today, governments provide substantial insurance for a broad range of risks, including health (Medicare and Medicaid in the US), disability and retirement (the Old Age, Survivors, and Disability insurance program), work injury (Worker’s Compensation), and unemployment (Unemployment Insurance).2 In the United States, expenditures on social insurance have risen from less than 10% of the federal government’s budget in the early 1950s to almost 60% today and continue to grow rapidly (Gruber, 2009). Social insurance expenditures are now a defining characteristic of modern developed economies. The fraction of GDP devoted to social insurance increases sharply with GDP per capita (Figure 1).
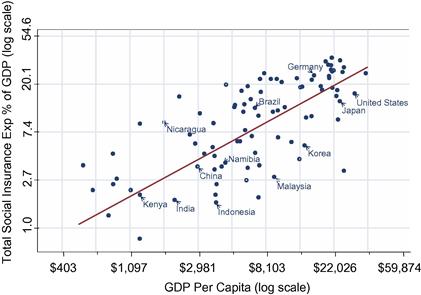
Figure 1 Social insurance vs. GDP per capita in 1996. Notes: Social insurance statistics are from International Labor Organization (2000). Social insurance is defined as total expenditures on social security, disability insurance, unemployment insurance, insurance against work-related injuries, and government provided health insurance. GDP statistics are from the Penn World tables. GDP is measured in PPP-adjusted 1996 US dollars.
Academic research on social insurance policies has grown alongside the expansion of these programs. Research on social insurance has addressed two broad questions. First, when should the government intervene in private insurance markets? The standard set of rationales includes private market failures, income redistribution, and paternalism. More recently, a growing empirical literature has sought to quantify the importance of these motives for government intervention. Much of this literature has focused on one particular market failure that can provide a rationale for social insurance: adverse selection due to asymmetric information. Second, if the government chooses to intervene, what is the optimal way to do so? The key issue here is that expanding social insurance creates moral hazard by distorting incentives. The literature on optimal policies seeks to identify the policies that maximize welfare, trading off the distortionary costs of social insurance programs with the benefits they provide in reducing exposure to risk. This literature has analyzed several dimensions of social insurance policies, ranging from the optimal level of benefits to whether the optimal tools are provision of liquidity (e.g., via loans) or state-contingent transfers.
Research on each of these two questions has traditionally been divided into two distinct methodological strands: a normative theoretical literature that focuses on welfare analysis and a positive empirical literature that documents the workings of private insurance markets or the impacts of social insurance programs. The limitation of this two-pronged approach is that the theoretical models do not by themselves offer quantitative answers to the key policy questions, while the descriptive empirical literature often has little to say about the welfare implications of its findings. For example, the rich theoretical literature on adverse selection has shown that private markets may provide too little insurance in the presence of asymmetric information. A more recent empirical literature has documented that adverse selection does in fact exist in many private insurance markets. However, the empirical techniques developed to identify the existence of selection do not, by themselves, permit even qualitative comparisons of the welfare costs of selection across markets, let alone quantitative welfare statements. Similarly, a large theoretical literature has characterized the properties of optimal insurance contracts in the presence of moral hazard. In parallel, empirical work has documented the causal impacts of social insurance programs on a broad range of behaviors, ranging from job search to health expenditures. Again, however, the implications of estimates of parameters such as the elasticity of unemployment durations with respect to benefits for optimal policy were unclear from the initial empirical literature.
Over the past two decades, researchers have made considerable progress in connecting theoretical and empirical work on social insurance to make empirically grounded statements about welfare and optimal policy. For instance, recent work has shown how data on selection patterns in insurance markets can be used to quantify the welfare costs of adverse selection in models of asymmetric information. Similarly, researchers have developed new methods of mapping estimates of behavioral elasticities to statements about the optimal level of social insurance benefits.
In this survey, we provide an overview of some of the key advances in connecting theory to data in analyzing the welfare consequences of social insurance. In focusing on this goal, we deliberately do not provide a comprehensive survey of the literature on social insurance. We cover only a selected subset of the many theoretical studies that have advanced the literature. We also discuss only a small subset of the numerous empirical studies that have estimated relevant empirical parameters. Readers seeking a more detailed discussion of empirical evidence on behavioral responses to social insurance may refer to Krueger and Meyer (2002) and Cutler (2002).
We divide our review of the literature into two sections, corresponding to the two major questions discussed above. In Section 2, we discuss motives for government intervention in insurance markets. In Section 3, we discuss optimal policy design once the government has decided to intervene. This literature on optimal design of social insurance has proceeded mostly independently from the work on the economic motivations for social insurance. As a result, the two sections of the paper draw on fairly distinct literatures. Indeed, one limitation of existing work on optimal government policy is that it typically assumes away the existence of formal private insurance markets rather than considering optimal policy design in an environment with endogenous market failures. We conclude in Section 4 by discussing this as well as some of the other broad challenges that remain in going from the work we review here to statements about optimal policy design.
2 Motivations for Social Insurance
Research in public economics usually begins with the question of why the government might have a reason to intervene in a particular private market transaction. Only then can one move forward to consider potential forms of intervention and their consequences. Standard economic rationales for social insurance include redistribution, paternalism, and market failures (Diamond, 1977). Within this relatively broad limit, our focus here is quite narrow. Following much of the recent literature, we concentrate on the potential role for social insurance in ameliorating one particular type of private market failure, namely selection. We return at the end of this section to briefly comment on other potential rationales for social insurance and some of the existing empirical work on them.
Modern theoretical work on adverse selection in insurance markets dates to the seminal work of Akerlof (1970) and Rothschild and Stiglitz (1976), which introduced a key motivation for social insurance: the competitive private equilibrium may under-provide insurance, creating scope for welfare-improving government intervention. Relative to the rich theoretical literature, empirical work on adverse selection in insurance markets lagged decidedly behind for many years. Indeed, in awarding the 2001 Nobel Prize for the pioneering theoretical work on asymmetric information, the Nobel committee noted this paucity of empirical work (Bank of Sweden, 2001).
Over the last decade or so, empirical research had made considerable progress in developing tools to identify whether asymmetric information exists in a given insurance market, as well as to begin to quantify the welfare costs of this asymmetric information and the welfare consequences of alternative public policy interventions. Some of the findings of this empirical work have suggested important refinements to the initial theory. In particular, a growing body of evidence suggests that in addition to heterogeneity in risk type, heterogeneity in preferences can be a quantitatively important determinant of demand for insurance. This is in contrast to the original theoretical literature on asymmetric information which focused on the potential for (unobserved) heterogeneity in risk type and assumed away the possibility of heterogeneity in preferences. Once one allows for heterogeneity in preferences in addition to risk type, the competitive equilibrium may look very different and the optimal policy intervention is no longer a priori obvious.
To summarize and discuss this empirical literature, we begin by presenting a highly stylized model and graphical framework that allow us to review the basic results of the standard theory and to describe their sensitivity to incorporating several “real world” features of insurance markets. The graphical framework provides a lens through which we discuss empirical work detecting whether selection exists and quantifying its welfare costs. Finally, we discuss some of the limitations of the work to date and some directions for further work.
2.1 Adverse Selection: Review of the Basic Theory
We structure our analysis using a simplified model of selection based on that presented in Einav, Finkelstein, and Cullen (2010a), and discussed further in Einav and Finkelstein (2011). We begin with the “textbook model” in which the qualitative results are unambiguous: adverse selection creates a welfare loss from underprovision of insurance, and public policy such as mandates can reach the efficient allocation and improve welfare. Even in this textbook case, however, the magnitudes of the welfare costs of adverse selection and the welfare gains from government intervention remain empirical questions. Moreover, these qualitative results can be reversed with the introduction of two important features of actual insurance markets: loads and preference heterogeneity. With loads, it is no longer necessarily efficient for all individuals to be insured in equilibrium, and mandates can therefore reduce welfare in some cases. With preference heterogeneity, the market equilibrium may lead to over insurance rather than underinsurance. Given the qualitative as well as quantitative uncertainty of the impact of selection and of government intervention, these naturally become empirical questions.
2.1.1 A Stylized Model
Setup and Notation. A population of individuals chooses from two insurance contracts, one that offers high coverage (contract ![]() ) and one that offers less coverage (contract
) and one that offers less coverage (contract ![]() ). To further simplify the exposition, assume that contract
). To further simplify the exposition, assume that contract ![]() is no insurance and is available for free, and that contract
is no insurance and is available for free, and that contract ![]() is full insurance. These are merely normalizations and it is straightforward to extend the analysis to partial coverage contracts or to more than two contracts (Einav et al., 2010a).
is full insurance. These are merely normalizations and it is straightforward to extend the analysis to partial coverage contracts or to more than two contracts (Einav et al., 2010a).
The key simplification we make is to fix the contract space, but allow the price of insurance to be determined endogenously. In other words, the set of contracts that insurance companies offer is determined exogenously, and the focus of the model is on how selection distorts the pricing of these existing contracts. The analysis is therefore in the spirit of Akerlof (1970) rather than Rothschild and Stiglitz (1976), who endogenize the level of coverage as well. This assumption greatly simplifies the analytical framework and makes it easier to both allow for multiple sources of heterogeneity across consumers and to illustrate some of the key insights and implications of selection models. However, it means that the analysis of the welfare consequences of selection or alternative possible government interventions is limited to the cost associated with inefficient pricing of a fixed set of contracts; it does not capture welfare loss that selection may create by distorting the set of contracts offered, which may be large in some settings. We return to this central issue below.
Define the population by a distribution ![]() , where
, where ![]() is a vector of consumer characteristics. For our initial discussion of the “textbook case,” we will assume that these consumer characteristics
is a vector of consumer characteristics. For our initial discussion of the “textbook case,” we will assume that these consumer characteristics ![]() include only characteristics relating to their risk factors; later, we will relax this assumption and explore the implications of allowing for preference heterogeneity.
include only characteristics relating to their risk factors; later, we will relax this assumption and explore the implications of allowing for preference heterogeneity.
Denote the (relative) price of contract ![]() by
by ![]() , and denote by
, and denote by ![]() and
and ![]() consumer
consumer ![]() ’s (with characteristics
’s (with characteristics ![]() ) utility from buying contracts
) utility from buying contracts ![]() and
and ![]() , respectively. Although not essential, it is natural to assume that
, respectively. Although not essential, it is natural to assume that ![]() is strictly decreasing in
is strictly decreasing in ![]() and that
and that ![]() . Finally, denote the expected monetary cost to the insurer associated with the insurable risk for individual
. Finally, denote the expected monetary cost to the insurer associated with the insurable risk for individual ![]() by
by ![]() . For ease of exposition, we discuss the benchmark case in which there is no moral hazard; the cost
. For ease of exposition, we discuss the benchmark case in which there is no moral hazard; the cost ![]() of insuring an individual does not depend on the contract chosen. Allowing for moral hazard does not fundamentally change the analysis, although it does complicate the presentation (Einav et al., 2010a). Of course, as we will discuss at length when we turn to the empirical work on selection in insurance markets, the potential presence of moral hazard as well as selection does pose important empirical challenges to the analysis of either one.
of insuring an individual does not depend on the contract chosen. Allowing for moral hazard does not fundamentally change the analysis, although it does complicate the presentation (Einav et al., 2010a). Of course, as we will discuss at length when we turn to the empirical work on selection in insurance markets, the potential presence of moral hazard as well as selection does pose important empirical challenges to the analysis of either one.
Demand for Insurance. Assume that each individual makes a discrete choice of whether to buy insurance or not. Since there are only two available contracts and their associated coverages, demand is only a function of the (relative) price ![]() . Assume that firms cannot offer different prices to different individuals. To the extent that firms can make prices depend on observed characteristics, one should think of the foregoing analysis as applied to a set of individuals that only vary in unobserved (or unpriced) characteristics. Assume that if individuals choose to buy insurance they buy it at the lowest price offered, so it is sufficient to characterize demand for insurance as a function of the lowest price
. Assume that firms cannot offer different prices to different individuals. To the extent that firms can make prices depend on observed characteristics, one should think of the foregoing analysis as applied to a set of individuals that only vary in unobserved (or unpriced) characteristics. Assume that if individuals choose to buy insurance they buy it at the lowest price offered, so it is sufficient to characterize demand for insurance as a function of the lowest price ![]() .
.
Given the above assumptions, individual ![]() chooses to buy insurance if and only if
chooses to buy insurance if and only if ![]() . We can define
. We can define ![]() , which is the highest price at which individual
, which is the highest price at which individual ![]() is willing to buy insurance. Aggregate demand for insurance is therefore given by
is willing to buy insurance. Aggregate demand for insurance is therefore given by
![]() (1)
(1)
and we assume that the underlying primitives imply that ![]() is strictly decreasing and differentiable.
is strictly decreasing and differentiable.
Supply and Equilibrium. We consider ![]() identical risk neutral insurance providers, who set prices in a Nash Equilibrium (a-la Bertrand). We further assume that when multiple firms set the same price, individuals who decide to purchase insurance at this price choose a firm randomly. In the “textbook case,” we assume that the only costs of providing contract
identical risk neutral insurance providers, who set prices in a Nash Equilibrium (a-la Bertrand). We further assume that when multiple firms set the same price, individuals who decide to purchase insurance at this price choose a firm randomly. In the “textbook case,” we assume that the only costs of providing contract ![]() to individual
to individual ![]() are the direct insurer claims
are the direct insurer claims ![]() that are paid out; later we will explore the implications of allowing for the possibility of loading factors, such as other administrative (production) costs of the insurance company.
that are paid out; later we will explore the implications of allowing for the possibility of loading factors, such as other administrative (production) costs of the insurance company.
The foregoing assumptions imply that the average (expected) cost curve in the market is given by
![]() (2)
(2)
Note that the average cost curve is determined by the costs of the sample of individuals who endogenously choose contract ![]() . The marginal (expected) cost curve in the market is given by
. The marginal (expected) cost curve in the market is given by
![]() (3)
(3)
In order to straightforwardly characterize equilibrium, we make two further simplifying assumptions. First, we assume that there exists a price ![]() such that
such that ![]() and
and ![]() for every
for every ![]() . In words, we assume that it is profitable (and efficient, as we will see soon) to provide insurance to those with the highest willingness to pay for it. Second, we assume that if there exists
. In words, we assume that it is profitable (and efficient, as we will see soon) to provide insurance to those with the highest willingness to pay for it. Second, we assume that if there exists ![]() such that
such that ![]() then
then ![]() for all
for all ![]() . That is, we assume that
. That is, we assume that ![]() crosses the demand curve at most once. These assumptions guarantee the existence and uniqueness of an equilibrium. In particular, the equilibrium is characterized by the lowest break-even price, that is:
crosses the demand curve at most once. These assumptions guarantee the existence and uniqueness of an equilibrium. In particular, the equilibrium is characterized by the lowest break-even price, that is:
![]() (4)
(4)
Measuring Welfare. We measure consumer surplus by the certainty equivalent. The certainty equivalent of an uncertain outcome is the amount that would make an individual indifferent between obtaining this amount for sure and obtaining the uncertain outcome. This is an attractive measure of welfare because it is a money metric. Total surplus in the market is the sum of certainty equivalents for consumers and profits of firms. We ignore income effects associated with price changes. Note that price changes have no income effects if the utility function exhibits constant absolute risk aversion (CARA).
Denote by ![]() and
and ![]() the certainty equivalent of consumer
the certainty equivalent of consumer ![]() from an allocation of contract
from an allocation of contract ![]() and
and ![]() , respectively. Under the assumption that all individuals are risk averse, the willingness to pay for insurance is given by
, respectively. Under the assumption that all individuals are risk averse, the willingness to pay for insurance is given by ![]() . We can write consumer welfare as
. We can write consumer welfare as
![]() (5)
(5)
and producer welfare as
![]() (6)
(6)
Total welfare is
![]() (7)
(7)
It is now easy to see that it is socially efficient for individual ![]() to purchase insurance if and only if
to purchase insurance if and only if
![]() (8)
(8)
In other words, in a first best allocation individual ![]() purchases insurance if and only if his willingness to pay is at least as great as the expected social cost of providing to him the insurance.
purchases insurance if and only if his willingness to pay is at least as great as the expected social cost of providing to him the insurance.
2.1.2 The Textbook Case
2.1.2.1 Adverse Selection Equilibrium
Figure 2 provides a graphical representation of the adverse selection insurance equilibrium for the “textbook case” we have just outlined. The relative price (or cost) of contract ![]() is on the vertical axis. Quantity (i.e., share of individuals in the market with contract
is on the vertical axis. Quantity (i.e., share of individuals in the market with contract ![]() ) is on the horizontal axis; the maximum possible quantity is denoted by
) is on the horizontal axis; the maximum possible quantity is denoted by ![]() . The demand curve denotes the relative demand for contract
. The demand curve denotes the relative demand for contract ![]() . Likewise, the average cost (
. Likewise, the average cost (![]() ) curve and marginal cost (
) curve and marginal cost (![]() ) curve denote the average and marginal incremental costs to the insurer from coverage with contract
) curve denote the average and marginal incremental costs to the insurer from coverage with contract ![]() relative to contract
relative to contract ![]() .
.
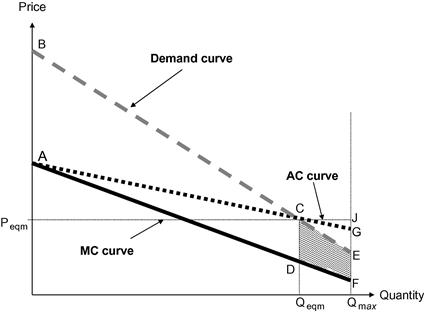
Figure 2 Adverse selection in the textbook setting. Notes: Figure 2 shows the demand (willingness-to-pay) for a high coverage ![]() relative to a lower coverage contract
relative to a lower coverage contract ![]() , and the associated marginal and average incremental cost (i.e., expected insurance claims) curves. The downward sloping marginal cost curve indicates adverse selection. The efficient allocation is for everyone to be covered by
, and the associated marginal and average incremental cost (i.e., expected insurance claims) curves. The downward sloping marginal cost curve indicates adverse selection. The efficient allocation is for everyone to be covered by ![]() (since willingness to pay is always above marginal cost) but the equilibrium allocation covers only those whose willingness to pay is above average costs, creating the classic under insurance result of adverse selection. The welfare loss from this under insurance is given by the trapezoid CDEF, representing the excess of demand above marginal cost for those who are not covered by
(since willingness to pay is always above marginal cost) but the equilibrium allocation covers only those whose willingness to pay is above average costs, creating the classic under insurance result of adverse selection. The welfare loss from this under insurance is given by the trapezoid CDEF, representing the excess of demand above marginal cost for those who are not covered by ![]() in equilibrium. (Source: Einav and Finkelstein (2011)).
in equilibrium. (Source: Einav and Finkelstein (2011)).
Because agents can only choose whether to purchase the contract or not, the market demand curve simply reflects the cumulative distribution of individuals’ willingness to pay for the contract. The difference between willingness to pay ![]() and
and ![]() is the risk premium, and is positive for risk averse individuals.
is the risk premium, and is positive for risk averse individuals.
Because of the “textbook” assumption that individuals are homogeneous in all features of their utility function—i.e., ![]() includes only characteristics relating to one’s expected claims
includes only characteristics relating to one’s expected claims ![]() —willingness to pay for insurance is increasing in risk type. This is the key feature of adverse selection: individuals who have the highest willingness to pay for insurance are those who, on average, have the highest expected costs. This is represented in Figure 2 by drawing a downward sloping
—willingness to pay for insurance is increasing in risk type. This is the key feature of adverse selection: individuals who have the highest willingness to pay for insurance are those who, on average, have the highest expected costs. This is represented in Figure 2 by drawing a downward sloping ![]() curve. That is, marginal cost is increasing in price and decreasing in quantity. As the price falls, the marginal individuals who select contract
curve. That is, marginal cost is increasing in price and decreasing in quantity. As the price falls, the marginal individuals who select contract ![]() have lower expected cost than infra-marginal individuals, leading to lower average costs.
have lower expected cost than infra-marginal individuals, leading to lower average costs.
The link between the demand and cost curve is arguably the most important distinction of insurance markets (or selection markets more generally) from traditional product markets. The shape of the cost curve is driven by the demand-side consumer selection. In most other contexts, the demand curve and the cost curve are independent objects; demand is determined by preferences and costs by the production technology. The distinguishing feature of selection markets is that the demand and cost curves are tightly linked since the individual’s risk type not only affects demand but also directly determines cost.
As noted, the efficient allocation is to insure all individuals whose willingness to pay is at least as great as their expected cost of insuring them. In the textbook case, the risk premium is always positive, since by assumption all individuals are risk averse and there are no other market frictions. As a result, the demand curve is always above the ![]() curve and, as shown in Figure 2, it is therefore efficient for all individuals to be insured
curve and, as shown in Figure 2, it is therefore efficient for all individuals to be insured ![]() . The welfare loss from not insuring a given individual is simply the risk premium of that individual, or the vertical difference between the demand and
. The welfare loss from not insuring a given individual is simply the risk premium of that individual, or the vertical difference between the demand and ![]() curves.
curves.
The essence of the private information problem is that firms cannot charge individuals based on their (privately known) marginal cost, but are instead restricted to charging a uniform price, which in equilibrium implies average cost pricing. Since average costs are always higher than marginal costs, adverse selection creates underinsurance, a familiar result first pointed out by Akerlof (1970). This underinsurance is illustrated in Figure 2. The equilibrium share of individuals who buy contract ![]() is
is ![]() (where the
(where the ![]() curve intersects the demand curve), while the efficient number is
curve intersects the demand curve), while the efficient number is ![]() ; in general, the efficient allocation
; in general, the efficient allocation ![]() is determined where the
is determined where the ![]() curve intersects the demand curve, which in the textbook case is never (unless there are people with risk probability of zero or who are risk neutral). The fundamental inefficiency created by adverse selection arises because the efficient allocation is determined by the relationship between marginal cost and demand, but the equilibrium allocation is determined by the relationship between average cost and demand.
curve intersects the demand curve, which in the textbook case is never (unless there are people with risk probability of zero or who are risk neutral). The fundamental inefficiency created by adverse selection arises because the efficient allocation is determined by the relationship between marginal cost and demand, but the equilibrium allocation is determined by the relationship between average cost and demand.
The welfare loss due to adverse selection arises from the lost consumer surplus (the risk premium) of those individuals who remain inefficiently uninsured in the competitive equilibrium. In Figure 2, these are the individuals whose willingness to pay is less than the average cost of the insured population, ![]() Integrating over all these individuals’ risk premia, the welfare loss from adverse selection is given by the area of the “dead-weight loss” trapezoid CDEF.
Integrating over all these individuals’ risk premia, the welfare loss from adverse selection is given by the area of the “dead-weight loss” trapezoid CDEF.
The amount of underinsurance generated by adverse selection, and its associated welfare loss, can vary greatly in this environment. As illustrated graphically in Einav and Finkelstein (2011), the efficient allocation can be achieved despite a downward sloping marginal cost curve if average costs always lie below demand. In contrast, if average costs always lie above demand, the private market will unravel completely, with no insurance in equilibrium.
2.1.2.2 Public Policy in the Textbook Case
One can use the graphical framework in Figure 2 to evaluate the welfare consequences of common public policy interventions in insurance markets that alter the insurance allocation. The comparative advantage of the public sector over the private sector is that it can directly manipulate either the equilibrium quantity of insurance (through mandates) or the equilibrium price of insurance (through either tax/subsidy policy or regulation of insurance company pricing). We briefly discuss each in turn.
Mandates. The canonical solution to the inefficiency created by adverse selection is to mandate that everyone purchase insurance, a solution emphasized as early as Akerlof (1970). In the textbook setting, mandates produce the efficient outcome in which everyone has insurance. However, the magnitude of the welfare benefit produced by an insurance purchase requirement varies depending on the specifics of the market since, as noted, the amount of underinsurance produced by adverse selection in equilibrium can itself vary greatly.
Tax subsidies. Another commonly discussed policy remedy for adverse selection is to subsidize insurance coverage. Indeed, adverse selection in private health insurance markets is often cited as an economic rationale for the tax subsidy to employer provided health insurance, which is the single largest federal tax expenditure. We can again use Figure 2 to illustrate. Consider, for example, a subsidy toward the price of coverage. This would shift demand out, leading to a higher equilibrium quantity and less underinsurance. The gross welfare loss would still be associated with the area between the original (pre-subsidy) demand curve and the ![]() curve, and would therefore unambiguously decline with any positive subsidy. A large enough subsidy (greater than the line segment
curve, and would therefore unambiguously decline with any positive subsidy. A large enough subsidy (greater than the line segment ![]() in Figure 2) would lead to the efficient outcome, with everybody insured.
in Figure 2) would lead to the efficient outcome, with everybody insured.
Of course, the net welfare gain from public insurance subsidies will be lower than the gross welfare gain due to the marginal cost of the public funds that must be raised to finance the subsidy; this may be quite large since the subsidy must be paid on all the infra-marginal consumers as well as the marginal ones. Given a non-zero deadweight cost of public funds, the welfare maximizing subsidy would not attempt to achieve the efficient allocation. It is possible that the welfare maximizing subsidy could be zero. That is, starting from the competitive allocation (point C), a marginal dollar of subsidy may not be welfare enhancing. Although given the equilibrium distortion the welfare gain will be first order, the welfare cost of raising funds to cover the subsidy is first order as well. Hence, the benefits of subsidies are again an empirical question.
Restrictions on characteristic-based pricing. A final common form of public policy intervention is regulation that imposes restrictions on the characteristics of consumers over which firms can price discriminate. Some regulations require “community rates” that are uniform across all individuals, while others prohibit insurance companies from making prices contingent on certain observable risk factors, such as race or gender. For concreteness, consider the case of a regulation that prohibits pricing on the basis of gender. Recall that Figure 2 can be interpreted as applying to a group of individuals who must be given the same price by the insurance company. When pricing based on gender is prohibited, males and females are pooled into the same market, with a variant of Figure 2 describing that market. When pricing on gender is allowed, there are now two distinct insurance markets—described by two distinct versions of Figure 2—one for women and one for men, each of which can be analyzed separately. A central issue for welfare analysis is whether, when insurance companies are allowed to price on gender, consumers still have residual private information about their expected costs. If they do not, then the insurance market within each gender-specific segment of the market will exhibit a constant (flat) ![]() curve, and the equilibrium in each market will be efficient. In this case, policies that restrict pricing on gender unambiguously reduce welfare because they create adverse selection where none existed before. However, in the more likely case that individuals have some residual private information about their risk that is not captured by their gender, each gender-specific market segment would look qualitatively the same as Figure 2 (with downward sloping
curve, and the equilibrium in each market will be efficient. In this case, policies that restrict pricing on gender unambiguously reduce welfare because they create adverse selection where none existed before. However, in the more likely case that individuals have some residual private information about their risk that is not captured by their gender, each gender-specific market segment would look qualitatively the same as Figure 2 (with downward sloping ![]() and
and ![]() curves). In such cases, the welfare implications of restricting pricing on gender could go in either direction. Depending on the shape and position of the gender-specific demand and cost curves relative to the gender-pooled ones, the sum of the areas of the deadweight loss trapezoids in the gender-specific markets could be larger or smaller than the area of the single deadweight loss trapezoid in the gender-pooled market.3 See Einav and Finkelstein (2011) for a numerical illustrative example.
curves). In such cases, the welfare implications of restricting pricing on gender could go in either direction. Depending on the shape and position of the gender-specific demand and cost curves relative to the gender-pooled ones, the sum of the areas of the deadweight loss trapezoids in the gender-specific markets could be larger or smaller than the area of the single deadweight loss trapezoid in the gender-pooled market.3 See Einav and Finkelstein (2011) for a numerical illustrative example.
Comment: Pareto improvements. It is important to note that while various policies may be able to increase efficiency or even produce the efficient outcome—such as mandates—they are not, in this environment, Pareto improving. Consider for concreteness the case of mandates. The insurance provider (be it the government or the private market) must break even in equilibrium, and therefore the cost of providing the insurance must be recouped. The total cost is equal to the market size ![]() times the average cost of insurance provision to
times the average cost of insurance provision to ![]() individuals, which is given by point G. Suppose the government uses average cost pricing, effectively issuing a lump sum tax on individuals equal to the average cost of insuring all individuals (given by the vertical distance at point G). While this policy achieves the efficient allocation, those whose willingness to pay is less than the price level at point G are made strictly worse off. Other financing mechanisms may generate welfare gains for a larger set of individuals, but assuming that the government does not observe the private information about individuals’ costs, the government—like the private sector—cannot price insurance to individuals based on their (privately known) marginal cost.
individuals, which is given by point G. Suppose the government uses average cost pricing, effectively issuing a lump sum tax on individuals equal to the average cost of insuring all individuals (given by the vertical distance at point G). While this policy achieves the efficient allocation, those whose willingness to pay is less than the price level at point G are made strictly worse off. Other financing mechanisms may generate welfare gains for a larger set of individuals, but assuming that the government does not observe the private information about individuals’ costs, the government—like the private sector—cannot price insurance to individuals based on their (privately known) marginal cost.
The inability for mandates to produce a Pareto improvement are a direct consequence of the Akerlovian modeling framework which has fixed the contract space. Some models that endogenize the contract offers generate Pareto improving mandates (e.g., Wilson, 1977) or Pareto improving tax-transfer schemes (Rothschild & Stiglitz, 1976). Crocker and Snow (1985)discuss the assumptions under which the decentralized equilibrium is constrained Pareto efficient in models with endogenous contracts.4
2.1.3 Departures from the Textbook Environment: Loads and Preference Heterogeneity
The qualitative findings of the textbook model are unambiguous: private information about risk always produces underinsurance relative to the efficient outcome, and mandating insurance always improves welfare. We now discuss two empirically relevant departures from the textbook environment that change these qualitative findings.
2.1.3.1 Production Costs (Loads)
Consider first the supply-side assumption we made above that the only costs of providing insurance to an individual are the direct insurer claims that are paid out. Many insurance markets show evidence of non-trivial loading factors, including long-term care insurance (Brown & Finkelstein, 2007), annuity markets (Friedman & Warshawsky, 1990; Mitchell, Poterba, Warshawsky, & Brown, 1999; Finkelstein & Poterba, 2002), health insurance (Newhouse, 2002), and automobile insurance (Chiappori, Jullien, Salanié, & Salanié, 2006). While these papers lack the data to distinguish between loading factors arising from administrative costs to the insurance company and those arising from market power (insurance company profits), it seems a reasonable assumption that it is not costless to “produce” insurance and run an insurance company.
We therefore relax the textbook assumption to allow for a loading factor on insurance, for example in the form of administrative costs associated with selling and servicing insurance. In the presence of such loads, it is not necessarily efficient to allocate insurance coverage to all individuals. Even if all individuals are risk averse, the additional cost of providing an individual with insurance may be greater than the risk premium for certain individuals, making it socially efficient to leave such individuals uninsured. This case is illustrated in Figure 3, which is similar to Figure 2, except that the cost curves are shifted upward reflecting the additional cost of insurance provision.
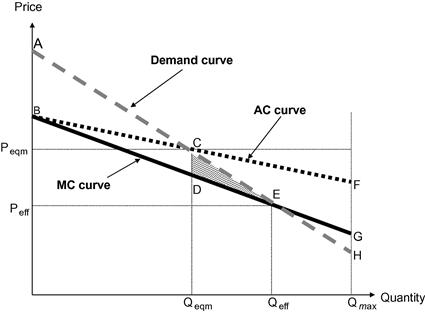
Figure 3 Adverse selection with additional costs of providing insurance. Notes: In this departure from the textbook case, we allow for the possibility of a loading factor on the insurance contract ![]() . As a result, the marginal cost curve may now intersect the demand curve internally, in which case it is not efficient to cover all individuals with
. As a result, the marginal cost curve may now intersect the demand curve internally, in which case it is not efficient to cover all individuals with ![]() . The efficient allocation is given by point E (where demand intersects the marginal cost curve) and the equilibrium allocation is given by point C (where demand intersects the average cost curve). Once again there is under insurance due to adverse selection (
. The efficient allocation is given by point E (where demand intersects the marginal cost curve) and the equilibrium allocation is given by point C (where demand intersects the average cost curve). Once again there is under insurance due to adverse selection (![]() ) and the welfare loss from this under insurance is given by the triangle CDE. (Source: Einav et al. (2010a)).
) and the welfare loss from this under insurance is given by the triangle CDE. (Source: Einav et al. (2010a)).
In Figure 3, the ![]() curve crosses the demand curve at point E, which depicts the socially efficient insurance allocation. It is efficient to insure everyone to the left of point E (since demand exceeds marginal cost), but socially inefficient to insure anyone to the right of point E (since demand is less than marginal cost).
curve crosses the demand curve at point E, which depicts the socially efficient insurance allocation. It is efficient to insure everyone to the left of point E (since demand exceeds marginal cost), but socially inefficient to insure anyone to the right of point E (since demand is less than marginal cost).
2.1.3.2 Implications for Policy Analysis
The introduction of loads does not affect the basic analysis of adverse selection but it does have important implications for standard public policy remedies. The competitive equilibrium is still determined by the zero profit condition, or the intersection of the demand curve and the ![]() curve (point C in Figure 3), and in the presence of adverse selection (downward sloping
curve (point C in Figure 3), and in the presence of adverse selection (downward sloping ![]() curve) this leads to underinsurance relative to the social optimum
curve) this leads to underinsurance relative to the social optimum ![]() , and to a familiar deadweight loss triangle CDE.
, and to a familiar deadweight loss triangle CDE.
However, with insurance loads, the qualitative result in the textbook environment of an unambiguous welfare gain from mandatory coverage no longer obtains. As Figure 3 shows, while a mandate that everyone be insured recoups the welfare loss associated with underinsurance (triangle CDE), it also leads to overinsurance by covering individuals whom it is socially inefficient to insure (that is, whose expected costs are above their willingness to pay). This latter effect leads to a welfare loss given by the area EGH in Figure 3. Therefore whether a mandate improves welfare over the competitive allocation depends on the relative sizes of triangles CDE and EGH. These areas in turn depend on the specific market’s demand and cost curves, making the welfare gain of a mandate an empirical question. It may also depend on factors outside of our model—such as the administrative costs of (publicly provided) mandatory insurance relative to private sector competition. Naturally, if government-mandated or provided insurance has lower loads—e.g., because of less spending on marketing—then the welfare gains of a mandate could be larger.
2.1.3.3 Preference Heterogeneity and Advantageous Selection
Our “textbook environment”—like the original seminal papers of Akerlof (1970) and Rothschild and Stiglitz (1976)—assumed that individuals varied only in their risk type. In practice, however, consumers of course may also vary in their preferences. Thus the vector of consumer characteristics ![]() that affects both willingness to pay
that affects both willingness to pay ![]() and expected costs
and expected costs ![]() may include consumer preferences as well as risk factors.
may include consumer preferences as well as risk factors.
Recent empirical work has documented not only the existence of substantial preference heterogeneity over various types of insurance, but the substantively important role of this preference heterogeneity in determining demand. Standard expected utility theory suggests that risk aversion will be important for insurance demand. And indeed, recent empirical evidence suggests that heterogeneity in risk aversion may be as or more important than heterogeneity in risk type in explaining patterns of insurance demand in automobile insurance (Cohen & Einav, 2007) and in long-term care insurance (Finkelstein & McGarry, 2006). In other markets, there is evidence of a role for other types of preferences. For example, in the Medigap market, heterogeneity in cognitive ability appears to be an important determinant of insurance demand (Fang, Keane, & Silverman, 2008); in choosing annuity contracts, preferences for having wealth after death play an important role (Einav, Finkelstein, & Schrimpf, 2010c); in annual health insurance markets, heterogeneity in switching costs can also play an important role in contract demand (Handel, 2011).
Such heterogeneity in preferences can have very important implications for analysis of selection markets. In particular, if preferences are sufficiently important determinants of demand for insurance and sufficiently negatively correlated with risk type, the market can exhibit what has come to be called “advantageous selection.”
2.1.3.4 Equilibrium and Public Policy with Advantageous Selection
In our graphical framework, advantageous selection can be characterized by an upward sloping marginal cost curve, as shown in Figure 4. This is in contrast to adverse selection, which is defined by a downward sloping marginal cost curve.5 When selection is advantageous, as price is lowered and more individuals opt into the market, the marginal individual opting in has higher expected cost than infra-marginal individuals. Note that preference heterogeneity is essential for generating these upward sloping cost curves. Without it, willingness to pay must be higher for higher expected cost individuals. Marginal costs must be upward sloping because the individuals with the highest willingness to pay are highest cost.6
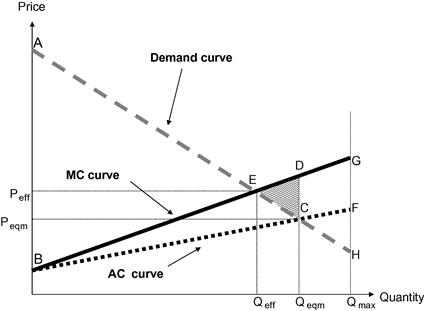
Figure 4 Advantageous selection. Notes: Advantageous selection is characterized by an upward sloping marginal cost curve. the average cost curve therefore lies below the marginal cost curve, resulting in over insurance relative to the efficient allocation ![]() . The welfare loses from over insurance is given by the shaded area CDE and represents the excess of marginal cost over willingness to pay for people whose willingness to pay exceed the average costs of those covered by
. The welfare loses from over insurance is given by the shaded area CDE and represents the excess of marginal cost over willingness to pay for people whose willingness to pay exceed the average costs of those covered by ![]() . (Source: Einav et al. (2010a)).
. (Source: Einav et al. (2010a)).
Since the ![]() curve is upward sloping, the
curve is upward sloping, the ![]() curve lies everywhere below it. If there were no insurance loads (as in the textbook situation), advantageous selection would not lead to any inefficiency; the
curve lies everywhere below it. If there were no insurance loads (as in the textbook situation), advantageous selection would not lead to any inefficiency; the ![]() and
and ![]() curves would always lie below the demand curve, and in equilibrium all individuals in the market would be covered, which would be efficient.
curves would always lie below the demand curve, and in equilibrium all individuals in the market would be covered, which would be efficient.
With insurance loads, however, advantageous selection generates the mirror image of the adverse selection case; it also leads to inefficiency, but this time due to overinsurance rather than underinsurance. This can be seen in Figure 4. The efficient allocation calls for providing insurance to all individuals whose expected cost is lower than their willingness to pay—that is, all those who are to the left of point E (where the ![]() curve intersects the demand curve) in Figure 4. Competitive equilibrium, as before, is determined by the intersection of the
curve intersects the demand curve) in Figure 4. Competitive equilibrium, as before, is determined by the intersection of the ![]() curve and the demand curve (point C in Figure 4). But since the
curve and the demand curve (point C in Figure 4). But since the ![]() curve now lies below the
curve now lies below the ![]() curve, equilibrium implies that too many individuals are provided insurance, leading to overinsurance: there are
curve, equilibrium implies that too many individuals are provided insurance, leading to overinsurance: there are ![]() individuals who are inefficiently provided insurance in equilibrium. These individuals value the insurance at less than their expected costs, but competitive forces make firms reduce the price in order to attract these individuals, simultaneously attracting more profitable infra-marginal individuals. Intuitively, insurance providers have an additional incentive to reduce price, as the infra-marginal customers whom they acquire as a result are relatively good risks. As we discuss below, such advantageous selection is quite important empirically. Cutler, Finkelstein, and McGarry (2008) summarize some of the findings regarding the presence of adverse compared to advantageous selection in different insurance markets.
individuals who are inefficiently provided insurance in equilibrium. These individuals value the insurance at less than their expected costs, but competitive forces make firms reduce the price in order to attract these individuals, simultaneously attracting more profitable infra-marginal individuals. Intuitively, insurance providers have an additional incentive to reduce price, as the infra-marginal customers whom they acquire as a result are relatively good risks. As we discuss below, such advantageous selection is quite important empirically. Cutler, Finkelstein, and McGarry (2008) summarize some of the findings regarding the presence of adverse compared to advantageous selection in different insurance markets.
We can characterize the welfare loss from overinsurance due to advantageous selection as above. The resultant welfare loss is given by the shaded area CDE, and represents the excess of ![]() over willingness to pay for individuals whose willingness to pay exceeds the average costs of the insured population. Once again, the source of market inefficiency is that consumers vary in their marginal cost, but firms are restricted to uniform pricing.
over willingness to pay for individuals whose willingness to pay exceeds the average costs of the insured population. Once again, the source of market inefficiency is that consumers vary in their marginal cost, but firms are restricted to uniform pricing.
From a public policy perspective, advantageous selection calls for the opposite solutions relative to the tools used to combat adverse selection. For example, given that advantageous selection produces “too much” insurance relative to the efficient outcome, public policies that tax existing insurance policies (and therefore raise ![]() toward
toward ![]() ) or outlaw insurance coverage (mandate no coverage) could be welfare improving. Although there are certainly taxes levied on insurance policies, to our knowledge advantageous selection has not yet been invoked as a rationale in public policy discourse, perhaps reflecting the relative newness of both the theoretical work and empirical evidence. To our knowledge, advantageous selection was first discussed by Hemenway (1990), who termed it “propitious” selection. de Meza and Webb (2001) provide a theoretical treatment of advantageous selection and its implications for insurance coverage and public policy.
) or outlaw insurance coverage (mandate no coverage) could be welfare improving. Although there are certainly taxes levied on insurance policies, to our knowledge advantageous selection has not yet been invoked as a rationale in public policy discourse, perhaps reflecting the relative newness of both the theoretical work and empirical evidence. To our knowledge, advantageous selection was first discussed by Hemenway (1990), who termed it “propitious” selection. de Meza and Webb (2001) provide a theoretical treatment of advantageous selection and its implications for insurance coverage and public policy.
Advantageous selection provides a nice example of the interplay between theory and empirical work in the selection literature. Motivated by the seminal theoretical papers on adverse selection, empirical researchers set about developing ways to test whether or not adverse selection exists. Some of this empirical work in turn turned up examples of advantageous selection, which the original theory had precluded. This in turn suggested the need for important extensions to the theory.
2.2 Empirical Evidence on Selection
Over the last decade, empirical work on selection in insurance markets has gained considerable momentum, and a fairly extensive and active empirical literature on the topic has emerged. We discuss this literature using the graphical framework described in the previous section. We begin with work designed to test whether or not selection exists in a particular insurance market. Existence of selection is a natural and necessary condition for investigation of its welfare consequences and, not surprisingly, where empirical work started first. We then discuss more recent work designed to empirically quantify the welfare consequences of adverse selection or public policy interventions.
2.2.1 Testing for Selection
As is evident from our graphical framework, adverse selection is defined by a downward sloping marginal cost curve. Testing for adverse selection essentially requires testing whether the marginal cost curve is downward sloping. But making inferences about marginal individuals is difficult. Not surprisingly, initial empirical approaches focused on cases under which one could make inferences simply by comparing average rather than marginal individuals. We begin by discussing these “positive correlation tests.” We then move onto a “cost curve test,” which has the advantage of being able to make inferences about marginal individuals, but requires more data.
2.2.1.1 Positive Correlation Test for Asymmetric Information
The graphical depiction of adverse selection in Figures 2 and 3 suggests one natural way to test for selection: compare the expected cost of those with insurance to the expected cost of those without. More generally, one can compare the costs of those with more insurance to those with less insurance. If adverse selection is present, the expected costs of those who select more insurance should be larger than the expected costs of those who select less insurance.
Figure 5 illustrates the basic intuition behind the test. Here we start with the adverse selection situation already depicted in Figure 3, denoting the ![]() curve shown in previous figures by
curve shown in previous figures by ![]() to reflect the fact that it averages over those individuals with the higher coverage contract,
to reflect the fact that it averages over those individuals with the higher coverage contract, ![]() . We have also added one more line: the
. We have also added one more line: the ![]() curve. The
curve. The ![]() curve represents the average expected cost of those individuals who have the lower coverage contract
curve represents the average expected cost of those individuals who have the lower coverage contract ![]() . That is, the
. That is, the ![]() curve is derived by averaging over the expected costs of those with
curve is derived by averaging over the expected costs of those with ![]() coverage (integrating from
coverage (integrating from ![]() to a given quantity
to a given quantity ![]() ) while the
) while the ![]() curve is produced by averaging over the expected costs of those with
curve is produced by averaging over the expected costs of those with ![]() coverage (integrating from the given quantity to
coverage (integrating from the given quantity to ![]() ).
).
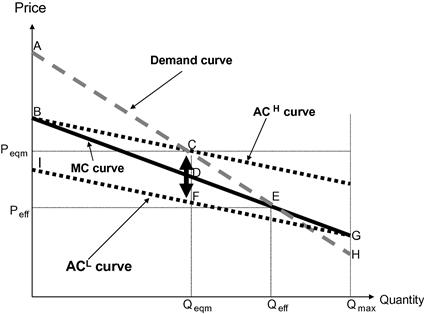
Figure 5 The “positive correlation” test for selection. Notes: ![]() denotes the
denotes the ![]() curve shown in previous figures (i.e., average costs of those with the higher coverage contract
curve shown in previous figures (i.e., average costs of those with the higher coverage contract ![]() . The
. The ![]() curve represents the average costs of those with the lower coverage contract
curve represents the average costs of those with the lower coverage contract ![]() . The difference in the average costs of those with more and less insurance in equilibrium is given by the line segment
. The difference in the average costs of those with more and less insurance in equilibrium is given by the line segment ![]() . The positive correlation test for asymmetric information tests whether average costs of those who in equilibrium have more insurance (point
. The positive correlation test for asymmetric information tests whether average costs of those who in equilibrium have more insurance (point ![]() ) are above average costs of those who in equilibrium have less insurance (point
) are above average costs of those who in equilibrium have less insurance (point ![]() ). (Source: Einav and Finkelstein (2011)).
). (Source: Einav and Finkelstein (2011)).
A downward sloping ![]() curve—i.e., the existence of adverse selection—implies that
curve—i.e., the existence of adverse selection—implies that ![]() is always above
is always above ![]() . Thus, at any given insurance price, and in particular at the equilibrium price, adverse selection implies that the average cost of individuals with more insurance is higher than the average cost of those with less insurance. The difference in these averages is given by line segment CF in Figure 5 (the thick arrowed line in the figure). This basic insight underlies the widely used “positive correlation” test for asymmetric information. The positive correlation test amounts to testing if point C (average costs of those who in equilibrium are insured) is significantly above point F (average costs of those who in equilibrium are not insured).
. Thus, at any given insurance price, and in particular at the equilibrium price, adverse selection implies that the average cost of individuals with more insurance is higher than the average cost of those with less insurance. The difference in these averages is given by line segment CF in Figure 5 (the thick arrowed line in the figure). This basic insight underlies the widely used “positive correlation” test for asymmetric information. The positive correlation test amounts to testing if point C (average costs of those who in equilibrium are insured) is significantly above point F (average costs of those who in equilibrium are not insured).
Chiappori and Salanie (2000) formalized this intuition and emphasized that the basic approach requires some refinement because it does not clearly differentiate between individual characteristics that are observable and those that are not.7 In particular, one must stratify on the consumer characteristics that determine the contract menu offered to each individual. Implementing the positive correlation test requires that we examine whether, among a set of individuals who are offered the same coverage options at identical prices, those who buy more insurance have higher expected costs than those who do not. In the absence of such conditioning, it is impossible to know whether a correlation arises due to demand (different individuals self select into different contracts) or supply (different individuals are offered the contracts at different prices by the insurance company). Only the former is evidence of selection. As a result, some of the most convincing tests are those carried out using insurance company data, where the researcher knows the full set of characteristics that the insurance company uses for pricing. Absent data on individually customized prices, which are sometimes difficult to obtain, one may instead try to flexibly control for all individual characteristics that affect pricing.
Chiappori and Salanie’s work has led to a large literature studying how average costs vary across different coverage options in several insurance markets, including health, life, automobile, and homeowners insurance. The widespread application of the test in part reflects its relatively minimal data requirements. The test requires that one observe the average expected costs of individuals (who are observationally identical to the firm) with different amounts of insurance coverage.
A central limitation in interpreting the results of the positive correlation test is that it is a joint test of the presence of either adverse selection or moral hazard. Even in the absence of selection (i.e., a flat marginal cost curve), moral hazard (loosely, an impact of the insurance contract on expected claims) can produce the same “positive correlation” property of those with more insurance having higher claims than those without. Intuitively, individuals with more generous insurance coverage may choose to utilize more services simply because their marginal out-of-pocket cost is lower. These two very different forms of asymmetric information have very different public policy implications. In particular, in contrast to the selection case where government intervention could potentially raise welfare, the social planner generally has no comparative advantage over the private sector in ameliorating moral hazard (i.e., in encouraging individuals to choose socially optimal behavior). Thus distinguishing between adverse selection and moral hazard is crucial.8
2.2.1.2 Cost Curve Test of Selection
Faced with the challenge of how to interpret the results of the correlation test, researchers have taken a variety of approaches. One is to test for selection in insurance markets where moral hazard is arguably less of a concern, such as annuity markets. More generally, researchers have used experimental or quasi-experimental variation in prices that consumers face to try to separate selection from moral hazard (see e.g., Abbring, Chiappori, & Pinquet, 2003a; Abbring, Heckman, Chiappori, & Pinquet, 2003b; Adams, Einav, & Levin, 2009; Cutler & Reber, 1998; Einav et al. (2010a); Karlan & Zinman, 2009).
The intuition for how pricing variation that is exogenous to demand (and hence by definition to costs since demand depends on expected costs) allows one to separate selection from moral hazard is easily seen in our simple graphical framework. Consider an experiment that randomly varies the relative price at which the ![]() contract is offered (relative to the
contract is offered (relative to the ![]() contract) to large pools of otherwise identical individuals. For each relative price, we observe the fraction of individuals who bought contract
contract) to large pools of otherwise identical individuals. For each relative price, we observe the fraction of individuals who bought contract ![]() and the average realized costs of the individuals who bought contract
and the average realized costs of the individuals who bought contract ![]() .9 We thus can trace out the demand curve as well as the average cost curve in Figure 3. From these two curves, the marginal cost curve is easily derived. Total costs are the product of average costs and demand (quantity), and marginal costs are the derivative of total cost with respect to quantity. The features of the marginal cost curve then provide direct evidence on selection. Specifically, rejecting the null hypothesis of a constant marginal cost curve is equivalent to rejecting the null of no selection. Moreover, the sign of the slope of the estimated marginal cost curve informs us of the nature of any selection. A downward sloping marginal cost curve (i.e., a cost curve declining in quantity and increasing in price) indicates adverse selection, while an upward sloping curve indicates advantageous selection. Einav et al. (2010a) develop and discuss in more detail this “cost curve” test of selection.
.9 We thus can trace out the demand curve as well as the average cost curve in Figure 3. From these two curves, the marginal cost curve is easily derived. Total costs are the product of average costs and demand (quantity), and marginal costs are the derivative of total cost with respect to quantity. The features of the marginal cost curve then provide direct evidence on selection. Specifically, rejecting the null hypothesis of a constant marginal cost curve is equivalent to rejecting the null of no selection. Moreover, the sign of the slope of the estimated marginal cost curve informs us of the nature of any selection. A downward sloping marginal cost curve (i.e., a cost curve declining in quantity and increasing in price) indicates adverse selection, while an upward sloping curve indicates advantageous selection. Einav et al. (2010a) develop and discuss in more detail this “cost curve” test of selection.
Crucially, this “cost curve” test of selection is unaffected by moral hazard. Conceptually, variation in prices for a fixed contract allows us to distinguish selection from moral hazard. To see this, recall that the ![]() curve is estimated using the sample of individuals who choose to buy contract
curve is estimated using the sample of individuals who choose to buy contract ![]() at a given price. As prices change, the sample changes, but everyone always has the same coverage. Because the coverage of individuals in the sample is fixed, the estimate of the slope of the cost curve is not affected by moral hazard, which only affects costs when coverage changes.10
at a given price. As prices change, the sample changes, but everyone always has the same coverage. Because the coverage of individuals in the sample is fixed, the estimate of the slope of the cost curve is not affected by moral hazard, which only affects costs when coverage changes.10
2.2.2 Evidence on Selection
There is now a large body of empirical work testing for selection in many different insurance markets. The results of this empirical literature have been mixed. In some markets, researchers have found evidence consistent with adverse selection—that is, higher average costs for individuals with greater insurance coverage—while in others they have found evidence of advantageous selection—defined by a negative relationship between insurance coverage and average costs—or have been unable to reject the null of symmetric information, meaning no difference in average costs. Cohen and Siegelman (2010) provide a comprehensive review of this work. We focus instead on characterizing the literature as it pertains to markets with significant social insurance, such as old age assistance and health insurance. Our reading of the evidence for these two markets is that there is very clear evidence of selection in these markets.
2.2.2.1 Annuities
In return for an up-front lump sum premium, annuities provide an individual with a survival-contingent income stream. They therefore offer a way for a retiree facing stochastic mortality to increase welfare by spreading an accumulated stock of resources over a retirement period of uncertain length (Davidoff, Brown, & Diamond, 2005; Yaari, 1965). Yet private annuity markets remain quite small. As a result, annuities have attracted a great deal of interest in discussions involving the design and reform of public pensions. Many of these public pension systems, including the current US Social Security System, provide benefits in the form of mandatory, publicly provided annuities. A major economic rationale for this form of benefit provision is the potential for adverse selection to undermine the functioning of private annuity markets, making it important to determine whether selection actually exists in these markets.
Several studies have implemented variants of the positive correlation test for selection in annuity markets. In the context of annuities, higher risk (i.e., higher expected claim) individuals are the ones who are longer lived than expected; adverse selection therefore is expected to generate a positive correlation between annuitization and survival. Results from a number of studies all point to evidence of a positive correlation in annuity markets on both the extensive margin—individuals who purchase annuities tend to be longer lived than those who do not—and on the intensive (i.e., contract feature) margin—individuals who purchase annuity contracts with shorter gaurantee periods tend to be longer lived than those who purchase less. These findings obtain conditional on the characteristics of individuals used to price annuities, namely age and gender. The positive correlation has been documented in several countries including the United States (Mitchell et al., 1999), the United Kingdom (Finkelstein & Poterba, 2002, 2004, 2006), and in Japan (McCarthy & Mitchell, 2003).
In the case of annuities, it may be reasonable to assume that annuitization does not induce large behavioral effects. Indeed, work in this literature tends to assume that moral hazard—an impact of income in the form of an annuity on the length of life—is likely to be quantitatively negligible even though theoretically possible (see Philipson & Becker, 1998). As a result, evidence of a positive correlation between annuitization and survival can be interpreted as clear evidence of adverse selection in this market (Finkelstein & Poterba, 2004). Finkelstein and Poterba’s (2004) empirical findings also illustrate how selection may occur not only along the dimension of the amount of payment in the event the insured risk occurs, but also in the form of selection on different insurance instruments, such as the length of a guarantee period during which payments are not survival-contingent; see Sheshinski (2008) for a theoretical discussion of this point.