
Taxation and Development
Timothy Besley* and Torsten Persson†, *LSE and CIFAR, †IIES, Stockholm University and CIFAR
Abstract
The central question in taxation and development is: “how does a government go from raising around 10% of GDP in taxes to raising around 40%?” This paper looks at the economic and political forces that shape the way that fiscal capacity is created and sustained. As well as reviewing the literature and evidence, it builds an overarching framework to help structure thinking on the topic.
Keywords
Fiscal capacity; Taxation; Development; Administration and compliance; Revenue authorities
It is shortage of resources, and not inadequate incentives, which limits the pace of economic development. Indeed the importance of public revenue from the point of view of accelerated economic development could hardly be exaggerated.
Nicholas Kaldor, “Taxation for Economic Development,” Journal of Modern African Studies, 1963, p. 7.
1 Introduction
Perhaps more than any other economist in the post-war generation, Nicholas Kaldor appreciated the centrality of public finance to development. Following his lead, we believe that the power to tax lies at the heart of state development. A moment’s reflection on the history of today’s developed countries and the current situation of today’s developing nations suggests that the acquisition of that power cannot be taken for granted. The central question in taxation and development is: “how does a government go from raising around 10% of GDP in taxes to raising around 40%?”
In the process of development, states not only increase the levels of taxation, but also undergo pronounced changes in patterns of taxation, with increasing emphasis on broader tax bases, i.e., with fewer exemptions. Some taxes—notably trade taxes—tend to diminish in importance. Thus, in the developed world taxes on income and value added do the heavy lifting in raising sufficient revenue to support the productive and redistributive functions of the state.
The power to tax is taken for granted in most of mainstream public finance. Traditional research focuses on limits imposed by incentive constraints tied to asymmetric information, or sometimes political motives, rather than the administrative capabilities of the state. Thus, public finance and taxation remains a relatively unexplored field. However, this is now changing with a better understanding of the issues at a macro level and a range of efforts to collect micro data, some of it based on policy experiments. In part, this reflects a growing insight among policymakers that a better working tax system helps the state to support economic development.
Governments in all parts of the world and at all points in history have faced similar challenges when it comes to funding their ambitions. We do not believe that governments in the past or in today’s developing world are any less rational or farsighted compared to those in today’s developed world. But they may face incentives and constraints shaped by weakly institutionalized political environments. A key challenge for the study of taxation and development is to understand how these incentives and constraints work, and how—if at all—the situation might be improved for the citizens in today’s developing nations.
Against this background, we take the view that governments in poor countries do their best in raising taxes, given the administrative structures in place and the political incentives they face. The real question then becomes why the supporting administrative structures remain so weak in many places. To answer it requires an analysis of endogenous fiscal capacity which is sometimes in the literature referred to simply as state capacity. Crudely, this concept captures how much tax a government could potentially raise given the structure of the tax system and its available powers of enforcement. But as a government need not always operate at or near the level of fiscal capacity, its capacity may not be directly observable.
We view the creation of fiscal capacity as a product of investments in state structures—including monitoring, administration and compliance through e.g., well-trained tax inspectors and an efficient revenue service. Our approach gets away from the false juxtaposition between positive and normative analyses of optimal taxes on the one hand, and studies of tax administration and political economy on the other.1
Economists who have studied taxation and development have tended to see the evolving economy as the driving force behind the government’s approach to taxation. However, we will argue that this standard economic view needs to be augmented by an understanding of how political incentives shape the evolution of the tax system. This argument is in line with Schumpeter (1918), who saw the development of the tax system as intrinsically intertwined with the nature of the state and its history. Moreover, we will draw on the modern approach to development, which puts political motives (and the role of institutions) at the heart of understanding economic change.2 Without invoking political motives as shaped by institutions, it is difficult to explain why some countries are rich and others are poor in the first place.3
The remainder of this chapter is organized as follows. In Section 2, we briefly discuss different perspectives on taxation and development, and outline our own perspective in more detail. Section 3 presents some background facts on levels and patterns of taxes in rich and poor countries and countries with strong and weak political institutions. Section 4 presents our analytical framework to study the equilibrium choices of taxation and investments in fiscal capacity. In Section 5, we use this framework to identify different determinants of taxation and fiscal capacity: economic development, political institutions, social structures, the value of public spending, non-tax revenues like aid and resource rents, and tax administration. Section 6 concludes.
2 Perspectives on Taxation and Development
There can be little doubt that the nature of the economy, and its structural characteristics, influence the ability to tax and the types of taxes that can be imposed. The standard economic approach to taxation and development focuses on how economic change influences the evolution of the tax system. In this approach, changes to the tax system reflect structural change. For example, a declining informal sector widens the tax net, the growth of larger firms creates a vehicle for compliance, and expansion of the financial sector encourages transparent accounting procedures which facilitate taxation. Such structural approaches have been emphasized in the influential commentaries of Tanzi (1987, 1992) and the review of the issues by Burgess and Stern (1993). Important recent contributions, focusing on specific economic channels, include Gordon and Li (2009), who emphasize the link between taxation and formal finance, and Kleven, Kreiner, and Saez (2009) who emphasize third-party reporting through firms.
Of course, the standard economic approach also studies the influence of the tax system on the economy. Well-designed tax systems can minimize the efficiency losses imposed by taxes and even raise the growth rate in endogenous-growth models, as in Barro and Sala-i-Martin (1992). Tax revenues can be spent on public goods and investments that make the economy more productive, as in Barro (1990). Tax design in a developing country context has to take into account the information about behavioral responses needed by governments, as in the papers collected in Gordon (2010) and Newbery and Stern (1987).
The standard economic view has also dealt with the issues of administration and compliance—see Slemrod and Yitzhaki (2002) for an overview. These issues also take center stage in the influential writings of Richard Bird (see, e.g., Bird & Oldman, 1980).4 Looking at the recent experience through the lens of effective administration, Bird (2004) observes that “the best tax policy in the world is worth little if it cannot be implemented effectively”. The greater reliance on trade taxes (and seigniorage) than income taxes in poor economies, which we discuss further below, has been noted and discussed by many authors—see Burgess and Stern (1993), Hinrichs (1966), and Tanzi (1992), for early contributions.
But important as it is, economic development does not mechanically translate into increases in the tax take. Even in fast-growing economies, such as India and China, decisions by the state are needed to yield a dividend in the form of a higher tax share in GDP. For example, Piketty and Qian (2009) argue that increases in exemptions have meant that income tax revenues in India have stagnated at around 0.5% of GDP since 1986. Widening the scope of taxation to broad bases as income and value added is only feasible if accompanied by investments in compliance structures.
In summary, the standard economic approach views low levels of revenue and disproportionate reliance on narrow tax bases as important constraints on the tax take. This standard economic view is summarized schematically in Figure 1.
Whether or not administration, and compliance is given a central role, most of the work in the standard economic approach has little room for endogenous government behavior. By contrast, historical accounts of how tax systems have evolved, such as Brewer (1989) and Dincecco (2011), put a great deal of emphasis on government behavior and motives for raising taxes.5 These accounts suggest that it is essential for the study of taxation and development to focus on conscious efforts to build fiscal capacity.
A first feature of our approach in this chapter is to augment the standard approach by giving not only economic factors but political factors as well key roles in the analysis of taxation and development.6 This is in tune with the thrust of modern research on development, which sees political motives as central to understanding how development proceeds and to explain why some countries languish while others prosper. In keeping with this approach, we highlight the structure of political institutions and the degree of political instability as key drivers of investments in fiscal capacity. Changes in the power to tax may also reflect circumstances—e.g., threats of foreign conflicts—that forge common political interests in building a strong state.
A second feature of our approach is to point to a further endogenous feedback loop from taxation to development which has not featured in most discussions to date. When the government has a larger stake in the economy through a developed tax system, it has stronger motives to play a productive role in the economy, as a complement to its extractive role. Obvious examples include building high-return infrastructure projects and developing the legal system to reduce the extent of informality in the economy. Such complementarity can create a virtuous circle between taxation and development that goes beyond the standard technocratic view of government.
Both of these features are incorporated in the analysis of this chapter, as illustrated schematically in Figure 2.

The approach that we adopt sees tax compliance as something more than a technical issue. Observed compliance also reflects the underlying incentives of policymakers to improve the tax system and ensure that taxes are paid. This contrasts with the purely economic approach in thinking about better compliance structures and broader tax bases as a result of purposive, forward-looking activity by politically motivated incumbents. In this sense, our approach is related to earlier theoretical and empirical work by Cukierman, Edwards, and Tabellini (1992) on how the use of seigniorage depends on the efficiency of the tax system, and how the strategic choice of the latter depends on factors like political stability and polarization.
A focus on political economics also rhymes well with the extensive work by political and economic historians on how a state’s fiscal capacity evolves. Scholars of history have emphasized the key role of government motives to build fiscal capacity, and especially the centrality of warfare in stimulating demands for fiscal capacity. This research has yielded many interesting case studies, such as Bonney (1999), Brewer (1989), and O’Brien (2001, 2005). But there are also attempts at broader generalizations, as in the work by Hoffman and Rosenthal (1997), Levi (1988), Schumpeter (1918), and Tilly (1985). Tilly, in particular, aims at explaining European exceptionalism, although his work appears greatly inspired by the encyclopedic scholarship of German historian Hintze (1906). Much debate still remains about whether the fiscal state necessarily follows a pattern of war, with Centeno (1997) arguing that Latin America may be an exception to the Tilly hypothesis of war as a major motive for building fiscal capacity.
The fact that many states remain unable to levy broad-based taxes is often seen as key to the persistence of weak states in many poor countries, by development scholars like Migdal (1988). Others, such as Herbst (2000), have ventured the hypothesis that some countries in Africa might have been able to strengthen their weak states if external wars had been more frequent on the continent. By picking up similar themes, our approach thus parallels the approach taken by scholars in other branches of social sciences as well as the humanities.
Political scientists and sociologists sometimes push the role of taxation in development even further, by arguing that taxation can be a catalyst for political and economic change. This view is illustrated in Figure 3, where political institutions respond to an expanding tax domain. The old American adage of “no taxation without representation” is a vivid instance of such thinking, whereby demands for transparency and representation are built as part of the need to build a strong fiscal state in a “fiscal contract” between the citizens and the state.
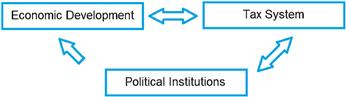
In the remainder of the chapter, we first present some useful background facts on taxation and development. We then develop our approach, beginning with an exclusive focus on economic factors, as in Figure 1. Next, we consider how political incentives affect the arguments and give a well-defined role for political institutions in determining how tax systems develop, as in Figure 2. Endogenous political institutions as in Figure 3, however, lie beyond the scope of this chapter, although we briefly return to this possibility in the concluding remarks.
3 Background Facts
The growth of the state and its capacity to extract significant revenues from citizens is a striking economic feature of the last two centuries. For example, Madisson (2001) documents that, on average, France, Germany, the Netherlands, and the UK raised around 12% of GDP in tax revenue around 1910 and around 46% by the turn of the Millennium. The corresponding US figures are 8% and 30%. Underpinning these hikes in revenue are a number of tax innovations, including the extension of the income tax to a wide population. For example, large-scale compliance with the income tax required states to build a tax administration and implement withholding at source. Such investments in fiscal capacity have enabled the kind of mass taxation now considered normal throughout the developed world.7
Figure 4 gives a partial picture of how fiscal capacity has evolved over time based on a sample of 18 countries using data from Mitchell (2007a,b,c). We will use this sample for time-series comparisons throughout this section.8 The figure plots the distribution of three kinds of changes in tax systems since 1850 which can be thought of as fiscal-capacity investments. The solid line shows the proportion of countries that have introduced an income tax, the dashed line shows the proportion that have implemented income-tax withholding, and the line with a mixture of dots and dashes shows the proportion that have adopted a VAT. Although a useful illustration for a limited sample of countries, the reader should bear in mind that looking at dates for these significant discrete changes almost certainly understates the extent of change since, over time, the reach of the income tax, withholding, and VAT have all increased. The graph shows that income taxes began appearing in the mid-nineteenth century, direct withholding follows somewhat later with both being found in the full sample by around 1950.9 VAT adoption lagged behind the income tax and with only the USA not having adopted a VAT in our sample of 18 countries by the end of the year 2000.
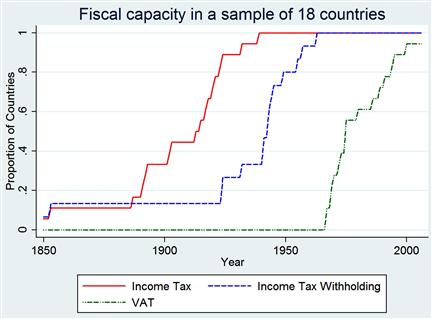
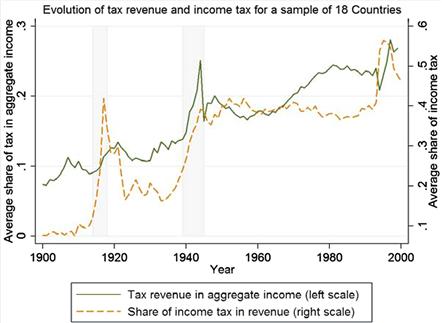
The model developed in Section 3 below will be used to explain the forces that shape such changes in the tax system. The changes illustrated in Figure 4 are all associated with investments in administrative structures that support tax collection.10 Figure 5 looks in more detail at the historical picture over time during the last 100 years for the 18 countries in our sample. The figure illustrates how the average tax take has increased over time from around 10% in national income to around 25% in the sample as a whole. Equally striking is the increasing reliance on income taxation which only made up about 5% of revenues in 1900 but about 50% by the end of the last century. These hikes in the income tax share during the two world wars, and the ratchet effect associated with them, also stand out in Figure 5.
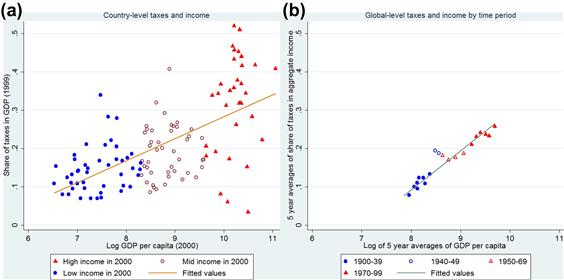
However, the narrow sample in Figures 4 and 5 ignores many of the poorer countries in the world. We would also like to use the model in this chapter to understand how fiscal capacity varies over countries. A first salient feature of the data is that richer countries tend to raise more tax revenue as a share of national income than poorer countries. This is illustrated in Figure 6. The left panel plots the overall tax take as a share of GDP from Baunsgaard and Keen (2005) against the log of GDP per capita from the Penn World Tables, both measured around the year 2000, and distinguishes observations by income. The right panel looks at the same relationship instead using the time-series data on our sample of 18 countries from Mitchell (2007a,b,c) to plot 5-year averages of the tax share over the 20th century against national income from Maddison’s data, and distinguishing observations by time period. The cross-section and time-series patterns are strikingly similar. Higher-income countries today raise much higher taxes than poorer countries, indicating that they have made larger investments in fiscal capacity. Moreover, the tax share in GDP of today’s developing countries does not look very different from the tax take 100 years ago in the now developed countries.
To probe further into tax differences across countries, it is interesting to look at the relative uses of different types of taxes, differentiated by the investments that they require to be collected. Arguably, trade taxes and income taxes are the two polar cases. To collect trade taxes just requires being able to observe trade flows at major shipping ports. Although trade taxes may encourage smuggling, this is a much easier proposition than collecting income taxes, which requires major investments in enforcement and compliance structures throughout the entire economy. We can thus obtain an interesting indication of fiscal-capacity investments by holding constant total tax revenue, and ask how large a share of it is collected from trade taxes and income taxes, respectively.
These shares are plotted against each other in Figure 7.11 Again, we report the cross-sectional pattern for the year 2000, based on contemporaneous data from Baunsgaard and Keen (2005), as well as the time-series pattern over the last 100 years based on historical data from Mitchell (2007a,b,c). The income-tax share is displayed on the vertical axis, and the trade-tax share on the horizontal axis. We observe a clear negative correlation: countries that rely more on income rely less on trade taxes. The left panel also shows a striking pattern by income: high-income countries depend more on income taxes, while middle-income and, especially, low-income countries depend more on trade taxes. The right panel of Figure 7 shows that the move from trade to income taxes is also reflected in the historical development of tax systems, as all countries have become richer. Again, the cross-sectional and time-series patterns look conspicuously alike with a similar slope of the regression lines.
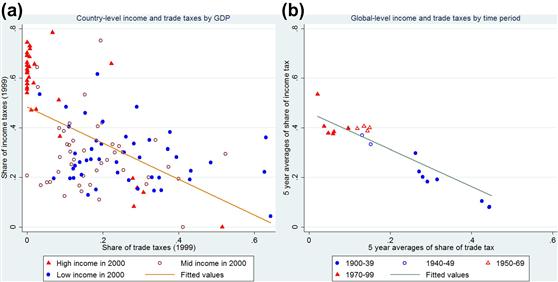
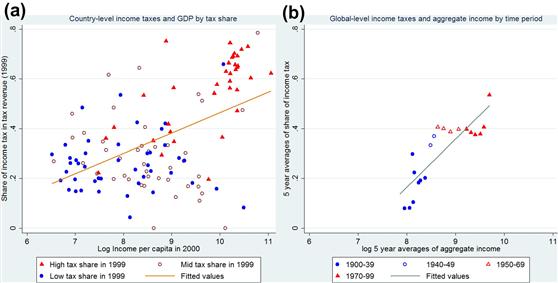
Figure 8 homes in on the income tax, plotting the relationship between the share of income taxes in total taxes and income per capita, in the current cross-section as well as the historical time series. The left panel separates the observations into three groups by tax take: countries that raise more than 25% of taxes in GDP, countries that raise 15–25% of taxes in GDP, and countries that raise less than 15%. The countries in the high-tax group again look markedly different, raising much more of their tax revenues in the form of income taxes. The right panel again differentiates observations by time period. The historical trend in this sample of older nations and the pattern in the world today is again very similar.
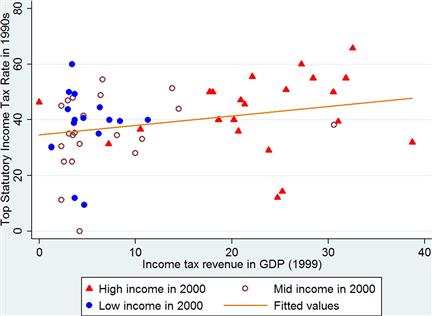
Another indicator of fiscal capacity is the relation between statutory tax rates and actual tax take. Figure 9 plots the top statutory income-tax rates in 1990s for the 67-country sample in Gordon and Lee (2005) against the share of income taxes in GDP from Baunsgaard and Keen (2005). The figure shows that the distribution of the top statutory rate is about the same among high-income and low-income countries. Obviously, the figure does not take aspects such as coverage and progressivity into account. With this qualification, the fact that high-income countries raise much more income-tax revenue than low-income countries suggests that a narrow tax base driven by compliance difficulties is a much bigger issue among low-income countries. This reinforces the earlier observation that fiscal capacity is considerably less developed in poor countries.
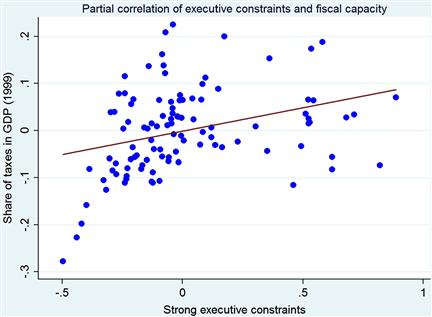
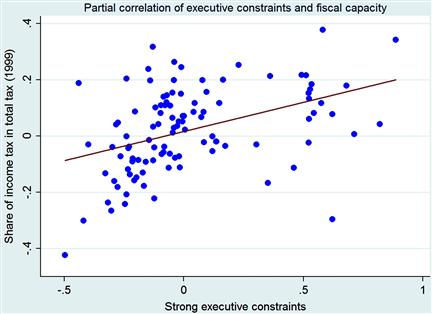
Finally, we turn to some facts relating tax structure and politics. As our core measure of political institutions, we use an indicator of executive constraints from the well-known Polity IV database (see Marshal and Jaggers, 2010). We use the highest coding of such constraints (the variable x-const is equal to 7 on a 1–7 scale) to measure the proportion of years since independence (or since 1800 if independence is earlier) that a country had strong constraints on the executive. To highlight that this political dimension captures something different than country heterogeneity in income, we control for current income before plotting the partial correlation of high executive constraints and two of our fiscal-capacity measures: total tax share in GDP (Figure 10) and the income tax share in total income (Figure 11). In both cases, we see a clear positive correlation between this measure of political institutions and fiscal capacity, taking the level of economic development into consideration—in Figure 10 the correlation hinges mainly on the countries with very low executive constraints (relative to income). The facts illustrated in these figures illustrate the need to adopt an approach where political factors help shape the level and evolution of fiscal capacity.
Taken together, the cross-sectional and time-series data suggest the following seven facts:
Fact 1: Rich countries have made successive investments in their fiscal capacities over time.
Fact 2: Rich countries collect a much larger share of their income in taxes than do poor countries.
Fact 3: Rich countries rely to a much larger extent on income taxes as opposed to trade taxes than do poor countries.
Fact 4: High-tax countries rely to a much larger extent on income taxes as opposed to trade taxes than do low-tax countries.
Fact 5: Rich countries collect much higher tax revenue than poor countries despite comparable statutory rates.
Fact 6: Countries with strong executive constraints collect higher tax revenues, when income per capita is held constant, than do countries with weak executive constraints.
Fact 7: Countries with strong executive constraints rely on a higher share of income taxes in total taxes, when income per capita is held constant, than do countries with weak executive constraints.
Together, these seven facts suggest strongly that rich, high-tax, and executive-constrained states have made considerably larger investments in fiscal capacity than have poorer, low-tax, and non-executive-constrained states.
Given these clear patterns in the data, it is indeed surprising that economists have not devoted much attention to dynamic models of economic and political determinants of fiscal capacity. As discussed in Section 2, most normative and positive theories of taxation hardly ever touch upon lacking administrative infrastructure as an important constraint on the taxes that governments can raise.
4 Framework
The framework that we develop in this section is a generalization of the models studied by Besley and Persson (2009a,b, 2011a,b,c). Our specific approach in this chapter also builds on the recent literature on how taxable income responds to taxes, allowing for a wider range of responses than the traditional view based on labor-supply elasticities—see Feldstein (1995, 1999) for the original contributions and Slemrod (2001) for a formulation close to the one we adopt.12 This makes particular sense in a developing country context, where non-compliance and decisions to earn or spend in the informal (untaxed) sector are such important issues. We build a framework to help us understand the forces behind the decisions to build a more effective tax system, where such decisions are made by a forward-looking government. In keeping with the stylized facts, we model larger fiscal capacity as increasing the yield on statutory taxes by reducing the extent of non-compliance.
The core focus is on the taxation of labor income and of goods and services which fall directly on households. This neglects the important issue of taxation of firms. Nor does the framework deal explicitly with taxation of capital income. We also limit attention to a centralized tax system, ignoring the complications created by local taxation and federal structures.
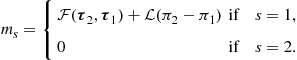
Basic Set-Up: Consider a population with ![]() distinct groups, denoted by
distinct groups, denoted by ![]() , where group
, where group ![]() is homogeneous and comprises a fraction
is homogeneous and comprises a fraction ![]() of the population. In principle, these groups could be regions, income/age groups, or ethnicities. There are two time periods:
of the population. In principle, these groups could be regions, income/age groups, or ethnicities. There are two time periods: ![]() . The economy has
. The economy has ![]() consumption goods, indexed by
consumption goods, indexed by ![]() . Consumption of these goods by group
. Consumption of these goods by group ![]() in period
in period ![]() is denoted by
is denoted by ![]() . There is also a traditional (non-rival and non-excludable) public good
. There is also a traditional (non-rival and non-excludable) public good ![]() . Individuals in group
. Individuals in group ![]() supply labor,
supply labor, ![]() , and choose how to allocate their income across consumption goods. This is a small open economy with given pre-tax prices of
, and choose how to allocate their income across consumption goods. This is a small open economy with given pre-tax prices of ![]() . Wage rates
. Wage rates ![]() are potentially group-specific and may vary over time.
are potentially group-specific and may vary over time.
Taxation and tax compliance: The government may levy taxes on labor income and all goods except the untaxed numeraire, good ![]() . The post-tax price of each good is:
. The post-tax price of each good is:
![]()
while the net wage is:
![]()
where ![]() is the vector of tax rates.
is the vector of tax rates.
As in the standard model, statutory tax policy is a vector of tax rates for commodities and labor supply. However, to allow for non-compliance, we suppose that tax payments can be reduced by actions by those who are obliged to remit taxes to authorities. If the costs of non-compliance were large enough, then this would not happen and we would be back in the standard model. But we suppose this may not be the case and allow the cost of non-compliance to depend on investments in fiscal capacity.
To capture these ideas simply, we assume that tax payments to the government from group ![]() in period
in period ![]() , associated with the commodity tax imposed on good
, associated with the commodity tax imposed on good ![]() , are:
, are:
![]()
which we assume to be non-negative. Thus, ![]() (denominated in the units of the numeraire good) is the amount of the statutory tax which is not paid—think about
(denominated in the units of the numeraire good) is the amount of the statutory tax which is not paid—think about ![]() as purchases from the informal sector. The cost function for such non-compliance is the same for all groups
as purchases from the informal sector. The cost function for such non-compliance is the same for all groups ![]() , namely
, namely ![]() with
with ![]() increasing and convex in
increasing and convex in ![]() .The parallel expression for labor taxes is
.The parallel expression for labor taxes is
![]()
with cost ![]() . Analogously, one can interpret
. Analogously, one can interpret ![]() as the amount of work undertaken in the informal sector.
as the amount of work undertaken in the informal sector.
The vector ![]() represents investments in fiscal capacity which affect non-compliance costs. For each tax base,
represents investments in fiscal capacity which affect non-compliance costs. For each tax base, ![]() , we assume:
, we assume:
![]()
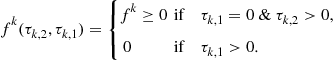
such that greater fiscal capacity makes avoiding taxes more difficult.13 Moreover, we postulate that ![]() , i.e., for a tax base where the government has made no investments in fiscal capacity, the cost of evading taxes is negligible. If citizens evade taxes fully when it is costless to do so, no tax revenue is raised from that base.
, i.e., for a tax base where the government has made no investments in fiscal capacity, the cost of evading taxes is negligible. If citizens evade taxes fully when it is costless to do so, no tax revenue is raised from that base.
For simplicity, we have assumed that fiscal capacity has a common effect on all individuals’ abilities to avoid paying statutory taxes. As a consequence, every consumer in the model adjusts their non-compliance on the intensive margin. An alternative way of modeling non-compliance would be to introduce heterogeneity in the cost or in the stigma of being caught not complying. This alternative formulation would introduce an extensive margin in tax evasion—i.e., whether to use the informal sector or not—but would lead to generally similar results. Of course, the most general approach would consider both margins and allow for heterogeneous effects according to economic circumstance, e.g., greater difficulties in measuring the value of labor earnings by owner-cultivators, the values of own production, or the value of bartered exchange in some sectors of the economy.14
Costs of fiscal-capacity investments: There is a given period-1 level of fiscal capacity relevant to sector ![]() denoted by
denoted by ![]() and a level for period 2 denoted by
and a level for period 2 denoted by ![]() which is endogenously determined by costly investments. The investment costs across the
which is endogenously determined by costly investments. The investment costs across the ![]() tax bases
tax bases ![]() are:
are:
![]()
We assume that the first part of the investment-cost function ![]() is convex with
is convex with ![]() , i.e., the marginal cost at zero is negligible. There may or may not be a fixed-cost component, depending on whether the period-1 government inherits a fiscal capacity of zero for tax base
, i.e., the marginal cost at zero is negligible. There may or may not be a fixed-cost component, depending on whether the period-1 government inherits a fiscal capacity of zero for tax base ![]()
Let
be the total costs of investing in fiscal capacity. The separability of the cost function across tax bases is made for analytical convenience. Another feature of the technology is that it does not depend on the wage rate, even though it could be that investing in fiscal capacity costs more in a more productive economy.
In practical terms, the costs of fiscal-capacity investment are more obvious for some tax bases than others. For example, levying an effective income tax requires a collection system with trained inspectors, some kind of record keeping, and the ability to cross check. We would thus expect a relatively large fixed-cost component, i.e., ![]() for
for ![]() . Equally, a VAT system requires an ability to monitor and verify the use of inputs and the value of sales for all goods simultaneously (but the VAT does not directly fit the framework above). Levying border taxes usually takes place by monitoring ports and airports to measure trade flows. For such taxes, we would expect the fixed-cost component to be small or absent. Moreover, inspecting trade flows is easier for volumes than values, which might explain why so many border taxes are specific rather than ad valorem.
. Equally, a VAT system requires an ability to monitor and verify the use of inputs and the value of sales for all goods simultaneously (but the VAT does not directly fit the framework above). Levying border taxes usually takes place by monitoring ports and airports to measure trade flows. For such taxes, we would expect the fixed-cost component to be small or absent. Moreover, inspecting trade flows is easier for volumes than values, which might explain why so many border taxes are specific rather than ad valorem.
However, in all these cases, public resources need to be devoted to monitoring and compliance. Below, we will discuss in greater detail different options for introducing new technologies to improve compliance.
Household decisions: Preferences are quasi-linear and given by:
![]()
where ![]() is a concave utility function and
is a concave utility function and ![]() is the convex disutility of labor. The utility of public goods is partly described by concave function
is the convex disutility of labor. The utility of public goods is partly described by concave function ![]() . We use
. We use ![]() to parametrize the value of public goods, which we allow to be group and time specific. The individual budget constraint is:
to parametrize the value of public goods, which we allow to be group and time specific. The individual budget constraint is:

In this expression, ![]() is a group-specific cash transfer.15 The only non-standard feature is the last term, namely the total “profit” from reducing tax payments. What makes this formulation of the household problem simple is the fact that tax incidence and behavior are still governed by the statutory tax rates as long as
is a group-specific cash transfer.15 The only non-standard feature is the last term, namely the total “profit” from reducing tax payments. What makes this formulation of the household problem simple is the fact that tax incidence and behavior are still governed by the statutory tax rates as long as ![]() .
.
Maximizing the consumers’ utility yields a vector of commodity demands and labor supply which is quite conventional. Commodity demands are the same for all groups ![]() . This is because preferences for private goods are the same and there are no income effects on taxed commodities.
. This is because preferences for private goods are the same and there are no income effects on taxed commodities.
For the tax bases where the government has some fiscal capacity, ![]() , the decisions to reduce the tax burden, which we assume have an interior solution,16 are also equal across groups, and implicitly defined by
, the decisions to reduce the tax burden, which we assume have an interior solution,16 are also equal across groups, and implicitly defined by
![]() (1)
(1)
It is straightforward to see that the convexity of the cost function makes equilibrium evasion ![]() decreasing in the fiscal capacity investment, tax base by tax base. The household profits from such activities are:
decreasing in the fiscal capacity investment, tax base by tax base. The household profits from such activities are:
![]()
which are increasing in ![]() and decreasing in
and decreasing in ![]() .17
.17
When there is no fiscal capacity, ![]() , any positive tax rate
, any positive tax rate ![]() would give us a corner solution with
would give us a corner solution with ![]() or
or ![]() . This is a case where all consumption could be sheltered from taxation in the informal sector where the individual has no tax liability. Thus, no tax income is raised at whatever level the statutory rate is set. We assume that in such cases the government sets the statutory tax rate at zero.
. This is a case where all consumption could be sheltered from taxation in the informal sector where the individual has no tax liability. Thus, no tax income is raised at whatever level the statutory rate is set. We assume that in such cases the government sets the statutory tax rate at zero.
Indirect utility: Let
be the aggregate (equilibrium) per-capita profit from efforts devoted to tax-reducing activities where ![]() is the vector of tax rates.
is the vector of tax rates.
The indirect utility function for group ![]() becomes:
becomes:
 (2)
(2)
The first term on the right-hand side is the private surplus from the consumption of goods ![]() . The separable, quasi-linear preferences make the private surplus additively separable in goods and labor—hence the second term. A convenient, but special, feature of the setup is that the gains from tax reduction are not group specific—hence the third term is not indexed by group. These features help make the analysis much simpler but do not compromise the economic insights. They could all be relaxed, albeit with increased complexity.
. The separable, quasi-linear preferences make the private surplus additively separable in goods and labor—hence the second term. A convenient, but special, feature of the setup is that the gains from tax reduction are not group specific—hence the third term is not indexed by group. These features help make the analysis much simpler but do not compromise the economic insights. They could all be relaxed, albeit with increased complexity.
The policy problem: Governments choose tax rates on all goods and labor and a spending policy, dividing the tax proceeds between public goods, transfers, and investments in fiscal capacity.
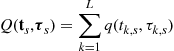
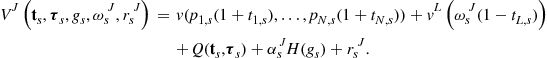
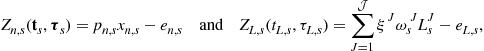
Let
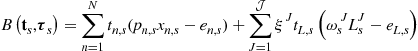
be the tax revenue from goods and labor, where the expression in the first sum relies on the fact that all groups choose the same consumption vector for non-numeraire goods. This is not true for labor supply, however, if different groups have different wage rates. The government budget constraint becomes
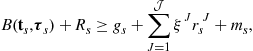 (3)
(3)
where
is the amount invested in fiscal capacity (relevant only in period 1) and ![]() is any (net) revenue from borrowing, aid, or natural resources.
is any (net) revenue from borrowing, aid, or natural resources.
We now go on to consider, first, how a government will set taxes and spending and, then, how it will choose to invest in fiscal capacity. Thus, we begin by studying the static (within-period) problem taking fiscal capacity as given.
The social objective of the government has fixed weights ![]() , one for each group, which are normalized so that
, one for each group, which are normalized so that ![]() . Then the government maximizes:
. Then the government maximizes:
subject to (3). This is a more or less standard optimal-tax cum public-goods problem, along the lines first studied in Diamond and Mirrlees (1971). It is special only in that we have assumed quasi-linear utility and added the possibility of tax evasion.
Optimal taxation: Taxes will follow a standard Ramsey-tax rule, except for the fact that taxes affect non-compliance decisions, as well as consumption and labor supply decisions. To state the tax rules, define the effective tax bases:
 (4)
(4)
where ![]() and
and ![]() are per-capita commodity demands and (group-specific) labor supplies. The additive separability of the utility function makes the effective income tax base a function of the income tax alone. With this notation, the Ramsey-tax rule for commodities is
are per-capita commodity demands and (group-specific) labor supplies. The additive separability of the utility function makes the effective income tax base a function of the income tax alone. With this notation, the Ramsey-tax rule for commodities is
where ![]() is the value of public funds. Given the possibility of reducing the tax burden, it is the demands net of avoidance
is the value of public funds. Given the possibility of reducing the tax burden, it is the demands net of avoidance ![]() and the behavioral response of these taxable net demands that shape the tax rates.
and the behavioral response of these taxable net demands that shape the tax rates.
For those goods where there is no fiscal capacity, the government (by assumption) sets taxes at zero. Moreover, we focus on the natural case where ![]() whenever
whenever ![]() . This says that, if the government has any fiscal capacity in some tax base, there is a non-trivial level of non-compliance. In this case, we also expect that the optimal-tax rate will be positive for any tax base where
. This says that, if the government has any fiscal capacity in some tax base, there is a non-trivial level of non-compliance. In this case, we also expect that the optimal-tax rate will be positive for any tax base where ![]() .
.
The optimal income tax solves:
where ![]() is weighted net taxable labor income allowing for heterogeneous wages. The optimal-tax expression is similar to the optimal commodity tax in that it involves the total behavioral response of the tax base
is weighted net taxable labor income allowing for heterogeneous wages. The optimal-tax expression is similar to the optimal commodity tax in that it involves the total behavioral response of the tax base ![]() . However, the income transferred from citizens to government (the first term) is weighted by the social objective. In general, this term depends on the correlation between the group weights
. However, the income transferred from citizens to government (the first term) is weighted by the social objective. In general, this term depends on the correlation between the group weights ![]() and wages
and wages ![]() across groups.
across groups.
To illustrate how the lack of fiscal capacity to enforce income taxes affects choices, let us assume that wages are the same for all groups, ![]() . In this case, the optimal income tax rate solves:
. In this case, the optimal income tax rate solves:
![]() (5)
(5)
where
![]()
is the elasticity of labor supply with respect to the (net of tax) after-tax wage,
![]()
is the elasticity of evasion with respect to the income tax rate and
![]()
reflects the extent of non-compliance. The standard optimal income tax formula has ![]() so only the labor-supply elasticity
so only the labor-supply elasticity ![]() and the value of public funds
and the value of public funds ![]() , to be spent on public goods or transfers, determine the optimal tax. In that case,
, to be spent on public goods or transfers, determine the optimal tax. In that case, ![]() above 1 is sufficient for the optimal-tax rate to be positive.
above 1 is sufficient for the optimal-tax rate to be positive.
With non-compliance, however, the optimal-tax rate is lower all else equal. To see this, observe that, using Eq. (5),
![]()
So any factor which makes it easier to avoid paying taxes or increases the extent of avoidance depresses the incentive to use the income tax. Thus, we would expect lower rates of taxation, as well as lower collection of taxes for a given rate, in jurisdictions, and times with little investment in fiscal capacity for tax collection (insofar as fiscal capacity decreases ![]() and
and ![]() ).
).
The optimal-tax formulas above reflect that, when citizens can reduce their tax liability, taxes raise less revenue than otherwise. The total behavioral response to taxation can, in principle, be larger or smaller than in the absence of tax avoidance, depending on the sensitivity of such activity to a higher tax rate. And these responses will be influenced by investments in fiscal capacity.
There is a direct link here to the literature on taxable income elasticities and which elasticity is the right sufficient statistic for welfare-relevant behavioral responses—see Chetty (2009). Define
![]()
as the taxable income elasticity with respect to the after-tax rate. Then, (5) can be written as
![]()
Thus, the taxable income tax elasticity is the right sufficient statistic for all behavioral responses for the model that we are using.18 These considerations should be applied to all tax bases, not just to labor income. In many countries’ compliance with the VAT is a big issue and the taxable demand elasticity would be relevant to understanding tax policy.
As things stand, the collection of evidence regarding the total response of tax revenues to tax rates, and the sources of these effects, is only in its infancy for developing countries. This is true even for income taxes, the area where most progress has been made in the developed country literature. An important exception are the findings of Kleven and Mazhar (in press), who estimate taxable income elasticities for Pakistan using detailed administrative data, and find these elasticities to be quite small, at least among those who are already registered to pay income taxes. To collect more micro-data, and use administrative records where they exist, to improve knowledge of behavioral responses to income taxation in developing countries, and to understand how the responses relate to alternative compliance structures, is a very important topic for future research.
The analysis in this section suggests that to understand the fiscal facts about developing countries laid out in Section 3, we may be able to appeal to the fiscal-capacity investments that shape total behavioral responses to taxation through standard consumption and labor-supply distortions but also through compliance decisions. The observed structure of taxes reflects that low or non-existing fiscal capacity makes it difficult to collect statutory taxes for some tax bases. This is particularly true when we compare income taxes to trade taxes, with the latter being less demanding in terms of fiscal-capacity investments. A low tax take may thus not reflect large distortions in consumption and labor supply, for any given tax system, but large opportunities for non-compliance. Hence, our emphasis on fiscal-capacity investments is given below.
Optimal public spending: Before turning to fiscal capacity, we briefly deal with public spending. In this dimension, the government decides how much revenue to allocate to transfers and public goods, respectively. With quasi-linear utility, an unconstrained government will direct all transfer spending, if any, to the group with the highest “welfare weight”, ![]() . This is, of course, a stark and unrealistic prediction (but in Section 5.2 we introduce political constraints that potentially bring about more equal sharing). In the special Utilitarian case, where
. This is, of course, a stark and unrealistic prediction (but in Section 5.2 we introduce political constraints that potentially bring about more equal sharing). In the special Utilitarian case, where ![]() for all
for all ![]() , we can assume without loss of generality that any transfer spending is spent equally. Let
, we can assume without loss of generality that any transfer spending is spent equally. Let ![]() .
.
To define the optimal level of public spending, let ![]() be total tax revenue when taxes are set optimally and the marginal value of public funds is
be total tax revenue when taxes are set optimally and the marginal value of public funds is ![]() . There are two cases. If
. There are two cases. If
then all spending will be allocated to public goods, i.e.,
This is a case where public goods are very valuable and/or tax revenue is scarce.
In the other case, the marginal value of public funds is ![]() , tax revenues are
, tax revenues are ![]() , public goods have an interior solution, and the remaining revenue is spent on transfers to the group defining
, public goods have an interior solution, and the remaining revenue is spent on transfers to the group defining ![]() .
.
Investments in fiscal capacity: The main novelty in our approach to taxation and development is to study purposeful and forward-looking decisions by government to invest in alternative forms of fiscal capacity, i.e., in vector ![]() . We now study this investment decision when
. We now study this investment decision when ![]() is endogenous and chosen by the government in period 1. The next section will then use the results to evaluate which forces drive the creation of fiscal capacity and how these relate to economic, political, and social development.
is endogenous and chosen by the government in period 1. The next section will then use the results to evaluate which forces drive the creation of fiscal capacity and how these relate to economic, political, and social development.
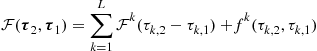
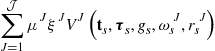
Let
 (6)
(6)
be the maximized value of the government’s payoff. Implicit in this payoff are the optimal tax and spending vectors for each level of the fiscal-capacity constraints.
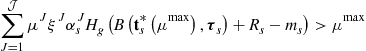
The fiscal-capacity investment decision amounts to choosing ![]() to maximize:
to maximize:
![]() (7)
(7)
This yields a series of conditions for creating fiscal capacity, or investing in it once it has been created.
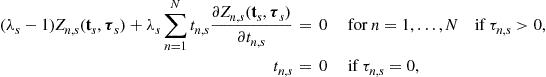
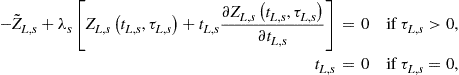
For fiscal capacity already in existence, i.e., ![]() , we have standard first-order conditions in a convenient and readily interpretable form. Using the envelope theorem to eliminate terms in optimal government (and private) choices, these first-order conditions can be written as:
, we have standard first-order conditions in a convenient and readily interpretable form. Using the envelope theorem to eliminate terms in optimal government (and private) choices, these first-order conditions can be written as:
 (8)
(8)
Three terms govern the investment decisions. The first is the added revenue from better fiscal capacity, weighted by the period-2 marginal value of public funds. The second term in (8) is the marginal cost imposed on citizens by higher fiscal capacity—essentially due to higher tax payments, as the profits from non-compliance fall when fiscal capacity is higher. The third term is the marginal cost of investing, weighted by the period-1 marginal value of public funds.
The three terms in Eq. (8) nicely encapsulate the forces that shape fiscal-capacity decisions. First, some factors make future revenue more valuable (cost of public funds ![]() and the revenue function
and the revenue function ![]() )—these will have a disproportionate effect on investment in tax bases, which are not very elastic. Second, some circumstances shape the utility cost of taxation, which depend on the lengths governments have to go to increase compliance (the profit function
)—these will have a disproportionate effect on investment in tax bases, which are not very elastic. Second, some circumstances shape the utility cost of taxation, which depend on the lengths governments have to go to increase compliance (the profit function ![]() ). Third, some features of the economy make it more or less expensive to invest—including a high current marginal cost (the cost function
). Third, some features of the economy make it more or less expensive to invest—including a high current marginal cost (the cost function ![]() and value of public funds
and value of public funds ![]() ). The investment cost could be quite specific to some kinds of tax bases.
). The investment cost could be quite specific to some kinds of tax bases.
For the case where the government is thinking about introducing a new tax base, the reasoning is inherently non-marginal. Discrete gains or losses have to be weighed against the fixed cost of the investment. So consider a decision by a government to add a tax base ![]() where initially
where initially ![]() . This will give a discrete (non-marginal) change in indirect utility, which comes from changes in the use of existing tax bases as well as increased spending on public goods. It will also imply discrete changes in the profits from non-compliance with new tax base as the optimal taxes change. Together, these yield a discrete change in
. This will give a discrete (non-marginal) change in indirect utility, which comes from changes in the use of existing tax bases as well as increased spending on public goods. It will also imply discrete changes in the profits from non-compliance with new tax base as the optimal taxes change. Together, these yield a discrete change in ![]() —evaluated at the level
—evaluated at the level ![]() which solves (8)—that must be weighed against the cost of the investment
which solves (8)—that must be weighed against the cost of the investment ![]() . In general, this kind of non-marginal analysis is quite complicated. That said, the main economic forces identified in our discussion of (8) remain the salient forces to shape the decision to invest in new tax bases. In Section 5, we illustrate this for the specific case of introducing an income tax.
. In general, this kind of non-marginal analysis is quite complicated. That said, the main economic forces identified in our discussion of (8) remain the salient forces to shape the decision to invest in new tax bases. In Section 5, we illustrate this for the specific case of introducing an income tax.
Next steps: Having built an approach for studying investments in fiscal capacity, we will exploit it to gain insights into differences between different societies at a point in time and the same society at different points in time.
More specifically, Section 5 brings up six sets of factors pinpointed by our modeling approach. First, we study the effect of purely economic factors on the incentive to build a tax system. Second, we turn to the role of politics, asking how political instability and the structure of political institutions affect the choice of fiscal capacity. Third, we look at social structure, including inequality, heterogeneity, and polarization. Fourth, we study the demand side for revenue and the factors that determine the value of public spending. Fifth, observing that many poor states rely heavily on aid or natural resource rents, we explore how these non-tax income flows affect the incentives to build other kinds of fiscal capacity. Finally, we go into more detail on the technology for increasing tax compliance.
In all cases, we use the model developed in this section as a starting point. However, in each case it will prove convenient to specialize some features to home in on a particular issue.
5 Drivers of Change
5.1 Economic Development
In this subsection, we discuss how economic change affects choices of fiscal capacity and the implications for observed taxation. Against the background of the stark time-series and cross-sectional facts in Section 3, we focus on the role of economic development for the introduction and expansion of the income tax. As discussed at the outset, this has also been the standard focus in the taxation and development literature. We begin by discussing exogenous differences in the economy across countries or time, turning then to changes that are endogenous to the government’s investment in fiscal capacity.
Exogenous economic differences: We noted in Section 3 (recall Figure 4) the typical path of change involves the two discrete steps of introducing the income tax and upgrading its reach via direct withholding. In a contemporary cross-section, we also saw (recall Figures 7 and 8) that rich and high-taxing states rely much more on the income tax than poor and low-taxing states. Through which channels does our framework explain such patterns in the data?
To answer this question, we specialize the model to include only one consumption good, in addition to the numeraire good and labor—i.e., we set ![]() . Moreover, there is no fixed cost in building fiscal capacity for the taxable consumption good, whereas a fixed cost may exist for the income tax—i.e., we have
. Moreover, there is no fixed cost in building fiscal capacity for the taxable consumption good, whereas a fixed cost may exist for the income tax—i.e., we have ![]() and
and ![]() . Of course, this stark difference is for illustrative purposes only. To keep things simple and pin down the value of public funds, we specialize the utility function to be linear in public goods, i.e.,
. Of course, this stark difference is for illustrative purposes only. To keep things simple and pin down the value of public funds, we specialize the utility function to be linear in public goods, i.e., ![]() , and the value of public goods to be equal across groups exceeding the value of transfers, i.e.,
, and the value of public goods to be equal across groups exceeding the value of transfers, i.e., ![]() . These assumptions are relaxed in later subsections on politics and the value of public spending. For now, they allow us to focus on a government that spends only on public goods with a constant marginal value of funds.
. These assumptions are relaxed in later subsections on politics and the value of public spending. For now, they allow us to focus on a government that spends only on public goods with a constant marginal value of funds.
We start by assuming that wages are given by the simple expression
![]()
i.e., every group ![]() has the same wage. Different values of
has the same wage. Different values of ![]() could represent natural exogenous income differences across countries, or across time, due to, say, geography or total factor productivity.
could represent natural exogenous income differences across countries, or across time, due to, say, geography or total factor productivity.
In this specialized framework, the marginal first-order conditions(8) associated with the two tax bases are
![]() (9)
(9)
![]()
If there were no fixed costs, this expression would tell us that the government invests more in the tax base that raises more revenue on the margin at the future value of public funds (the first term), induces a lower utility cost for consumers via the cost of tax evasion (the second term), or has a lower marginal cost of investing at the current value of public funds (the third term). Provided the positive first term outweighs the negative second term, for ![]() , we observe positive investments in both types of fiscal capacity since
, we observe positive investments in both types of fiscal capacity since ![]() .
.
We now revisit the question of when an income tax is worth levying at all and why economic growth might typically induce the introduction of an income tax, as we have seen historically. Suppose fiscal-capacity building for the income tax has a fixed cost and the period-1 level of this capacity is zero, ![]() . Recall that the government raises no revenue at zero fiscal capacity. In order for the income tax to be introduced, the perceived welfare gains from doing so, by bringing fiscal capacity up to locally optimal level
. Recall that the government raises no revenue at zero fiscal capacity. In order for the income tax to be introduced, the perceived welfare gains from doing so, by bringing fiscal capacity up to locally optimal level ![]() given by (9), have to be large enough to outweigh the effective fixed cost
given by (9), have to be large enough to outweigh the effective fixed cost ![]() associated with setting up a compliance and monitoring system. Using the definitions and additive separability of the government payoff (6), the net tax bases (4), and the indirect utility function (2), and recalling that when
associated with setting up a compliance and monitoring system. Using the definitions and additive separability of the government payoff (6), the net tax bases (4), and the indirect utility function (2), and recalling that when ![]() we have
we have ![]() (private evasion cost and taxes are zero), we can write the formal condition as follows:
(private evasion cost and taxes are zero), we can write the formal condition as follows:
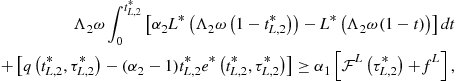 (10)
(10)
where ![]() solves (9).
solves (9).
There are three main considerations. The term on the first line reflects the value of transferring funds from private incomes to public spending, recognizing that lower labor supply induces a deadweight loss. This expression is positive only if ![]() is sufficiently high (above one).19 Also, the first-line term is proportional to exogenous productivity
is sufficiently high (above one).19 Also, the first-line term is proportional to exogenous productivity ![]() , as this determines how lucrative the income tax base is. The second term on the left-hand side reflects the possibility of non-compliance. It has two parts, the first reflecting the gain from a new source of profits from tax avoidance. However, this is offset by the fact that greater avoidance reduces valuable public spending. If there was full compliance at
, as this determines how lucrative the income tax base is. The second term on the left-hand side reflects the possibility of non-compliance. It has two parts, the first reflecting the gain from a new source of profits from tax avoidance. However, this is offset by the fact that greater avoidance reduces valuable public spending. If there was full compliance at ![]() , then this expression would be zero. Finally, the term on the right-hand side reflects the costs of introducing a new tax base—fixed costs and the cost of the investment in fiscal capacity up to
, then this expression would be zero. Finally, the term on the right-hand side reflects the costs of introducing a new tax base—fixed costs and the cost of the investment in fiscal capacity up to ![]() .
.
Notice that the tax base in the first term of (10) is increasing in the productivity factor ![]() . Moreover, the optimal income tax rate
. Moreover, the optimal income tax rate ![]() associated with a given level of fiscal capacity will generally be higher if income is higher. To see this, recall the Ramsey-tax formula (5), where
associated with a given level of fiscal capacity will generally be higher if income is higher. To see this, recall the Ramsey-tax formula (5), where ![]() is decreasing in
is decreasing in ![]() , and hence increasing in
, and hence increasing in ![]() (since
(since ![]() is decreasing in
is decreasing in ![]() ).
).
If ![]() captures income growth over time, this can naturally explain the eventual introduction of an income tax, as in Figure 4, by reference to (10). If
captures income growth over time, this can naturally explain the eventual introduction of an income tax, as in Figure 4, by reference to (10). If ![]() instead captures differences across countries, at a given point in time, this can explain the higher reliance of the income tax in rich and high-tax countries, as in Figures 7 and 8. To explicitly link up with the data on income taxes vs. trade taxes discussed in Section 3, the argument would have to be recast in a setting where trade rather than consumption is the alternative tax base (see Besley & Persson, 2011c, chap. 2 for such a model).
instead captures differences across countries, at a given point in time, this can explain the higher reliance of the income tax in rich and high-tax countries, as in Figures 7 and 8. To explicitly link up with the data on income taxes vs. trade taxes discussed in Section 3, the argument would have to be recast in a setting where trade rather than consumption is the alternative tax base (see Besley & Persson, 2011c, chap. 2 for such a model).
Endogenous economic differences: In this section, we make the level of fiscal capacity endogenous to other government decisions. The general modeling follows the analysis in Besley and Persson (2011c).
Let wages be given by ![]() , where scalar
, where scalar ![]() represents endogenous government investment to increase productivity and where
represents endogenous government investment to increase productivity and where ![]() is an increasing concave function. As Besley and Persson (2011c, chap. 3) show, one can microfound such a formulation if
is an increasing concave function. As Besley and Persson (2011c, chap. 3) show, one can microfound such a formulation if ![]() represents the capacity to carry out legal support to the private sector concerning contract enforcement or, alternatively, protection of property rights. In this interpretation, which we will maintain in this subsection,
represents the capacity to carry out legal support to the private sector concerning contract enforcement or, alternatively, protection of property rights. In this interpretation, which we will maintain in this subsection, ![]() captures the legal capacity of the government: its courts, its supply of educated judges, or its registers for credit or property. An alternative interpretation would be to think of
captures the legal capacity of the government: its courts, its supply of educated judges, or its registers for credit or property. An alternative interpretation would be to think of ![]() as government infrastructure that raises the productivity in the private sector. We could also let
as government infrastructure that raises the productivity in the private sector. We could also let ![]() be a vector of productive capacities, rather than a scalar.
be a vector of productive capacities, rather than a scalar.
Analogous to fiscal capacity, we assume that legal capacity in period 2 can be augmented by investment in period 1 at cost ![]() . We assume that legal-capacity investments have no fixed costs, for simplicity, and that
. We assume that legal-capacity investments have no fixed costs, for simplicity, and that ![]() is a convex function with
is a convex function with ![]() . As a consequence, the total investment costs for the period-1 government are now given by
. As a consequence, the total investment costs for the period-1 government are now given by
What happens to the investment in fiscal capacity in the specialized model that we just studied, when we replace exogenous wages ![]() with endogenous wages
with endogenous wages ![]() The marginal investment conditions in (9) are not affected, because neither
The marginal investment conditions in (9) are not affected, because neither ![]() nor
nor ![]() depend on legal-capacity investments
depend on legal-capacity investments ![]() . However, the condition for incurring the fixed costs of the income tax now becomes:
. However, the condition for incurring the fixed costs of the income tax now becomes:
 (11)
(11)
Only the first term from (10) is affected with higher legal capacity increasing wages. There are good reasons to expect that this key expression is increasing in ![]() and
and ![]() . For example, in the case of a constant elasticity of labor supply,
. For example, in the case of a constant elasticity of labor supply, ![]() , the first expression in (11) becomes:
, the first expression in (11) becomes:
![]()
which is clearly increasing in ![]() . Thus, a country with higher legal capacity and endogenously higher income is more likely to have an income tax than one with low legal capacity.
. Thus, a country with higher legal capacity and endogenously higher income is more likely to have an income tax than one with low legal capacity.
Of course, this raises the question what drives investments in legal capacity. Maximizing the investment objective (7) with regard to ![]() , under the assumptions of the specialized model and using Roy’s identity, we obtain the first-order condition
, under the assumptions of the specialized model and using Roy’s identity, we obtain the first-order condition
![]() (12)
(12)
Since the two terms in the first bracket, the net benefit of legal capacity, are both non-negative and since ![]() , there are always positive investments in legal capacity. Moreover, a higher level of fiscal capacity in the income tax
, there are always positive investments in legal capacity. Moreover, a higher level of fiscal capacity in the income tax ![]() raises the equilibrium tax rate
raises the equilibrium tax rate ![]() . This way, a higher value of
. This way, a higher value of ![]() raises the net benefit of investing in legal capacity, by raising the private marginal surplus from higher wages as well as boosting the fiscal benefits of the income tax through a higher tax base.
raises the net benefit of investing in legal capacity, by raising the private marginal surplus from higher wages as well as boosting the fiscal benefits of the income tax through a higher tax base.
This result and the earlier result, that a higher ![]() makes (11) more likely to hold, make the investment in legal capacity and the investment in fiscal capacity necessary to introduce the income tax complementary decisions. This is a close relative to the complementarity discussed in Besley and Persson (2009a,b, 2011a,b,c). Thus, the endogenous growth of income triggered by investments in the productive side of the state makes it more likely that a country at some point in time will incur the fixed costs necessary to put an income tax in place.
makes (11) more likely to hold, make the investment in legal capacity and the investment in fiscal capacity necessary to introduce the income tax complementary decisions. This is a close relative to the complementarity discussed in Besley and Persson (2009a,b, 2011a,b,c). Thus, the endogenous growth of income triggered by investments in the productive side of the state makes it more likely that a country at some point in time will incur the fixed costs necessary to put an income tax in place.
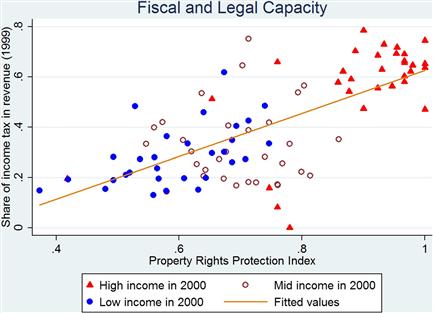
As discussed at length in this earlier work, measures of fiscal capacity—like a high share of total tax income collected by the income tax—and measures of legal capacity are strongly positively correlated across countries in the data, and both of these capacities indeed have a strong positive correlation with income.
This point is illustrated in Figure 12 which plots the share of income tax in total tax revenue in 1999 against the ICRG measure of property-rights protection. Countries that raise more in income tax (have more fiscal capacity) also tend to enforce property rights in a better way (have more legal capacity).
Structural change: Development is about a lot more than raising income per capita. The process of rising incomes typically goes hand in hand with structural change toward a more urbanized and non-agriculturally based economy. As a consequence, more economic activity operates in the open, particularly in the formal sector where transactions and employment relations are recorded. To some extent, informality in production is just the flip side of tax avoidance. But it is more than that. Firms also choose not to become part of the formal sector in order to avoid an array of regulations. But this has a cost: such firms are not able to take advantage of formal legal protection and contract disputes have to be resolved informally, often placing trust between parties at a premium. This limits the scope of business, which often becomes restricted to social networks.
The move toward formality tends to facilitate tax compliance. More employment takes place in legally registered firms rather than self-employment, as stressed by Kleven et al. (2009), and more financial transactions take place via formal intermediaries (such as banks), as stressed by Gordon and Li (2009). Both of these make transactions more visible to tax authorities and enable tax authorities to obtain corroborating evidence from cross-reported transactions. Falsifying these requires collusion rather than unilateral secrecy. Such changes result from transformations in the nature of economic activity whereby larger firms take advantage of scale economies in production. To the extent that this is reflected in higher wages, the arguments from the last section apply and we expect investments in fiscal capacity to occur.
The typical discussion of development and taxation couches structural change as an exogenous feature of economic development with causality running from economic development to fiscal capacity. This can be captured in our model either by allowing the function ![]() to depend on the sector of the economy in which an individual is operating. Suppose we exogenously assign individuals to the formal and informal sectors denoted by
to depend on the sector of the economy in which an individual is operating. Suppose we exogenously assign individuals to the formal and informal sectors denoted by ![]() where
where ![]() stands for “formal” and
stands for “formal” and ![]() for “informal” with evasion functions
for “informal” with evasion functions ![]() . We may then reasonably suppose that
. We may then reasonably suppose that
![]()
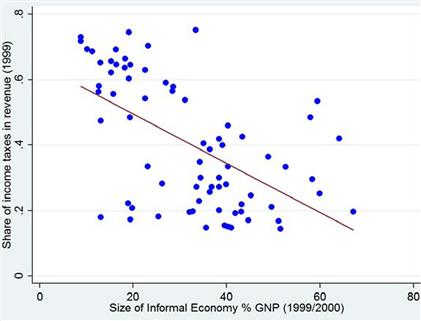
i.e., the marginal impact of an investment in fiscal capacity is more effective in deterring evasion for those operating in the formal sector. In this event, more formality would boost the revenues that can be generated from fiscal-capacity investments, all else equal. This is consistent with the observation that countries with smaller informal sectors also raise more taxes. This is illustrated in Figure 13 which plots a measure of the size of the informal economy in 1999/2000 from Schneider (2002) against the share of income taxes in total tax revenue in 1999 from Baunsgaard and Keen (2005). The downward sloping relationship is extremely clear.
The literature has paid less attention to the possibility that the size of the informal sector and the structural development of the economy evolve endogenously with the development of fiscal capacity, as in our discussion of legal capacity above. However, we may also take a further step and think of legal capacity as affecting the returns to being formal. It is very hard for an individual to simultaneously be largely invisible to the tax system and take full advantage of the formal legal system. This creates a further complementarity between the legal and fiscal capacities of the state. A state which invests in the infrastructure to support formal financial intermediation will overcome some of the barriers to formality and enhance the ability to raise more taxes. A good example are efforts to build credit and land registries in the process of development, to increase property rights and contract enforcement. Such registries bring the patterns of ownership and credit contracts into the daylight for tax authorities. To study these issues explicitly, we would have to extend the model with an endogenous decision to choose the sector ![]() based on costs and benefits. While a higher cost of tax evasion is a cost of choosing the formal sector, there may be benefits in the form of a better trading environment.20
based on costs and benefits. While a higher cost of tax evasion is a cost of choosing the formal sector, there may be benefits in the form of a better trading environment.20
5.2 Politics
No account of the development process can be complete without considering the political forces that shape policy selection. It is widely held that the failure of states to build strong institutions might reflect weak motives embedded in political institutions. In this section, we explore the implications of introducing a government which operates under institutional constraints and faces the possibility of political turnover. The specific framework that we use is based on Besley and Persson (2010a,b, 2011a,b,c). This belongs to a wider body of work and thinking in dynamic political economics which is reviewed in Acemoglu (2006). As we shall see, this adds new issues to the analysis of fiscal-capacity building and allows us to uncover additional forces which can explain high or low investments.
Cohesive institutions: Suppose the government in power acts on behalf of a specific group in the spirit of the citizen-candidate approach to politics—see Besley and Coate (1997) and Osborne and Slivinsky (1996). There is no agency problem within groups: whoever holds power on behalf of a group cares only about the average welfare of its members.
We model how political institutions constrain the incumbent’s allocation of transfers in a very simple way. Specifically, the incumbent group in period ![]() , called
, called ![]() , must give (at least) a fixed share
, must give (at least) a fixed share ![]() to all non-incumbent groups
to all non-incumbent groups ![]() for any unit of transfers awarded to its own group. That is to say, we impose the restriction
for any unit of transfers awarded to its own group. That is to say, we impose the restriction
![]()
The parameter ![]() represents the “cohesiveness” of institutions with
represents the “cohesiveness” of institutions with ![]() closer to
closer to ![]() representing greater cohesiveness.
representing greater cohesiveness.
This is an extremely simple and tractable, but reduced-form, way of looking at politics and is used extensively in Besley and Persson (2011a,b,c). We can interpret a higher value of ![]() in one of two broad ways. One real-world counterpart might be minority protection by constraints on the executive, due to some constitutional separation of powers. In practice, we expect democracies to impose greater constraints on the executive than autocracies. An alternative real-world counterpart might be stronger political representation of the interests of political losers in policy decisions through proportional representation elections or parliamentary democracy. The literature on the policy effects of constitutional rules suggests that both of these institutional arrangements make policymakers to internalize the preferences of a larger share of the population—see, e.g., Persson, Roland, and Tabellini (2004), Aghion, Alesina, and Trebbi (2000), and Persson and Tabellini (2000).
in one of two broad ways. One real-world counterpart might be minority protection by constraints on the executive, due to some constitutional separation of powers. In practice, we expect democracies to impose greater constraints on the executive than autocracies. An alternative real-world counterpart might be stronger political representation of the interests of political losers in policy decisions through proportional representation elections or parliamentary democracy. The literature on the policy effects of constitutional rules suggests that both of these institutional arrangements make policymakers to internalize the preferences of a larger share of the population—see, e.g., Persson, Roland, and Tabellini (2004), Aghion, Alesina, and Trebbi (2000), and Persson and Tabellini (2000).
In this representation of political institutions, we can solve for transfers allocated to the incumbent group and all the groups in opposition ![]() . In the model of Section 4, these are
. In the model of Section 4, these are
![]()
where
![]() (13)
(13)
For ![]() , any residual tax revenue is equally divided in transfers to all groups. Otherwise, the incumbent group receives a higher per-capita share of transfer spending.
, any residual tax revenue is equally divided in transfers to all groups. Otherwise, the incumbent group receives a higher per-capita share of transfer spending.
We maintain the simplifying assumption of a linear utility function for public goods, but allow the valuation of public goods to differ across groups. The shadow value of public revenue now compares the incumbent’s value of transfers ![]() to spending on public goods
to spending on public goods ![]() . As in the general model, we have two cases. If
. As in the general model, we have two cases. If ![]() , all spending is allocated to public goods, i.e.,
, all spending is allocated to public goods, i.e., ![]() , else the marginal value of public funds is
, else the marginal value of public funds is ![]() .21 Suppose now that a single group is in power in period 1 as well as period 2, i.e., there is a natural political elite and no political turnover for sure. In this case, the preferences of the elite determine policy and investment in fiscal capacity. For simplicity, we assume away any fixed costs in investment (or alternatively
.21 Suppose now that a single group is in power in period 1 as well as period 2, i.e., there is a natural political elite and no political turnover for sure. In this case, the preferences of the elite determine policy and investment in fiscal capacity. For simplicity, we assume away any fixed costs in investment (or alternatively ![]() for all
for all ![]() so that the fixed costs have already been incurred). Then, we get the following first-order conditions for investment in fiscal capacity:
so that the fixed costs have already been incurred). Then, we get the following first-order conditions for investment in fiscal capacity:
![]() (14)
(14)
![]()
The analysis requires only a modest modification of the benchmark model, where we recognize that the driving force behind the decision to build fiscal capacity is now the preference of the ruling elite for tax revenue, rather than society as a whole. Clearly, an elite that greatly values public goods is more likely to spend on public goods compared to one that does not. Spending on public goods rather than transfers is more likely as institutions become more cohesive, ![]() and the ability of the incumbent group to extract transfers diminishes. However, an elite can also be motivated to build capacity to collect tax revenue as a means of increasing transfers for itself when
and the ability of the incumbent group to extract transfers diminishes. However, an elite can also be motivated to build capacity to collect tax revenue as a means of increasing transfers for itself when ![]() , because the elite faces few constraints on its power to pursue group interests (i.e.,
, because the elite faces few constraints on its power to pursue group interests (i.e., ![]() is low which makes
is low which makes ![]() high).
high).
Political turnover: The model becomes more interesting when we introduce the possibility of political turnover, i.e., the identity of the incumbent group may shift over time. To home in on this issue, we specialize the model to the case of only two groups each comprising half the population, ![]() . Let
. Let ![]() be the probability that the incumbent group is replaced between the two time periods. Clearly,
be the probability that the incumbent group is replaced between the two time periods. Clearly, ![]() is a natural measure of political (in) stability. This new feature adds new and important dimensions to the analysis of policy and investments in fiscal capacity.
is a natural measure of political (in) stability. This new feature adds new and important dimensions to the analysis of policy and investments in fiscal capacity.
Let the period-![]() payoff of being either the incumbent or the opposition,
payoff of being either the incumbent or the opposition, ![]() , be:
, be:
![]()
where
![]()
is the total budget available for transfers, and ![]() and
and ![]() are the shares of transfers going to the incumbent and opposition groups. Now the level of fiscal capacity will be chosen to maximize
are the shares of transfers going to the incumbent and opposition groups. Now the level of fiscal capacity will be chosen to maximize
![]() (15)
(15)
The effect of political turnover follows from the fact that ![]() enters this expected payoff. The optimization of the incumbent over the vector of fiscal capacity yields:
enters this expected payoff. The optimization of the incumbent over the vector of fiscal capacity yields:
![]() (16)
(16)
![]()
which, of course, just says that marginal costs and benefits are equated (at an interior solution). The third marginal cost term in (16) is by now familiar. However, some additional considerations go into computing the marginal benefit represented by the first and second terms.
After some simple algebra, we can rewrite (16) as:
![]() (17)
(17)
![]()
where
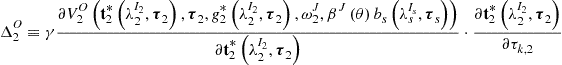 (18)
(18)
and
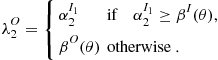
The third and fourth terms in (17) are the same as in earlier cases, capturing the utility costs of greater compliance and the marginal costs of investment in fiscal capacity. As before, the first term represents the value of extra revenue. However, the weight on this is now more complicated since the value of future public revenue to the current incumbent is different when a marginal future dollar is spent by a future incumbent different than herself, especially when the spending is on transfers rather than public goods. Unless there is agreement on the valuation of public goods ![]() and/or institutions are fully cohesive
and/or institutions are fully cohesive ![]() , we would expect
, we would expect ![]() , so this effect will tend to diminish the incentive to invest in fiscal capacity, and more so the higher is the probability of turnover
, so this effect will tend to diminish the incentive to invest in fiscal capacity, and more so the higher is the probability of turnover ![]() .
.
The second term ![]() is entirely new. It represents an effect familiar from the work on strategic policy making in dynamic models of politics, which began with Alesina and Tabellini (1990) and Persson and Svensson (1989). The fact that the current incumbent and opposition may differ in their views about optimal period-2 taxes, means that the period-1 incumbent should structure investments in fiscal capacity to influence those decisions. For example, she may overinvest (underinvest) in the income tax if she likes the income tax more (less) than the opposition, so as to encourage (discourage) the opposition in using the income tax in the future, and the more so the higher the likelihood that the opposition takes over.
is entirely new. It represents an effect familiar from the work on strategic policy making in dynamic models of politics, which began with Alesina and Tabellini (1990) and Persson and Svensson (1989). The fact that the current incumbent and opposition may differ in their views about optimal period-2 taxes, means that the period-1 incumbent should structure investments in fiscal capacity to influence those decisions. For example, she may overinvest (underinvest) in the income tax if she likes the income tax more (less) than the opposition, so as to encourage (discourage) the opposition in using the income tax in the future, and the more so the higher the likelihood that the opposition takes over.
The size of this effect and whether it is positive or negative cannot be determined without going into details. A specific example that may lead to underinvestments is the case of a period-1 high-wage incumbent, who might be unlikely to invest heavily in income tax compliance if she anticipates being replaced by a period-2 low-wage incumbent (see Section 5.3 for more details) who would like to engage in more redistribution.
On balance, we may therefore expect higher political turnover to diminish investments in fiscal capacity, especially if there are few executive constraints so that ![]() is low and transfers are unequally shared.
is low and transfers are unequally shared.
Three types of states: Following Besley and Persson (2011a,b,c), the political model of the previous section allows us to think about three types of fiscal states that can emerge, depending on the combination of political cohesiveness and turnover. For simplicity, and to focus on a specific set of issues, we will work through the case where ![]() and
and ![]() , so the valuations of public goods as well as earnings opportunities are identical across the two groups.
, so the valuations of public goods as well as earnings opportunities are identical across the two groups.
A common-interest state: As long as ![]() is high enough relative to the value of transfers, we have:
is high enough relative to the value of transfers, we have:
![]() (19)
(19)
In this case, all incremental tax revenue is spent on public goods and there is agreement about the future value of public funds. We will refer to this as a case of common interests, as both groups agree that the state should be for a common purpose, either because public goods are valuable (so that ![]() is high), or political institutions are very cohesive (so that
is high), or political institutions are very cohesive (so that ![]() is low). In this case, we have a common-interest state, where the level of investment is driven entirely by the motive to invest in tax revenue to provide public goods. Moreover, both groups agree on the level and structure of taxation. The Euler equations for investing in fiscal capacity become identical to the benchmark model in Section 3, namely:
is low). In this case, we have a common-interest state, where the level of investment is driven entirely by the motive to invest in tax revenue to provide public goods. Moreover, both groups agree on the level and structure of taxation. The Euler equations for investing in fiscal capacity become identical to the benchmark model in Section 3, namely:
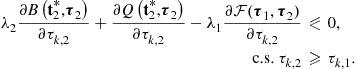
Political institutions do not affect these decisions since the two groups agree on policy, and the state is run with a common purpose, no matter who is in charge. Although somewhat stylized, the nearest real-world example might be what happens in a state of war, or a common external threat where common interests are paramount. We return to this theme in Section 5.3 on the value of public spending.
A redistributive state: Now consider what happens when
![]() (20)
(20)
In this case, the marginal dollar is spent on transfers, i.e., ![]() . Moreover, the value of public funds to the opposition is
. Moreover, the value of public funds to the opposition is ![]() . Now each group values public revenues differently and the period-1 incumbent cares about whether his group will remain in power to reap the rewards from investing in fiscal capacity which will accrue to the incumbent. The expected value of public revenues in period-2 to the period-1 incumbent is now:
. Now each group values public revenues differently and the period-1 incumbent cares about whether his group will remain in power to reap the rewards from investing in fiscal capacity which will accrue to the incumbent. The expected value of public revenues in period-2 to the period-1 incumbent is now:
![]()
which is decreasing in ![]() for all
for all ![]() . Indeed, this value is maximized at
. Indeed, this value is maximized at ![]() , when
, when ![]() . This is the case, when an incumbent faces no threat of removal and no executive constraints. The desire to build a revenue base is then based on the desire to redistribute resources toward the incumbent group.
. This is the case, when an incumbent faces no threat of removal and no executive constraints. The desire to build a revenue base is then based on the desire to redistribute resources toward the incumbent group.
Besley and Persson (2011a,b,c) refer to the case where a strong group-based motive to redistribute is the driving force for state building as a redistributive state. Such states thrive on low turnover and low cohesion. In the limiting case of ![]() , the Euler equations are:
, the Euler equations are:
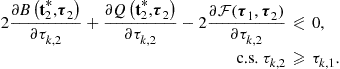
Since the incumbent is guaranteed to remain in power, the strategic effect disappears.
A weak state: A weak state combines non-cohesive institutions so that (20) holds with high political instability. To illustrate this, consider what happens if an incumbent expects to lose power for sure and his successor faces no meaningful executive constraints, i.e., ![]() and
and ![]() . Then, the expected value of public revenues created by investments in fiscal capacity is zero! The future incumbent, i.e., the current opposition is the residual claimant on all revenue created by fiscal-capacity investments. In this special case, the fiscal-capacity Euler equations are:
. Then, the expected value of public revenues created by investments in fiscal capacity is zero! The future incumbent, i.e., the current opposition is the residual claimant on all revenue created by fiscal-capacity investments. In this special case, the fiscal-capacity Euler equations are:
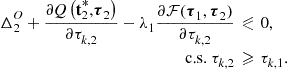
Since the second and the third terms are both negative, the only potential argument for building fiscal capacity would be to influence strategically the decisions over taxation of a future incumbent, according to the first term. However, this term is negative too: because ![]() , the future incumbent (the current opposition) wants (much) higher taxation than the current incumbent. Hence, the strategic motive makes the current incumbent not want to invest at all, perhaps even destroy fiscal capacity if that is a feasible option.
, the future incumbent (the current opposition) wants (much) higher taxation than the current incumbent. Hence, the strategic motive makes the current incumbent not want to invest at all, perhaps even destroy fiscal capacity if that is a feasible option.
While we have illustrated this mechanism for an extreme case, the logic is much more general. Political instability and little political cohesion (weak executive constraints) generally mean that the incentives to invest in fiscal capacity are very weak, so we expect tax compliance and hence tax revenues to stay poorly developed under these conditions.
One bottom line of this discussion is that we should expect countries that have operated on more cohesive institutions in the past to have a higher stock of fiscal capacity today. Besley and Persson (2011c, chaps. 2 & 3) show that this is indeed the case, when fiscal capacity is measured in different ways and cohesive political institutions are measured by executive constraints. Political instability is harder to measure in a convincing way, but there seems to be some evidence that more stability is correlated with higher fiscal capacity.22
Figure 14 illustrates the relationship between current fiscal capacity and past cohesive political institutions using a partial correlation plot. As a measure of cohesiveness, we use the history of the strength of a country’s executive constraints from 1800, or its year of creation, up to 2000. As in Section 3, the data come from the Polity IV database, specifically the variable executive constraints measuring various checks and balances on the executive. Following the theory outlined above, the underlying regression controls for the value of public spending, through measures of ethnic fractionalization and (past) external wars, and the degree of political instability, through measures of openness and competition in the selection of the executive. We see a very clear upward slope in the regression line, consistent with the argument in this section—countries with a history of more cohesive institutions appear to have built more fiscal capacity.23
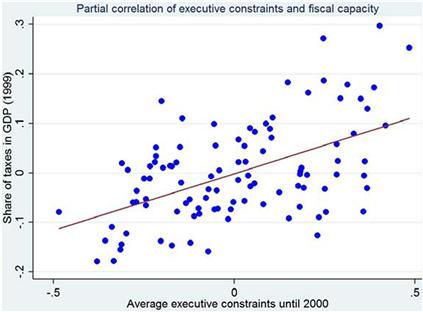
Social Structure: The two-group model with common valuations of public goods and identical wages has served well to illustrate some key points. But clearly, it misses a lot in terms of social structure which may affect the struggle for power. Indeed political struggle often has different values concerning public spending and/or an unequal distribution of resources at its heart. We now briefly explore these issues and their implications for investing in fiscal capacity.
Group size and elite rule: Suppose the two groups in the specialized model have different size but face the same institutions, as represented by ![]() , when in office. Observe that
, when in office. Observe that ![]() , as defined in (13), is larger for the minority group than for the majority group, meaning that transfer behavior becomes more cohesive when larger groups are in office, as their value of extracting a dollar in transfers is much lower than for a small group. A lower value of
, as defined in (13), is larger for the minority group than for the majority group, meaning that transfer behavior becomes more cohesive when larger groups are in office, as their value of extracting a dollar in transfers is much lower than for a small group. A lower value of ![]() means that the condition
means that the condition
![]()
for all spending to be on public goods is more easily fulfilled. Thus, there is a greater chance the state pursues a policy in the common interest when large groups hold power. In view of this, majority rule is more likely to stimulate the build-up of fiscal capacity than minority rule. Indeed, if a country is governed by a small elite, it seems rather unlikely that a common-interest state will emerge—instead the state will become redistributive or weak.
The same basic effect emerges when a leader rules on behalf of a small elite rather than on behalf of her group as a whole. When such narrow elites alternate in power, it is difficult to create common interests in the use of public resources. Therefore, the value of political reform that raises ![]() toward 1 can be particularly strong in such countries. Similarly, measures which reduce the agency problem between elites and rank and file group members could also push a country toward a common-interest state.
toward 1 can be particularly strong in such countries. Similarly, measures which reduce the agency problem between elites and rank and file group members could also push a country toward a common-interest state.
Income inequality: The discussion in Section 5.2, abstracted from heterogeneity in earnings. To focus on this, we now look exclusively at income taxation and assume away all other forms of heterogeneity, e.g., in group size or preferences for public spending. Using the standard logic from Romer (1975), Roberts (1977), and Meltzer and Richards (1981), we would expect a low-income group to prefer a higher rate of income taxation than the high-income group, due to the redistributive effect of income taxation whether it is spent on public goods or transfers. We might also expect these policy preferences to translate into different incentives to invest in fiscal capacity to increase income taxation.24
These mechanisms are most simply illustrated in the case of a common-interest state where (19) holds. Suppose we specialize the model to two groups, ![]() , where
, where ![]() stands for “poor” and
stands for “poor” and ![]() for “rich” with
for “rich” with ![]() . By dropping the time subscripts, we are assuming that the wages of the rich and the poor stay constant over periods 1 and 2. In the case with constant elasticity of labor supply, the income tax preferred by group
. By dropping the time subscripts, we are assuming that the wages of the rich and the poor stay constant over periods 1 and 2. In the case with constant elasticity of labor supply, the income tax preferred by group ![]() (assuming an interior solution) becomes:
(assuming an interior solution) becomes:
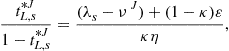 (21)
(21)
where ![]() is the ratio of group
is the ratio of group ![]() ’s labor income to average labor income. For the rich to want a positive income tax, the value of public spending as represented by
’s labor income to average labor income. For the rich to want a positive income tax, the value of public spending as represented by ![]() has to be great enough. Clearly, we have
has to be great enough. Clearly, we have
![]()
in general. We can now say something concrete about the strategic effect in Eq. (18) provided we assume, as the discussion following Eq. (5) suggests, that
![]()
This says that an incumbent of any type would wish to implement a higher rate of income taxation if there is greater fiscal capacity in the income tax. Recall that this effect arises because greater fiscal capacity in the form of income tax enforcement raises the marginal yield from any given statutory income tax rate. The strategic effects become:
![]()
To see why, take the case of a rich incumbent. If the poor group takes over in the future, then it will tax too much from the viewpoint of the rich, so a rich group contemplating being in future opposition would gain a strategic advantage by lowering fiscal capacity. In the same way, a poor incumbent contemplating being in future opposition would gain a strategic advantage by pushing investment in income tax capacity further. These incentives are larger the higher is income inequality and the larger is political instability. The logic is the same as the one that makes a right-wing group want to impose a larger debt on a left-wing successor, and a left-wing group to impose a smaller debt on a right-wing successor, in Persson and Svensson (1989).
It is perhaps unsurprising that inequality creates a conflict of interest over investing in fiscal capacity, which mirrors the conflict of interest over the tax base itself. However, the patterns of political control also matter to whether income tax capacity gets built. If the rich have a secure hold on power, they will invest in fiscal capacity to support public spending. However, if they fear losing power, they will invest less as their investment would encourage the poor to use income taxation more intensively in the future making the rich pay for an even larger share of public spending. If the poor are securely in power, this should encourage investment in income tax capacity. To the extent that transitions to more democratic rule lead to lower-income citizens being in political ascendancy, we should observe a tendency to build income tax capacity. This would be spurred on even further if the poor are more fearful of a reversion to elite rule. Generally, the poor have a strategic incentive to overinvest.
While we have applied this argument to income tax capacity, the same argument applies to any tax base which generates a strong conflict of interest between groups that could hold power. We have made the argument in the case of a common-interest state, where there is agreement over the disbursement of public resources. But the basic logic could equally well be applied to a redistributive or weak state.
The bottom line from this discussion is that we may expect income inequality to play an important role in the development of fiscal capacity. Given that a high level of income inequality particularly curtails the investment incentives for a rich incumbent, this conclusion is strengthened if we are willing to assume that economic power and political power tend to go hand in hand. Cárdenas (2010) considers the question empirically, using cross-sectional data for 100 + countries, and finds that political and (especially) economic inequality appears to be associated with lower incentives to invest in state capacity. In fact, he uses income inequality to explain Latin America’s generally underdeveloped fiscal capacity.
Polarization: In the political models above, we have assumed that there is a common way of valuing public goods across the two groups. However, this need not be the case. Alesina, Baqir, and Easterly (1999), e.g., have forcefully argued that ethnic conflicts may lead to polarized preferences that diminish society’s spending on public goods.25 Differences in valuation may reflect, e.g., ethnic, linguistic, or religious cleavages in society. We now briefly consider the implications of such divergent views, which we think about in two different ways. First, we consider what happens when groups inherently differ in their value of public goods in a way unrelated to whether they are incumbents. Second, we consider the possibility that differences arise according to whether a group is an incumbent, since an important dimension of policy choice may be the type of public goods that are chosen.
To illustrate the first case, we suppose that ![]() with
with ![]() . For simplicity, we focus on the common-interest case where all public spending is allocated to public goods. Now it is clear that the marginal value of public spending depends on which group is in office. Any group for whom
. For simplicity, we focus on the common-interest case where all public spending is allocated to public goods. Now it is clear that the marginal value of public spending depends on which group is in office. Any group for whom ![]() has a higher value of future public funds
has a higher value of future public funds ![]() than the low-valuation group, and will therefore invest more in fiscal capacity of all types, everything else equal. For such groups, securely holding power will encourage investing. One interpretation of such heterogeneity in values may be that certain groups have stronger social capital and hence can provide public goods on their own, e.g., through ethnic or family networks. Then, arranging the public-goods provision through the state will be of lesser interest. For example, authors such as Esping-Andersen (1999) and, more recently, Alesina and Guiliano (2010) have argued that countries with strong family ties invest less in the welfare state.
than the low-valuation group, and will therefore invest more in fiscal capacity of all types, everything else equal. For such groups, securely holding power will encourage investing. One interpretation of such heterogeneity in values may be that certain groups have stronger social capital and hence can provide public goods on their own, e.g., through ethnic or family networks. Then, arranging the public-goods provision through the state will be of lesser interest. For example, authors such as Esping-Andersen (1999) and, more recently, Alesina and Guiliano (2010) have argued that countries with strong family ties invest less in the welfare state.
To illustrate the second case, where the decision rights of being in power affects the mix of public goods when in office, we suppose that ![]() .26 In this case,
.26 In this case, ![]() becomes a natural measure of the polarization in preferences. The expected value of future public revenues to an incumbent becomes
becomes a natural measure of the polarization in preferences. The expected value of future public revenues to an incumbent becomes
![]()
It follows from the expressions above that more polarization and higher political instability both reduce the incentive to invest in fiscal capacity of all types. Figure 15 illustrates the partial correlation (controlling for political stability, executive constraints, and external wars) between ethnic fractionalization and the share of taxes in GDP.27 There is a clear negative relationship between the two.28
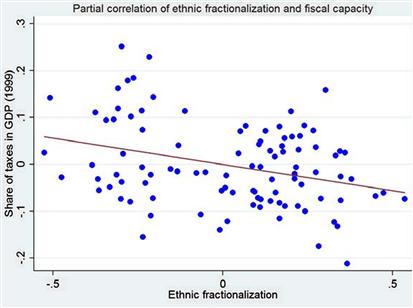
5.3 Value of Public Spending
Our approach gives the value of collective goods a central place among the motives to build fiscal capacity. Formally, parameter ![]() affects the value of public revenues in the eyes of group
affects the value of public revenues in the eyes of group ![]() . In this section, we discuss some factors that go into determining this value. Of course, in the standard interpretation, these are just fixed preference parameters. But there are strong reasons to think that they depend on factors which can be shaped by history as well as policy.
. In this section, we discuss some factors that go into determining this value. Of course, in the standard interpretation, these are just fixed preference parameters. But there are strong reasons to think that they depend on factors which can be shaped by history as well as policy.
Common-interest spending and war finance: As discussed in the introduction, war has played a central role in the history of public finance. In terms of the model, external threats can help determine the structure of preferences ![]() . The threat of war may also act like a common-interest shock that moves a society close to a common-interest state, or from the status of a weak to a redistributive state (at least during a period where the threat is felt). In our approach, the mechanism is to raise the value of public revenues and make it incentive compatible to spend these revenues on public goods rather than redistribution. This allows our framework to capture the arguments made by Hintze (1906), Tilly (1985, 1990), and others. Dincecco and Prado (2010) use pre-modern war causalities to explain fiscal capacity today (measured as direct taxes as a share of total taxes), and relate GDP per capita to fiscal capacity. Gennaioli and Voth (2011) build a two-country model, where endogenous external conflict interacts with the fragmentation of political institutions and the cost of war to shape state-building motives. They then apply the insights of the model to explain the divergent paths of taxation of European states in the years between 1500 and 1800. Feldman and Slemrod (2009) link tax compliance to episodes of war. Figure 16 illustrates the partial correlation between the share of years in war from 1800 (or year of independence) and the share of taxes in GDP in 1999.
. The threat of war may also act like a common-interest shock that moves a society close to a common-interest state, or from the status of a weak to a redistributive state (at least during a period where the threat is felt). In our approach, the mechanism is to raise the value of public revenues and make it incentive compatible to spend these revenues on public goods rather than redistribution. This allows our framework to capture the arguments made by Hintze (1906), Tilly (1985, 1990), and others. Dincecco and Prado (2010) use pre-modern war causalities to explain fiscal capacity today (measured as direct taxes as a share of total taxes), and relate GDP per capita to fiscal capacity. Gennaioli and Voth (2011) build a two-country model, where endogenous external conflict interacts with the fragmentation of political institutions and the cost of war to shape state-building motives. They then apply the insights of the model to explain the divergent paths of taxation of European states in the years between 1500 and 1800. Feldman and Slemrod (2009) link tax compliance to episodes of war. Figure 16 illustrates the partial correlation between the share of years in war from 1800 (or year of independence) and the share of taxes in GDP in 1999.
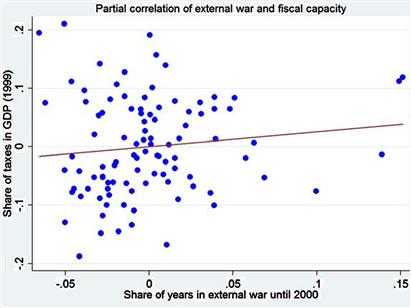
War may have other effects which are more non-standard to the extent that war actually shapes social preferences. One interpretation may be that it diminishes polarization, as citizens forge a clearer sense of national identity—see Shayo (2009) on the endogenous formation of national identity. This might translate a transitory shock to a permanent effect. Thus, war may have lasting effects in a dynamic model where fiscal capacity investments are long-lived. The fact that a country built a strong tax system during a past war may raise its long-term tax take to the extent that such investments are permanent. This could be true, for example, in countries that introduced collection of income taxes at source as a means to help finance their war expenditures.29
An important aspect of income tax compliance is direct withholding of taxes from wage packets. So its introduction is an interesting discrete investment in income tax capacity. Figure 17 illustrates the introduction of withholding over time, for a sample of 76 countries for which we have been able to find data. We compare the 19 countries in this sample that participated in the second world war (WWII) with the 57 that did not. The significant increase in the proportion of countries with direct withholding among the war participants is striking, especially when compared to the non-perceptible effect among the non-participants. Although this figure represents no more than casual empiricism, it is consistent with the arguments in this section.
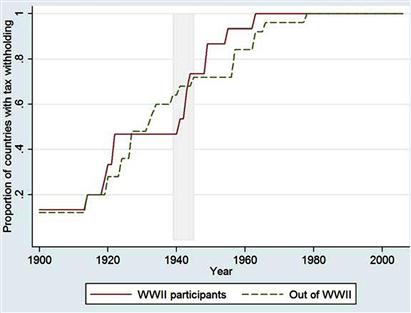
Identifying public projects: We could also see ![]() as reflecting the ability of governments to identify good projects. An important line of development research in recent years has been instrumental in using Randomized Controlled Trials (RCTs) to identify the value of public interventions. These can be thought of as trying to find ways of better allocating resources to public goods by identifying high-benefit interventions. (See Duflo, Glennerster, & Kremer, 2007 and Banerjee & Duflo (2009) for a discussion of the methodology.)
as reflecting the ability of governments to identify good projects. An important line of development research in recent years has been instrumental in using Randomized Controlled Trials (RCTs) to identify the value of public interventions. These can be thought of as trying to find ways of better allocating resources to public goods by identifying high-benefit interventions. (See Duflo, Glennerster, & Kremer, 2007 and Banerjee & Duflo (2009) for a discussion of the methodology.)
In our framework, we can represent an RCT as a particular form of experiment to evaluate project effectiveness. To model this, suppose there is a continuum of possible public projects indexed by ![]() where some have high returns and other low returns. Preferences for public goods are now:
where some have high returns and other low returns. Preferences for public goods are now:
![]()
where ![]() is spending on projects of type
is spending on projects of type ![]() . In the absence of discriminating information, we assume that the expected return on each project is the same, such that
. In the absence of discriminating information, we assume that the expected return on each project is the same, such that ![]() . In this case, spending will be identical on all projects. For the sake of illustration, let us suppose that utility from public goods is quadratic, i.e.,
. In this case, spending will be identical on all projects. For the sake of illustration, let us suppose that utility from public goods is quadratic, i.e., ![]() .
.
Suppose now that RCTs have been conducted on a subset of projects, which we assign to the interval ![]() , to establish which have high and low returns. For simplicity, suppose all projects are equally likely to be high return,
, to establish which have high and low returns. For simplicity, suppose all projects are equally likely to be high return, ![]() or low return
or low return ![]() and that
and that
![]()
Given the outcomes of the trials and a given level of public spending, ![]() , the government chooses three numbers—
, the government chooses three numbers—![]() , and
, and ![]() —to maximize:
—to maximize:
![]()
subject to
![]()
This will lead to governments spending more on projects that have value ![]() , and less on those with value
, and less on those with value ![]() . Denote the solution by
. Denote the solution by ![]() . Solving this for the quadratic case, the marginal value of public goods spending is
. Solving this for the quadratic case, the marginal value of public goods spending is
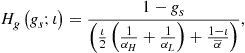
an expression which is increasing in ![]() , the fraction of spending in which the government is informed about returns. In words, better information about worthwhile projects raises the value of public spending. Moreover, this information effect is larger the greater is the difference between high and low returns,
, the fraction of spending in which the government is informed about returns. In words, better information about worthwhile projects raises the value of public spending. Moreover, this information effect is larger the greater is the difference between high and low returns, ![]() .
.
This illustrates how public interventions found through randomized-controlled trials—provided they could be scaled up to achieve large aggregate returns—might assist the creation of common-interest states. Arguably, the argument may also illustrate why Western welfare states have gradually become the engine of state development during times of peace. Creating effective public health-care systems seems like an especially important example. Such systems persist essentially because the returns are perceived as common-interest spending with high returns.
One could develop a related argument regarding improvements in cost efficiency in the delivery of public spending. In that case, there could be a role for using knowledge about best practice to enhance the value of public spending. This could include innovations in the mode of delivery or lower cost forms of delivery, such as making better use of information and communication technologies. Our modeling approach links such efficiency enhancement to the scale of demand for public goods at the expense of transfer payments.
The key point here is to point to a complementarity between creating fiscal capacity and finding better and more efficient ways of spending public resources.
Corruption: Our model assumes that all resources that are spent on public projects find their way into actual spending on public goods. But in many countries, this is a poor assumption due to high levels of corruption. Many studies, following the pioneering work by Reinikka and Svensson (2008), have shown the value of interventions which reduce corruption and increase the effective flow of spending benefiting the end users.
This argument is especially poignant when fiscal capacity is endogenous. Suppose that only a fraction ![]() of the intended spending on public goods actually finds its way into actual spending on the ground. If so, the value of public goods is
of the intended spending on public goods actually finds its way into actual spending on the ground. If so, the value of public goods is
![]()
In terms of accounting, a share of the spending, ![]() , ends up in the hands of citizens who earn corruption rents. Indeed, if
, ends up in the hands of citizens who earn corruption rents. Indeed, if ![]() is a pure transfer, then corruption is also a pure transfer. In practice, corruption in this or other forms creates constituencies in favor of maintaining the status quo. In terms of our approach, if the corruption rents flow disproportionately to ruling groups, this can affect the decisions to build fiscal capacity.
is a pure transfer, then corruption is also a pure transfer. In practice, corruption in this or other forms creates constituencies in favor of maintaining the status quo. In terms of our approach, if the corruption rents flow disproportionately to ruling groups, this can affect the decisions to build fiscal capacity.
To understand the implications for public finance, we ask how the parameter ![]() affects incentives to build fiscal capacity. Two broad effects need to be understood. First, we have an effect on the marginal value of spending on public goods. This depends on how
affects incentives to build fiscal capacity. Two broad effects need to be understood. First, we have an effect on the marginal value of spending on public goods. This depends on how
![]()
depends on ![]() . As long as the elasticity
. As long as the elasticity ![]() is less than unity, greater corruption reduces the marginal value of spending on public goods.
is less than unity, greater corruption reduces the marginal value of spending on public goods.
The second effect comes from the distribution of rents from corruption ![]() . If these accrue exclusively to the incumbent group, this will enhance the value of holding power—in effect, there is a blur between spending on transfers and on public goods since:
. If these accrue exclusively to the incumbent group, this will enhance the value of holding power—in effect, there is a blur between spending on transfers and on public goods since:
![]()
With low political turnover ![]() , corruption tends to enhance motives for building fiscal capacity, as in the case of a redistributive state above. But this effect is weakened by turnover, as in the case of the redistributive state. Moreover, even as
, corruption tends to enhance motives for building fiscal capacity, as in the case of a redistributive state above. But this effect is weakened by turnover, as in the case of the redistributive state. Moreover, even as ![]() , a redistributive motive for building fiscal capacity remains due to extra-budget transfers accruing to incumbents through corruption. To the extent that corruption rents are widely held, i.e., are not distributed toward incumbent status, these motives will be weakened.
, a redistributive motive for building fiscal capacity remains due to extra-budget transfers accruing to incumbents through corruption. To the extent that corruption rents are widely held, i.e., are not distributed toward incumbent status, these motives will be weakened.
In summary, the first effect, via the marginal value of public goods, likely cuts the value of public funds and thus reduces the motives for investing in fiscal capacity. The second effect, via corruption rents, may go the other way—at least when incumbent groups capture a large share of the rents from corruption.
Summary: The discussion in this section ties together the taxation and spending sides of the state. A requirement for building a state run on common-interest grounds is that public revenues are spent on goods valued by a wide group of citizens. In history, war has arguably been an important source of such common interests and provides a key motive for creating fiscal capacity. Our framework suggests that states which lack common interests will have fiscally weak states, all else equal. One way to foster such interests might be to improve project evaluation and to identify which public interventions work in practice. This may not only improve the use of a given budget, but may also foster endogenous increases in fiscal capacity. As we have seen, combatting corruption in public spending is also linked to the motives for building an effective tax system.
5.4 Non-Tax Revenues
Our model framework permits states to have a source of non-tax revenues, denoted ![]() , in the form of aid or natural resources. How this affects incentives to invest is clear in the first-order conditions for fiscal capacity (8). The conditions show that non-tax income matters for investments in the state through changing the marginal value of tax revenue, as represented by
, in the form of aid or natural resources. How this affects incentives to invest is clear in the first-order conditions for fiscal capacity (8). The conditions show that non-tax income matters for investments in the state through changing the marginal value of tax revenue, as represented by ![]() and
and ![]() .
.
Aid and development finance: Anticipated period-2 aid, embodied in ![]() , reduces the incentive to invest, whenever marginal spending is allocated to public goods. However, current non-tax income,
, reduces the incentive to invest, whenever marginal spending is allocated to public goods. However, current non-tax income, ![]() , reduces costs of investing in the short term, when marginal spending is on public goods, thus boosting the incentives to invest. When the transfer motive for investing in the state is dominant, we would expect aid and resources to go into transfers having no effect on the incentive to build fiscal capacity. As a result, political institutions matter—in the way we have already discussed—by governing the likelihood that a common-interest, rather than special-interest, motives dominate politics.
, reduces costs of investing in the short term, when marginal spending is on public goods, thus boosting the incentives to invest. When the transfer motive for investing in the state is dominant, we would expect aid and resources to go into transfers having no effect on the incentive to build fiscal capacity. As a result, political institutions matter—in the way we have already discussed—by governing the likelihood that a common-interest, rather than special-interest, motives dominate politics.
This discussion justifies the standard focus of development finance on lending to government rather than handing out cash grants. Lending promotes the incentives to build an effective tax system. When public goods are valuable, a period-1 grant or loan should increase investment in fiscal capacity. Forcing repayment of the loan, thereby increasing ![]() , further reinforces the investment effect. But the incentives would be reversed in a Samaritan’s dilemma, where a period-1 failure to invest in fiscal capacity elicits more aid to be paid in period 2. This dilemma seems relevant to some debates about the situation in aid-dependent countries where part of the gain from building indigenous fiscal capacity would be taxed away in the form of lower aid.
, further reinforces the investment effect. But the incentives would be reversed in a Samaritan’s dilemma, where a period-1 failure to invest in fiscal capacity elicits more aid to be paid in period 2. This dilemma seems relevant to some debates about the situation in aid-dependent countries where part of the gain from building indigenous fiscal capacity would be taxed away in the form of lower aid.
Figure 18 looks at the relationship between fiscal capacity, measured by the total tax take, and aid receipts as a share of gross national income from the World Development Indicators database. The graph shows that the partial correlation (controlling for political stability, executive constraints, external war, and ethnic fractionalization) is negative, in line with what we would expect within the framework presented here. Of course, the direction of causality implied by a picture like this is far from clear. One justification of aid is often the difficulty that poor countries have in raising revenue domestically. Therefore, aid is unlikely to be exogenous to the process of fiscal-capacity investment.
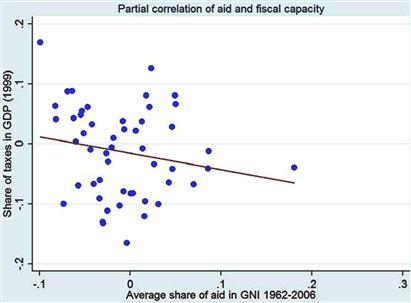
Resource revenues: The model also gives insights into why natural resource discoveries can stifle the efforts to build fiscal capacity. A government that discovers oil in period 1 with anticipated revenues in period 2 will reduce their investment in fiscal capacity. Of course, such resource revenues may be beneficial but may necessitate a catch-up period of fiscal-capacity building and leave country vulnerable to negative commodity-price shocks.
Some data support the prediction that fiscal-capacity building is related to resource dependence. Jensen (2011) presents econometric evidence, using panel data with country-specific price indexes constructed for natural gas and oil and weighted by respective shares in total national energy production. He finds that a 1% increase in the share of natural resource rents in total government income is associated with a 1.4% decrease in the fiscal capacity of a country.
Informal taxation: The previous subsection discussed the role of corruption on the spending side of the state and touched upon the revenues generated by corruption. But corruption may also work as a direct, non-tax revenue-raising device for governments or government bureaucrats. Like explicit taxation, such informal means of extracting revenue through corruption imposes static and dynamic distortions on the business of the private sector. Here, we briefly discuss how such considerations can be brought into the approach.
Suppose that there are now two kinds of taxation on activity ![]() in period
in period ![]() , the formal tax rate
, the formal tax rate ![]() studied above and informal taxation at rate
studied above and informal taxation at rate ![]() . Unlike formal taxation, we suppose that returns to corruption accrue directly as transfers to the ruling group, rather than being funneled through the public budget and subject to any checks and balances in place to constrain government spending. Moreover, we suppose that the governing group has some “informal fiscal capacity” and that it is impossible to avoid corruption. This may be extreme, but will serve us well to make a few important points. It is clear that we could extend the treatment and make informal and formal fiscal capacity more alike.
. Unlike formal taxation, we suppose that returns to corruption accrue directly as transfers to the ruling group, rather than being funneled through the public budget and subject to any checks and balances in place to constrain government spending. Moreover, we suppose that the governing group has some “informal fiscal capacity” and that it is impossible to avoid corruption. This may be extreme, but will serve us well to make a few important points. It is clear that we could extend the treatment and make informal and formal fiscal capacity more alike.
The individual budget constraint is now:

and the earnings from informal taxation are
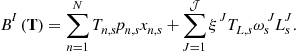
The existence of such informal taxation affects optimal formal tax rates, as formal and informal tax rates interact for each tax base.
An increase in ![]() has a static effect in that it cuts available formal tax revenue by reducing goods demand or labor supply. This is a negative externality for formal taxation. If the motive for informal taxation is purely redistributive, as here, it also reduces the resources available to spend on public goods. There are no constraints on raising such revenues except any informal controls that may exist within a group. Incentives for informal taxation are particularly high when the revenues accrue to a small subset, an “elite,” within the ruling group. In addition to this static effect, however, informal taxation through corruption can also have a dynamic effect. Specifically, it may undermine the incentive to invest in the formal tax base, since the latter shrinks in response to informal taxation. The lower tax base therefore diminishes investments in formal fiscal capacity, paralleling the effect of a lower level of development in Section 5.1.
has a static effect in that it cuts available formal tax revenue by reducing goods demand or labor supply. This is a negative externality for formal taxation. If the motive for informal taxation is purely redistributive, as here, it also reduces the resources available to spend on public goods. There are no constraints on raising such revenues except any informal controls that may exist within a group. Incentives for informal taxation are particularly high when the revenues accrue to a small subset, an “elite,” within the ruling group. In addition to this static effect, however, informal taxation through corruption can also have a dynamic effect. Specifically, it may undermine the incentive to invest in the formal tax base, since the latter shrinks in response to informal taxation. The lower tax base therefore diminishes investments in formal fiscal capacity, paralleling the effect of a lower level of development in Section 5.1.
Unlike corruption on the spending side, we would thus expect higher corruption on the revenue side to be associated with less tax collection, everything else equal. This is confirmed in Figure 19, which plots the partial correlation between fiscal capacity (measured by total tax take) and corruption, measured by a perceptions index from Transparency International (a higher score denotes less corruption).30 Countries with a higher share of taxes in GDP are also the least corrupt. Of course, as with our other correlations, this should not be interpreted as a causal relationship.
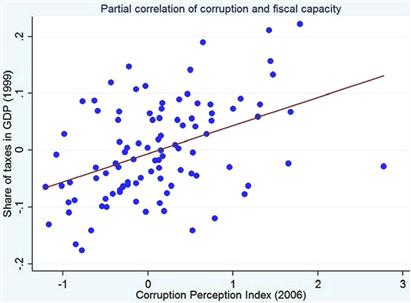
5.5 Compliance Technologies
So far, we have basically left the technology for evading taxes and for increasing compliance as a black box. In this section, we will open this black box a little to see how this can enrich the analysis. We begin with a simple model of the forces that may shape the costs of non-compliance, and then extend it in a few ways to motivate interventions to increase compliance.
A simple micro-foundation for the costs of non-compliance: The simplest micro-foundation for the evasion cost function ![]() , which plays a crucial role for tax compliance, is a variant of the classic analysis of detection and punishment. Let
, which plays a crucial role for tax compliance, is a variant of the classic analysis of detection and punishment. Let ![]() be a non-pecuniary punishment for non-compliance with the tax code, which is increasing and convex in the amount of evasion
be a non-pecuniary punishment for non-compliance with the tax code, which is increasing and convex in the amount of evasion ![]() and let
and let ![]() be the probability of detection, which is increasing in
be the probability of detection, which is increasing in ![]() .31 Then
.31 Then
![]()
This is the classic Allingham and Sandmo (1972) model of evasion, except that we have supposed that punishments are non-pecuniary. To the extent that ![]() is pecuniary, it adds directly to tax revenue and would have to be added to the government budget constraint. However, this would be a fairly minor difference with little effect on the main insights and we therefore stick to the non-pecuniary punishment case.
is pecuniary, it adds directly to tax revenue and would have to be added to the government budget constraint. However, this would be a fairly minor difference with little effect on the main insights and we therefore stick to the non-pecuniary punishment case.
The other important part of the compliance technology is ![]() —factors shaping the probability of being caught and facing a sanction. A raft of measures based on technological improvements in record keeping and the competence of tax authorities belongs here. It is questionable whether low-income countries generally use best-practice procedures, so there might be scope for technology transfer. At least, this seems to be a presumption motivating extensive technical development assistance, in the form of capacity building in the area of taxation.
—factors shaping the probability of being caught and facing a sanction. A raft of measures based on technological improvements in record keeping and the competence of tax authorities belongs here. It is questionable whether low-income countries generally use best-practice procedures, so there might be scope for technology transfer. At least, this seems to be a presumption motivating extensive technical development assistance, in the form of capacity building in the area of taxation.
The function ![]() also depends on the production structure, as we discussed in Section 5.1, with some kinds of economic activities intrinsically easier to monitor than others depending on the degree of formality, the need for transparent record keeping, and the use of the formal financial system.
also depends on the production structure, as we discussed in Section 5.1, with some kinds of economic activities intrinsically easier to monitor than others depending on the degree of formality, the need for transparent record keeping, and the use of the formal financial system.
Social norms and tax morale: The model can be used to consider the role of social norms in affecting tax compliance. Suppose that shame or stigma from non-compliance in a particular tax base depends on the average amount of non-compliance in the population as a whole, which we denote by ![]() . Thus
. Thus
![]()
with ![]() , i.e., an increasing amount of evasion in the population as a whole lowers the stigma/shame from cheating. In this simple case, evasion decisions, corresponding to (1) in Section 4, will form a Nash equilibrium where:
, i.e., an increasing amount of evasion in the population as a whole lowers the stigma/shame from cheating. In this simple case, evasion decisions, corresponding to (1) in Section 4, will form a Nash equilibrium where:
![]()
With ![]() , we get the possibility of multiple Pareto-ranked, tax-evasion equilibria, since the reaction functions for evasion slope upwards.
, we get the possibility of multiple Pareto-ranked, tax-evasion equilibria, since the reaction functions for evasion slope upwards.
This opens the door for tax culture to affect compliance. Countries with a strong culture of compliance may find it much cheaper to achieve a similar level of fiscal capacity compared to one where the norm is unfavorable. Such issues have been discussed by political scientists, e.g., Levi (1998), Rothstein (2000), and Torgler (2007).
Obviously, the simple model considered here could be modified in different directions. For instance, there could be spillover effects between different tax bases, so that common cheating on some tax base spreads by contagion and erodes compliance with other taxes. Also, the relevant reference group for the social norm espoused by some particular individual may be more local than the entire set of tax payers. Local reference groups of this sort might help explain local pockets with widespread tax evasion, like the favelas at the outskirts of large Brazilian cities in which whole communities function largely outside the formal sector.
If tax morale is important, then interventions that increase the stigma from non-compliance may be an important form of intervention to improve compliance. It may even make sense to increase the visibility of compliers and to associate compliance with social approval—see Chetty, Mobarak, and Singhal (in press). But the real and fundamental question here, about which we know preciously little, is how legal and administrative interventions interact with social norms—see, however, Benabou and Tirole (2011) for a recent interesting theoretical analysis.
Our discussion of tax morale has been speculative and sketchy. But the issue is certainly important and it is plausible that different tax cultures in, say, Sweden and Greece contribute to the large differences in their tax take. The idea of tax morale also goes to the heart of debates about state legitimacy, a concept we have not dealt with at all. However, the interactions between social norms of compliance, state legitimacy, fiscal capacity, and institutions are an interesting and important topic for further research. There is, in particular, scope for more experimental interventions which can change behavior along the lines studied in Chetty et al. (in press).
Incentives for tax inspectors: In many countries, a major problem in collecting tax revenues is the weak motivation of tax inspectors. These could reflect either low incentives to detect tax evasion or a willingness to take bribes from non-compliers if caught. Our simple model allows us to think about both issues.
Suppose that detection of evasion requires that inspectors put in effort ![]() . Such effort increases the chances of catching a non-complier, but is privately costly to the tax inspector. Denote the probability that an evader is caught by
. Such effort increases the chances of catching a non-complier, but is privately costly to the tax inspector. Denote the probability that an evader is caught by ![]() with
with ![]() . For any given tax base and level of fiscal capacity, let equilibrium non-compliance be
. For any given tax base and level of fiscal capacity, let equilibrium non-compliance be
![]()
It is easy to see that ![]() is decreasing in
is decreasing in ![]() . Let
. Let ![]() now be the private profit per capita from non-compliance when tax inspectors put in effort
now be the private profit per capita from non-compliance when tax inspectors put in effort ![]() .
.
An important question, on which much tax administration has tripped up, is what motivates inspectors to put in such costly monitoring. A traditional view is that this is taken care of by some kind of pro-social motivation, i.e., inspectors are intrinsically honest. But as governments have learned to their cost, this cannot be taken for granted.
Assuming that inspectors have to be compensated for their disutility of labor in a competitive labor market, the socially optimal level of tax-raising effort is:
![]() (22)
(22)
where ![]() , as above, is the marginal value of public revenues. The maximand includes two terms—the private non-compliance profits and the value of tax revenues net of effort cost. Higher effort
, as above, is the marginal value of public revenues. The maximand includes two terms—the private non-compliance profits and the value of tax revenues net of effort cost. Higher effort ![]() will reduce the first term and increase the second term and the balance between the two will define the optimum.
will reduce the first term and increase the second term and the balance between the two will define the optimum.
The main question is how the government can implement such an optimal effort level. If ![]() is not observed, inspectors face a potential moral-hazard problem—see Mookherjee and Png (1995) and Besley and McLaren (1993) for studies along these lines. If the tax inspector were offered a fixed wage and is not strongly intrinsically motivated, he would set
is not observed, inspectors face a potential moral-hazard problem—see Mookherjee and Png (1995) and Besley and McLaren (1993) for studies along these lines. If the tax inspector were offered a fixed wage and is not strongly intrinsically motivated, he would set ![]() . In this case, there would be no point in employing inspectors at all. In this framework, we can think of changes in fiscal capacity as corresponding to alternative ways of organizing the tax-collection service to avoid this outcome.
. In this case, there would be no point in employing inspectors at all. In this framework, we can think of changes in fiscal capacity as corresponding to alternative ways of organizing the tax-collection service to avoid this outcome.
One regime would be to focus on recruiting tax inspectors who set ![]() by establishing some kind of rigorous recruiting and training regime. Such merit-based professionalization of the bureaucracy is certainly a feature of fiscal history.
by establishing some kind of rigorous recruiting and training regime. Such merit-based professionalization of the bureaucracy is certainly a feature of fiscal history.
Another possibility would be to contemplate tax farming, a popular solution in historic times where tax inspectors are sold a franchise to collect taxes on a particular tax base, in exchange for becoming a residual claimant. In this case, we would expect:
![]()
Comparing this to the expression in (22), we see that tax farming would never be optimal in our framework, for reasons that make sense given its somewhat checkered history. Specifically, tax farming would lead to too much effort in extracting taxes, as tax farmers would fail to internalize the utility costs they impose on the public. In practice, tax farmers would have tended to use brutal methods of collecting taxes, ignoring most of the costs to the populations from whom they were collecting.
Another option would be to pay tax inspectors efficiency wages, as discussed in Besley and McLaren (1993). To see how this might work, assume inspectors are themselves subject to inspection in a hierarchical structure. Suppose that inspectors are asked to put in effort ![]() and that the probability a tax inspector is monitored and caught is
and that the probability a tax inspector is monitored and caught is ![]() . Finally, assume that if inspectors are caught, they are fired without being paid. Now, an inspector will put in effort at a wage of
. Finally, assume that if inspectors are caught, they are fired without being paid. Now, an inspector will put in effort at a wage of ![]() if:
if:
![]()
Solving this inequality says that the wage needed to elicit effort ![]() is an increasing function:
is an increasing function:
![]()
Compared to a benchmark model with observable and contractible effort, getting effort is more expensive, meaning that the level of non-compliance will be higher for any ![]() . However, compared to a world which relies entirely on public spiritedness, or a world where
. However, compared to a world which relies entirely on public spiritedness, or a world where ![]() , this could be a worthwhile proposition.
, this could be a worthwhile proposition.
There is little work to date that has explored empirically how changing incentives for tax inspectors can change revenue collection. However, recent ongoing work by Khan, Khawaja, and Olken (2013) is exploring such issues using experimental interventions for wage and incentive schemes for property tax collectors in Pakistan. This is an area where there is future innovative work to be done.
Corrupt tax inspectors: Now consider how the possibility of corruption affects these arguments. Suppose for the moment that the level of effort put into detection is fixed. After detection, however, a bribe of ![]() can be paid by an evader to the inspector, which exempts the evader from suffering the punishment
can be paid by an evader to the inspector, which exempts the evader from suffering the punishment ![]() . Assume that the inspector and the evader engage in Nash bargaining, so that the bribe paid is:
. Assume that the inspector and the evader engage in Nash bargaining, so that the bribe paid is:
![]()
In this case, higher penalties for non-compliance are partly transferred to tax inspectors since they grant the ability to tax inspectors to extort money from non-complying taxpayers.
Somewhat paradoxically, bribery can motivate inspectors to put in greater detection effort since their payoff is:
![]()
Moreover, this effort is sensitive to tax rates, with greater taxes actually motivating tax inspectors to put in greater effort. This suggests the possibility that efforts to reduce bribery in a world with a great deal of unobserved effort need not necessarily increase tax compliance. This is not to say that bribery should be condoned, but that we need to consider the full set of incentives in a second-best world. Note also that if some component of fiscal capacity is independent of the incentive scheme for the inspectors’ own efforts (such as income tax withholding), then higher independent capacity raises equilibrium effort by complementing the inspector’s own efforts.
Exploiting local information: How far should local information be harnessed in improving tax compliance? Focusing on the formal inspection process underestimates the scope for schemes, which fall under the heading of “cross reporting”. This has become very important in the development literature on peer monitoring in micro-finance but has received less attention in the taxation literature. It has been brought to the fore in a recent paper by Kleven et al. (2009). Moreover, Kleven, Knudsen, Kreiner, Pedersen, and Saez (2011) show that, even in a country like Denmark with large fiscal capacity, income that is not reported using third-party enforcement is susceptible to underreporting.
The main idea exploits something well known in mechanism design, namely that once more than one person is informed about something then a variety of means can be used to illicit that information (see Maskin, 1999 and Moore & Repullo, 1988, among others). This has an obvious counterpart in taxation.
The following canonical model illustrates the idea. Suppose that evasion activity ![]() is observed by two parties—whom we can call a purchaser (denoted by a subscript
is observed by two parties—whom we can call a purchaser (denoted by a subscript ![]() ) and a vendor (denoted by a subscript
) and a vendor (denoted by a subscript ![]() ). Suppose that the vendor is asked first to declare
). Suppose that the vendor is asked first to declare ![]() and then the purchaser either agrees or disagrees. If there is disagreement, the government audits the transaction and the honest party is given a small reward and the dishonest party has to pay
and then the purchaser either agrees or disagrees. If there is disagreement, the government audits the transaction and the honest party is given a small reward and the dishonest party has to pay ![]() .
.
In the unique subgame perfect equilibrium of this game, there is full compliance as long as ![]() . In other words, it is as if there is complete and costless auditing of transactions—the gamble in the traditional Allingham and Sandmo (1972) model goes away. This simple “mechanism” is simply an illustration of the potential power of cross-reporting. However, it only works under two key assumptions. First, there is no scope for collusion between the vendor and purchaser. Second, both parties to a given transaction can be observed and verified. The latter is true when there exist formal contracts of employment or purchase, or where a receipt or record of the transaction is kept.
. In other words, it is as if there is complete and costless auditing of transactions—the gamble in the traditional Allingham and Sandmo (1972) model goes away. This simple “mechanism” is simply an illustration of the potential power of cross-reporting. However, it only works under two key assumptions. First, there is no scope for collusion between the vendor and purchaser. Second, both parties to a given transaction can be observed and verified. The latter is true when there exist formal contracts of employment or purchase, or where a receipt or record of the transaction is kept.
The evidence on informal taxation in Olken and Singhal (2011) suggests that traditional societies have developed ways of mutually raising revenues using local information and enforcement. In modern economies, firms have taken on this role as argued by Kleven et al. (2009).
Tax remittance by firms: Our model of compliance has focused exclusively on individual decisions. But in reality much of the onus for compliance is on firms and the gains from non-compliance accrue to firm owners.32 Substantively, this makes a difference when the size of the firm affects its non-compliance costs due to the visibility of its operations. It is straightforward to incorporate this feature into our model if we introduce some factor which affects the size distribution of firms. Consumers are assumed to face the same post-tax price but decisions not to comply are now only made at the firm level.
For simplicity, we focus only on commodity taxes and suppose that each industry comprises ![]() firms indexed by
firms indexed by ![]() . At each date, we suppose that firms service demands (expressed in per-capita terms) of
. At each date, we suppose that firms service demands (expressed in per-capita terms) of ![]() from consumers for good
from consumers for good ![]() at date
at date ![]() , where
, where ![]() , i.e., the firms exhaust the market. We further suppose that all firms have identical costs of production denoted by
, i.e., the firms exhaust the market. We further suppose that all firms have identical costs of production denoted by ![]() . Now let
. Now let ![]() be the firm’s cost of non-compliance which we denote by
be the firm’s cost of non-compliance which we denote by ![]() . We allow this cost to depend on the firm’s sales because this makes evasion more visible.
. We allow this cost to depend on the firm’s sales because this makes evasion more visible.
Now, a firm’s profits are:
![]()
This is the sum of profits from sales and profits from evasion. Such pure profits have to be distributed across citizens in proportion to their ownership of firms. If we assume competitive pricing, i.e., ![]() , then the only pure profits are from tax non-compliance. However, notice that nothing essential is changed from the basic model if we define:
, then the only pure profits are from tax non-compliance. However, notice that nothing essential is changed from the basic model if we define:
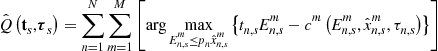
to be the total profits from evasion in firms. Note, however, that we have put the value of sales to be an upper bound on evasion, so firms cannot evade more tax than they could in principle collect from final consumers. It is clear that the size distribution of firms can now make a difference to compliance.33 A firm with small sales could find it worthwhile not to comply at all if
![]()
This condition would endogenously create informal-sector firms in our framework. If there are some large firms, these would tend to comply more with taxes as they are more visible to tax authorities. And we might even have firms who deliberately reduce their sales to a point they benefit from reduced compliance, in the spirit of Dharmapala, Slemrod, and Wilson (in press).
This extension shows why changes in the economy that make it optimal for firms to grow will also change the structure of compliance. For example, in an oligopoly model with ![]() firms producing a good
firms producing a good ![]() , firm 1 would normally decide to price a shade below the others and take the entire market. However, with endogenous tax compliance, it may prefer to divide the market with other firms in order to remain less visible.
, firm 1 would normally decide to price a shade below the others and take the entire market. However, with endogenous tax compliance, it may prefer to divide the market with other firms in order to remain less visible.
Firm-to-firm transactions provide a further interesting issue and are central to adoption of a VAT. This could be incorporated by supposing that some fraction of the cost ![]() is based on purchased inputs that carry a tax but which are deductible against taxation of final goods. This gives the firm an incentive to comply in order to claim back input taxation. It also increases the scope for cross-reporting as we discussed above. We could then suppose that the cost of evasion depends on the extent to which a firm is claiming a rebate on taxes on inputs which raises the marginal cost of non-compliance of taxation on final goods. The evidence from a clever field experiment, in cooperation with the Chilean tax administration reported in Pomeranz (2011), suggests that cross-reporting in the value-added chain indeed helps enforce payments of the VAT except when the majority of transactions do not have firms but consumers (who cannot deduct) on the other side. There is much that could be done using administrative and other kinds of data to further explore compliance with VAT at the firm level in developing countries.34
is based on purchased inputs that carry a tax but which are deductible against taxation of final goods. This gives the firm an incentive to comply in order to claim back input taxation. It also increases the scope for cross-reporting as we discussed above. We could then suppose that the cost of evasion depends on the extent to which a firm is claiming a rebate on taxes on inputs which raises the marginal cost of non-compliance of taxation on final goods. The evidence from a clever field experiment, in cooperation with the Chilean tax administration reported in Pomeranz (2011), suggests that cross-reporting in the value-added chain indeed helps enforce payments of the VAT except when the majority of transactions do not have firms but consumers (who cannot deduct) on the other side. There is much that could be done using administrative and other kinds of data to further explore compliance with VAT at the firm level in developing countries.34
More generally, and as argued by Gordon and Li (2009), when firms start to use formal financial markets, their costs of non-compliance rise and this increases the feasible array of tax bases. In the simple model above, suppose firms have to publish accounts to inform outside investors. When these accounts declare profits, ![]() , this is a useful piece of information to tax authorities who care about estimating
, this is a useful piece of information to tax authorities who care about estimating ![]() for tax purposes. It is a short step from this to having accountants serve as agents of revenue authorities, and to report data needed for VAT and income tax compliance. Of course, there would be difficulties in preventing collusion between firms and accountants. But it is clear that the need to raise external funds will put pressure to limit such collusion. This example further highlights how economic development may support compliance. But it also illustrates the complementarity between legal and fiscal capacity. Building legal structures to protect outside investors and to demand transparent dealings in financial markets creates positive spillover effects on fiscal-capacity building.
for tax purposes. It is a short step from this to having accountants serve as agents of revenue authorities, and to report data needed for VAT and income tax compliance. Of course, there would be difficulties in preventing collusion between firms and accountants. But it is clear that the need to raise external funds will put pressure to limit such collusion. This example further highlights how economic development may support compliance. But it also illustrates the complementarity between legal and fiscal capacity. Building legal structures to protect outside investors and to demand transparent dealings in financial markets creates positive spillover effects on fiscal-capacity building.
Summary: Many factors shape the costs of non-compliance with statutory taxes. A wider range of micro-studies should investigate these issues. Revenue authorities interested in reducing non-compliance have strong incentives to work with researchers to increase knowledge as means of improving policy. The nascent movement toward field experiments and data collection that we have mentioned is likely to become an important research field, which should eventually provide a better understanding of how to more effectively raise broad-based income taxes and the VAT.
6 Conclusion
As a state moves from collecting a low level of public revenue of around 10% of national income toward collecting around 40%, tax bases typically shift from trade taxes and excises toward labor income and other broad bases such as value added. To study this process is a challenge of appreciating incentives and constraints. Incentives are shaped by political institutions, existing power structures, and societal demands that the state perform certain functions. Constraints are imposed by a society’s economic environment, social cleavages, and political interests. Over time, these constraints can be shifted and governments play a key role for such shifts. They may invest to improve the working of the economy and the efficiency of public-goods provision. They may also try to create a sense of national identity and propose reforms to political institutions. Analyzing such issues requires a dynamic framework and this chapter has sketched an approach.
Throughout the chapter, we have taken political institutions as given. But it is questionable whether the forces that shape the development of the tax system can be separated from those that lead to institutional change. States that raise significant revenues will find themselves facing strong demands for accountability and representation, creating a two-way relationship between political development and the growth of the tax system. Little is yet known about this relationship. But it seems far from coincidental that states that are able to appropriate nearly half of national income in the form of taxation have also evolved strong political institutions, particularly those that constrain the use of such resources. This further underlines the close links between taxation and state development suggested long ago by Schumpeter, namely:
“The fiscal history of a people is above all an essential part of its general history. An enormous influence on the fate of nations emanates from the economic bleeding which the needs of the state necessitates, and from the use to which the results are put.”
(Joseph Schumpeter, The Crisis of the Tax State, 1918).
This quote underlines the importance of combining economic, political, and social factors when studying the development of tax systems at the macro level. The tools of modern political economics can augment traditional explanations, based on economic factors alone. This lesson is now widely accepted in development economics and has a wider resonance for public finance.
We have also stressed the gains that can be made by innovative micro-level studies of tax compliance in developing countries. Research based on collaboration between tax-collection authorities and academics is still in its infancy. But expanding this into new areas—particularly with policy experiments in the field—is an exciting agenda for the future.
For developing countries to support their citizens at a level now taken for granted by citizens in developed countries, they have to undertake a series of investments, making the state more effective and responsive. Discovering the preconditions for such investments and what works on the ground are central tasks for future research on taxation and development.
Acknowledgements
We are grateful to Mohammad Vesal for superb research assistance. We also thank Alan Auerbach, Roger Gordon, Anders Jensen, Henrik Kleven, Laszlo Sandor, Joel Slemrod, and participants at the Berkeley Conference in December 2011 for comments. Financial support from CIFAR, Martin Newson, the ESRC, the ERC and the Torsten and Ragnar Söderberg Foundation is gratefully acknowledged.
References
1. Acemoglu D. Modeling inefficient institutions. In: Blundell R, Newey W, Persson T, eds. Advances in economic theory and econometrics: Proceedings of the nineth world congress of the econometric society. Cambridge UK: Cambridge University Press; 2006.
2. Acemoglu D, Johnson S, Robinson JA. The colonial origins of comparative development: An empirical investigation. American Economic Review. 2001;91:1369–1401.
3. Aghion P, Alesina A, Trebbi F. Endogenous political institutions. Quarterly Journal of Economics. 2004;119:565–612.
4. Aidt TS, Jensen PS. The taxman tools up: An event history study of the introduction of the personal income tax. Journal of Public Economics. 2009a;93:160–175.
5. Aidt T, Jensen PS. Tax structure, size of government, and the extension of the voting franchise in Western Europe, 1860–1938. International Tax Public Finance. 2009b;16:362–394.
6. Aizenman J, Jinjarak Y. The collection efficiency of the value added tax: Theory and international evidence. Journal of International Trade and Economic Development. 2008;17:391–410.
7. Alesina A, Guiliano P. The power of the family. Journal of Economic Growth. 2010;15:93–125.
8. Alesina A, Tabellini G. A positive theory of fiscal deficits and government debt. Review of Economic Studies. 1990;57:403–414.
9. Alesina A, Baqir R, Easterly W. Public goods and ethnic divisions. Quarterly Journal of Economics. 1999;114:1243–1284.
10. Allingham MG, Sandmo A. Income tax evasion: A theoretical analysis. Journal of Public Economics. 1972;1:323–338.
11. Banerjee, A., & Duflo, E. (2009). The experimental approach to development economics. NBER working paper, No. 14467.
12. Barro RJ. Government spending in a simple model of endogeneous growth. Journal of Political Economy. 1990;98:103–125.
13. Barro RJ, Sala-i-Martin X. Public finance models of economic growth. Review of Economic Studies. 1992;59:645–661.
14. Baunsgaard T, Keen M. Tax revenue and (or?) trade liberalization. Mimeo: IMF; 2005.
15. Benabou, R., Tirole, J. (2011). Laws and norms. NBER working paper. No. 17579.
16. Besley T, Coate S. An economic model of representative democracy. Quarterly Journal of Economics. 1997;112:85–114.
17. Besley T, McLaren J. Taxes and bribery: The role of wage incentives. Economic Journal. 1993;103:119–141.
18. Besley T, Persson T. Repression or civil war? American Economic Review, Papers and Proceedings. 2009a;99:292–297.
19. Besley T, Persson T. The origins of state capacity: Property rights, taxation and politics. American Economic Review. 2009b;99:1218–1244.
20. Besley T, Persson T. State capacity, Conflict and development. Econometrica. 2010a;78:1–34.
21. Besley T, Persson T. From trade taxes to income taxes: Theory and evidence on economic development and state capacity. Mimeo: LSE; 2010b.
22. Besley T, Persson T. Fragile states and development policy. Journal of the European Economic Association. 2011a;9:371–398.
23. Besley T, Persson T. The logic of political violence. Quarterly Journal of Economics. 2011b;126:1411–1445.
24. Besley T, Persson T. Pillars of prosperity: The political economics of development clusters. Princeton: Princeton University Press; 2011c.
25. Besley, T., Ilzetzki, E., & Persson, T. (in press). Weak states, strong states and steady states: The dynamics of fiscal capacity. American Economic Journal: Macroeconomics.
26. Bird R. Administrative dimensions of tax reform. Asia-Pacific Tax Bulletin. 2004;10:134–150.
27. Bird R, Oldman O, eds. Readings on taxation in developing countries. 3rd ed. Baltimore: Johns Hopkins University Press; 1980.
28. Bonney R, ed. The rise of the fiscal state in Europe c1200–1815. Oxford: Oxford University Press; 1999.
29. Bräutigam D, Fjeldstad O-H, Moore M. Taxation and state-building in developing countries. Cambridge: Cambridge University Press; 2008.
30. Brewer J. The sinews of power: War, money and the english state, 1688–1783. New York: Knopf; 1989.
31. Burgess R, Stern N. Taxation and development. Journal of Economic Literature. 1993;31:762–830.
32. Cárdenas M. State capacity in Latin, America. Economáa. 2010;10:1–45.
33. Cárdenas M, Tuzemen D. Under-investment in state capacity: The role of inequality and political instability. Mimeo: The Brookings Institution; 2010.
34. Centeno MA. Blood and debt: War and taxation in Latin America. American Journal of Sociology. 1997;102:1565–1605.
35. Chetty R. Sufficient statistics for welfare analysis: A bridge between structural and reduced-form methods. Annual Review of Economics. 2009;1:451–488.
36. Chetty, R., Mobarak, M., & Singhal, M. (in press). Can social incentives and taxpayer recognition improve tax compliance? manuscript. See <http://faculty.som.yale.edu/mushfiqmobarak/Taxation.htm>.
37. Cukierman A, Edwards S, Tabellini G. Seignorage and political instability. American Economic Review. 1992;82:537–555.
38. Dharmapala, D., Slemrod, J., & Wilson, J.D. (in press). Tax policy and the missing middle: Optimal tax remittances with firm-level administrative costs. Journal of Public Economics.
39. Diamond P, Mirrlees J. Optimal taxation and public production: I production efficiency. American Economic Review. 1971;61:8–27.
40. Dincecco M. Political transformations and public finances: Europe, 1650–1913. Cambridge: Cambridge University Press; 2011.
41. Dincecco M, Prado Jr JM. Warfare, fiscal capacity, and performance. Mimeo: IMT Lucca Institute for Advanced Studies; 2010.
42. Duflo E, Glennerster R, Kremer M. Using randomization in development economics research: A toolkit. In: Amsterdam: Elsevier; 2007;Schultz TP, John AS, eds. Handbook of development economics. Vol. 4.
43. Engerman SL, Sokoloff KL. Factor endowments, inequality, and paths of development among new world economies. Economia. 2002;3:41–88.
44. Esping-Andersen G. Social foundation of post-industrial economies. Oxford: Oxford University Press; 1999.
45. Esteban J, Ray D. On the measurement of polarization. Econometrica. 1994;62:819–851.
46. Fearon J. Ethnic and cultural diversity by country. Journal of Economic Growth. 2003;8:195–222.
47. Feldman N, Slemrod J. War and taxation: When does patriotism overcome the free-rider impulse? In: Martin IW, Mehrotra AK, Prasad M, eds. The new fiscal sociology: Taxation in comparative and historical perspective. Cambridge: Cambridge University Press; 2009.
48. Feldstein M. Behavioral responses to tax rates: Evidence from the tax reform act of 1986. American Economic Review. 1995;85:170–174.
49. Feldstein M. Tax avoidance and the deadweight loss of the income tax. The Review of Economics and Statistics. 1999;81:674–680.
50. Gennaioli, N., & Voth, H.-J. (2011). State capacity and military conflict, working paper, UPF.
51. Gordon R, ed. Taxation in developing countries: Six case studies and policy implications. New York: Columbia University Press; 2010.
52. Gordon R, Lee Y. Tax structure and economic growth. Journal of Public Economics. 2005;89:1027–1043.
53. Gordon R, Li W. Tax structures in developing countries: Many puzzles and a possible explanation. Journal of Public Economics. 2009;93:855–866.
54. Hall R, Jones CO. Why do some countries produce so much more output per worker than others? Quarterly Journal of Economics. 1999;114:83–116.
55. Herbst JI. States and power in Africa: Comparative lessons in authority and control. Princeton, NJ: Princeton University Press; 2000.
56. Hinrichs HH. A general theory of tax structure change during economic development. Cambridge, MA: The Law School of Harvard University; 1966.
57. Hintze O. Military organization and the organization of the state. (1970) In: Gilbert F, ed. The historical essays of otto hintze. New York: Oxford University Press; 1906; [reprinted].
58. Hoffman P, Rosenthal J-L. Political economy of warfare and taxation in early modern Europe: Historical lessons for economic development. In: Drobak J, Nye J, eds. The frontiers of the new institutional economics. San Diego: Academic Press; 1997.
59. Jensen A. State-building in resource-rich economies. Atlantic Journal of Economics. 2011;39:171–193.
60. Kaldor N. Taxation for economic development. Journal of Modern African Studies. 1963;1:7–23.
61. Keen M. Taxation and development again. Mimeo: IMF; 2010.
62. Keen M, Lockwood B. The value added tax: Its causes and consequences. Journal of Development Economics. 2010;92:138–151.
63. Kenny L, Winer S. Tax systems in the world: An empirical investigation into the importance of tax bases, administrative costs, scale and political regime. International Tax and Public Finance. 2006;13:181–215.
64. Khan, A., Khawaja, A., & Olken, B. (2013). Property tax experiment in Punjab, Pakistan: Testing the role of wages, incentives and audit on tax inspectors’ behaviour. Details at <http://www.theigc.org/publications/igc-project/property-tax-experiment-punjab>.
65. Kleven, H., &, Mazhar, W. (in press). Tax notches in Pakistan: Tax evasion, real responses, and income shifting. Quarterly Journal of Economics.
66. Kleven, H. Kreiner, C.T., Saez, E., (2009). Why can modern governments tax so much? An agency model of firms as fiscal intermediaries. NBER working paper, No. 15218.
67. Kleven H, Knudsen M, Kreiner CT, Pedersen S, Saez E. Unwilling or unable to cheat? Evidence from a tax audit experiment in Denmark. Econometrica. 2011;79:651–692.
68. Kopczuk W, Slemrod J. The optimal elasticity of taxable income. Journal of Public Economics. 2002;84(1):91–112.
69. Kopczuk W, Slemrod J. Putting firms into optimal tax theory. American Economic Review (Papers and Proceedings). 2006;96(2):130–134.
70. Levi M. Of rule and revenue. Berkeley: University of California Press; 1988.
71. Levi M. A state of trust. In: Braithwaite V, Levi M, eds. Trust & Governance. New York: Russell Sage Foundation; 1998.
72. Madisson A. The world economy: A millennial perspective. Paris: Organisation for Economic Co-operation and Development; 2001.
73. Marshall MG, Jaggers K. Polity IV project: Political regime characteristics and transitions. College Park, MD: Center for Systemic Peace; 2010; [Computer File].
74. Maskin E. Nash equilibrium and welfare optimality. Review of Economic Studies. 1999;66:23–38.
75. Meltzer A, Richards S. A rational theory of the size of government. Journal of Political Economy. 1981;89:914–927.
76. Migdal JS. Strong societies and weak states: State-society relations and state capabilities in the third world. Princeton NJ: Princeton University Press; 1988.
77. Mitchell BR. International historical statistics: Africa, Asia, and Oceania, 1750–2005. Palgrave Macmillan 2007a.
78. Mitchell BR. International historical statistics: The americas, 1750–2005. Palgrave Macmillan 2007b.
79. Mitchell BR. International historical statistics: Europe, 1750–2005. Palgrave Macmillan 2007c.
80. Mookherjee D, Png I. Corruptible law enforcers: How should they be compensated? Economic Journal. 1995;105:145–159.
81. Moore J, Repullo R. Subgame perfect implementation. Econometrica. 1988;56:1191–1220.
82. Newbery D, Stern N, eds. The theory of taxation for developing countries. Oxford: Oxford University Press for the World Bank; 1987.
83. O’Brien P. Fiscal exceptionalism: Great Britain and its European rivals from civil war to triumph at trafalgar and waterloo. Mimeo 2001; In: http://www2.lse.ac.uk/economicHistory/pdf/WP6501.pdf; 2001.
84. O’Brien P. Fiscal and financial preconditions for the rise of British naval hegemony: 1485–1815. Mimeo: London School of Economics; 2005.
85. Olken BA, Singhal M. Informal taxation. American Economic Journal: Applied Economics. 2011;3:1–28.
86. Osborne MJ, Slivinsky A. A model of political competition with citizen-candidates. Quarterly Journal of Economics. 1996;111:65–96.
87. Persson T, Svensson LEO. Why a stubborn conservative would run a deficit: Policy with time-inconsistent preferences. Quarterly Journal of Economics. 1989;104:325–345.
88. Persson T, Tabellini G. Political economics: Explaining economic policy. Cambridge, MA: MIT Press; 2000.
89. Persson T, Tabellini G. Political economics and public finance. In: Amsterdam: Elsevier; 2002;Auerbach A, Feldstein M, eds. Handbook of public economics. Vol. 3.
90. Persson T, Tabellini G. The economic effects of constitutions. Cambridge MA: MIT Press; 2003.
91. Persson T, Roland G, Tabellini G. Comparative politics and public finance. Journal of Political Economy. 2000;108:1121–1161.
92. Piketty T, Qian N. Income inequality and progressive income taxation in China and India, 1986–2015. American Economic Journal: Applied Economics. 2009;1:53–63.
93. Piketty, T., Saez, E., & Stantcheva, S. (2011). Optimal taxation of top labor incomes: A tale of three elasticities. NBER working paper, No. 17616.
94. Pomeranz D. No taxation without information: Deterrence and self-enforcement in the value added tax. Mimeo: Department of Economics: Harvard University; 2011.
95. Reinikka, R., & Svensson, J. (2008). Working for god? Evaluating service delivery of religious not-for-profit health care providers in Uganda. Policy research working paper, WPS3058. World Bank.
96. Roberts K. Voting over income tax schedules. Journal of Public Economics. 1977;8:329–340.
97. Romer T. Individual welfare, majority voting, and the properties of a linear income tax. Journal of Public Economics. 1975;4:163–185.
98. Rothstein B. Trust, social dilemmas and collective memories. Journal of Theoretical Politics. 2000;12:477–501.
99. Saez, E., Slemrod, J., & Giertz, S.H. (2009). The elasticity of taxable income with respect to marginal tax rates: A critical review. NBER working paper, No. 15012.
100. Schneider F. Size and measurement of the informal economy in 110 countries around the world. Mimeo 2002.
101. Schumpeter JA. The crisis of the tax state. International Economic Papers. 1918;4:5–38.
102. Shayo M. A model of social identity with an application to political economy: Nation, class, and redistribution. American Political Science Review. 2009;103:147–174.
103. Slemrod J. Optimal taxation and optimal tax systems. Journal of Economic Perspectives. 1990;4(1):157–178.
104. Slemrod J. A general model of the behavioral response to taxation. International Tax and Public Finance. 2001;8:119–128.
105. Slemrod J, Yitzhaki S. Tax avoidance, evasion, and administration. In: Amsterdam: Elsevier; 2002;Auerbach A, Feldstein M, eds. Handbook of public economics. Vol. 3.
106. Tanzi V. Quantitative characteristics of the tax systems of developing countries. In: Newbery D, Stern N, eds. The theory of taxation for developing countries. Oxford: Oxford University Press for the World Bank; 1987.
107. Tanzi V. Structural factors and tax revenue in developing countries: A decade of evidence. In: Ian G, Winters LA, eds. Open economies: Structural adjustment and agriculture. Cambridge: Cambridge University Press; 1992.
108. Tilly C. Warmaking and state making as organized crime. In: Evans P, Rueschemeyer D, Skocpol T, eds. Bringing the state back. Cambridge: Cambridge University Press; 1985.
109. Tilly C. Coercion, capital and European states, AD 990–1992. Oxford: Blackwells; 1990.
110. Torgler B. Tax morale and tax compliance: A theoretical and empirical analysis. Cheltenham UK: Edward Elgar; 2007.
111. Zolt EM, Bird RM. Redistribution via taxation: The limited role of the personal income tax in developing countries. UCLA law review. 2005;52:1627–1695.
1See Slemrod (1990) for a related perspective which puts compliance at center stage.
2See, for example, Engerman and Sokoloff (2002), Hall and Jones (1999), Acemoglu, Johnson, and Robinson (2001).
3Of course, that is not to say that institutions are all that matter. Other long lived factors such as factor endowments, geography and culture, and the interplay between them, could also play an important role.
4See also Aizenman and Jinjarak (2008) on VAT and Zolt and Bird (2005) on the personal income tax.
5See also Bräutigam, Fjeldstad, and Moore (2008) for a perspective where politics is important.
6See Persson and Tabellini (2002, chap. 24, 2003) for previous overviews of relevant theoretical and empirical issues in the political economics of public finance and government spending.
7See Keen (2010), Kenny and Winer (2006), and Tanzi (1987, 1992) for general discussions of features of tax systems and their evolution.
8The countries in the sample are Argentina, Australia, Brazil, Canada, Chile, Colombia, Denmark, Finland, Ireland, Japan, Mexico, the Netherlands, New Zealand, Norway, Sweden, Switzerland, the United Kingdom, and the United States. The sample is selected, as we are reasonably confident that the data are comparable across countries and time in Mitchell (2007a,b,c).
9We have been unable to verify the dates in which income tax withholding was introduced in Finland, New Zealand, and Norway so this line represents the proportion of the 15 countries for which we have data. This explains why the dashed line lies above the solid line in the very early years of the data.
10Aidt and Jensen (2009a,b) study the factors, such as spending pressures and extensions of the franchise, behind the introduction of the income tax in panel data for 17 countries from 1815 to 1939.
11Other taxes not included in either trade or income taxes include indirect taxes such as VAT, property and corporate taxes.
12See Piketty, Saez, and Stantcheva (2011) and Saez, Slemrod, and Giertz (2009) for reviews of the research on taxable income elasticities.
13See Kopczuk and Slemrod (2002) for a related model, where governments can affect the elasticity of taxable income through decisions about the extent of compliance.
14We are modeling all costs of non-compliance as resource costs. If they represent fines paid to the government, they are purely a transfer cost. This difference matters when considering optimal taxation and determining which elasticities should be considered.
15We allow this to be targetable across groups. But clearly there are limits on this in many systems due to administrative costs. Although we do not consider it, the model/approach could also be used to consider investments which make it easier to target transfers to specific groups.
16One special case of the model is where
![]()
In this case ![]() otherwise evasion is complete and we essentially go back to the formulation of fiscal capacity in Besley and Persson (2009a,b) who model it as an upper bound on the feasible tax rate.
otherwise evasion is complete and we essentially go back to the formulation of fiscal capacity in Besley and Persson (2009a,b) who model it as an upper bound on the feasible tax rate.
17While we have formulated the model in terms of household decisions not to comply with taxes, it should now be clear that we could have formulated this as a series of firm-level decisions, where consumers pay their taxes faithfully and firms decide whether to remit taxes to tax authorities. Profits of non-compliance would still appear as individual income for owners of firms. Our key assumption is that these non-compliance profits are distributed equally across the population with each individual getting his own per capita share. But it would be straightforward to generalize the model to allow for any sharing rule for these profits.
18We are grateful to Anders Jensen for this observation. He also pointed out that in the case where all of the non-compliance cost is a transfer, due to fines being paid, the equivalent of (5) becomes
![]()
Now, the sufficient statistic for behavioral responses is the elasticity of labor supply with respect to taxes. More generally, when there is a mixture of transfer costs and resource costs, this sufficient statistic obeys a weighted-average formula between ![]() and
and ![]() .
.
19To see this, observe that this expression can be written as:
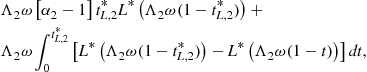
where the first term is positive and the second term is negative if there is any labor supply response to taxation. To a first-order approximation this is
![]()
20Similar spillovers arise when, as in many countries, receiving certain transfer benefits—e.g., social security—are linked to paying taxes and working in the formal sector.
21Here, we abstract away from corruption and within-group agency problems, which are introduced below.
22See Besley, Ilzetzki, and Persson (2011c, chap. 2) and Besley, Ilzetzki, and Persson (in press).
23The upward sloping relationship is also found if we control for GDP per capita in addition to the specified controls.
24Cárdenas and Tuzemen (2010) use a similar model, allowing for income inequality between two groups, called Elites and Citizens. When the (richer) Elites are in power, in the presence of political instability, both income and political inequality lead to lower investment in state capacity. Conversely, if the (poorer) Citizens rule, high political and income inequality result in higher state capacity.
25See Esteban and Ray (1994) for a discussion of how to measure polarization.
26A more involved case would explicitly introduce different types of public goods, with different groups having a preference bias toward certain types, as in Alesina and Tabellini (1990).
27The ethnic fractionalization measure is from Fearon (2003).
28This negative relationship is also found if we control for GDP per capita in addition to the specified controls.
29An upward sloping line is also found if we additionally control for GDP per capita.
30The controls are the same as for Figure 18.
31It would be straightforward to allow ![]() to depend on
to depend on ![]() so that larger transgressions are more likely to be detected.
so that larger transgressions are more likely to be detected.
32See Kopczuk and Slemrod (2006) for discussion of these issues in general.
33To give this a proper micro-foundation, we would have to underpin the reasons why some firms are larger or smaller than others for a homogeneous good. Very small elements of product differentiation such as location would be an example.
34For further discussion, see Keen and Lockwood (2010).