Chapter 14: Advanced Techniques
In this chapter, we will introduce some advanced tools and techniques. We will introduce enhancement packages, which is the new delivery model that SAP will follow from ECC 6.0 onward. We will also discuss the new switch framework.
In the next part of this chapter, we will discuss some important tools for reporting and the mass changing of data and documents.
We will also touch upon the options available to customize SAP programs such as user exits, SAP enhancements, and business add-ins (BAdIs).
Some of these concepts are vast and beyond the scope of the regular work of an SD expert. You will require help from other technical experts, such as the Basis and ABAP teams to implement some of the tools and techniques covered here. This chapter is meant only to provide an introduction to these concepts and will not serve as an implementation guide.
After the release of ECC 6.0, SAP changed its software delivery strategy for rolling out further innovations. In the earlier model, new enhancements were delivered only when a new version of SAP was launched. For example, version 4.6C had new features not included in 4.0B. However, it required a system upgrade before you could use the new innovations.
This process has been simplified from ECC 6.0 onward. You can easily add the new features to SAP ERP 6.0 in small bundles or packages, called enhancement packages. These are delivered by SAP more frequently and can be adopted with little disruption.
We’ll discuss the changes that you need to know as an SD expert to implement these innovations from ECC 6.0 onward. However, our objective is not to explain each functionality and how to implement it. There are too many to do that, and they’re updated frequently. Rather, we will focus on the fundamentals of enhancement packages so that you can continue to explore and adapt to these new innovations from SAP.
Introduction to Enhancement Packages
Enhancement packages are software innovations that overlay new or enhanced functionality and new processes on SAP ERP 6.0. They offer the flexibility to selectively install new software components that are relevant to you. Further, the installed components remain dormant in the system, without affecting the existing functionality until you activate them. In other words, installation and activation can be done at different points in time, as per your convenience. The differentiating feature is a new switch framework that controls the activation. Once the new functionality is “switched on,” you can carry out the configuration steps to set up the new feature.
From an SD functional expert’s point of view, the new switch framework is a critical step that you need to know before you can work with enhancement packages. We will discuss it later in this chapter.
The following terms are important to understand:
Business functions The new innovations are grouped together into small bundles called business functions. They represent the smallest switchable unit; that is, they can be activated as a unit. Before installation, you have to study the features of the business function and its relevance to your business processes. If you decide to go ahead, you have to then install the technical usage required for the business functions.
Technical usages The business functions require software components that must be installed together. Some of the business functions may require Java components, portal content, and so on, besides ABAP software components. These components are bundled together as technical usages.
On the SAP Service Marketplace website, you’ll find notes for mapping business functions to the corresponding technical usages. OSS note 1083576 is one such note, explaining the software components for enhancement package 3 (EhP 3). You will have to look up OSS note for the latest version of enhancement packages in circulation.
Implementation Process
SAP delivers the enhancement packages at regular intervals. At the time of writing this book, the fourth set of enhancement packages (commonly called EhP4 or 604) has already been released. The packages are cumulative in nature. That is, EhP4 has all the features of the previous packages plus some additional new features. Also note that the enhancement packages are different from the support packages that SAP releases at regular intervals. Support packages deliver corrections and legally mandatory changes to existing programs. Enhancement packages deliver innovations and process improvement features.
The process of implementing a new business function can be broken down into four steps: identification, installation, activation, and configuration (Figure 14-1).
Figure 14-1: Enhancement package Implementation process
Identification In this stage, you will study the documentation about the new features offered in the latest enhancement package and determine what is relevant and useful to your business process. You will work with experts from other functional applications and the Netweaver team to compile a list of all the business functions and the corresponding technical usages that are required for your organization.
Installation In this stage, you will schedule the download of the required enhancement package. It is recommended that this activity is done when you periodically apply support packages, which is a regular maintenance activity. This saves additional efforts in installation. This activity is carried out by the Basis and technical teams; hence, your participation at this stage is little. The new software components remain dormant in the system. Therefore, there is no impact on the regular business processes.
Activation Since activation is separate from installation, you can choose the right time to implement the new business functions. At this time, you will use the switch framework to activate the business functions. (We will discuss this later in the chapter.) Once activated, the changes take effect; that is, you may notice changes to screens, transactions, and nodes in the Implementation menu and Easy Access menu. Activation cannot be reversed.
TIP Remember that the installation and activation of enhancement packages is irreversible. It is advisable to install the enhancement in a sandbox client and check the functionality before installing it in the regular SAP system.
Configuration After activation, you may be required to configure the new business function and carry out settings in the Customizing menu (IMG), as per the instructions in the documentation. From here on, you will follow the regular change management process to configure changes, test, document, and transport to the production environment.
Switch Framework
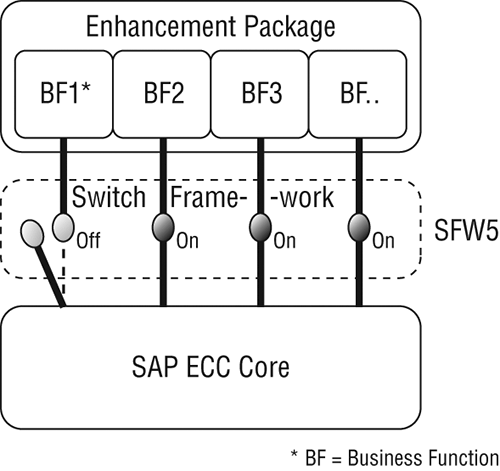
The switch framework is used to control the activation of business functions that are delivered in an enhancement package. Figure 14-2 shows a conceptual model of how this works. An enhancement package delivers several business functions. You can individually activate a business function using the switch. Once activated, you will notice the changes caused by the new functionality, such as changes to screens, new transactions, or the addition of new nodes in the IMG menu.
Figure 14-2: Switch framework model
You can access the switch framework from the menu path IMG Activate Business Functions (SFW5).
The switch framework will display a list of business functions, as shown in Figure 14-3.
Figure 14-3: Switch framework: Change Business Function Status screen
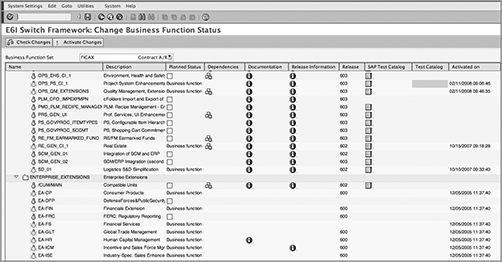
Name and Description Each row contains name and a description of the business function.
Dependencies This feature lists the dependencies between business functions. For example, if the business function requires the activation of any other business functions, they would be listed here. It helps guide you in the implementation process.
Documentation and Release Information If you need more information about a business function, choose the Documentation and Release Information icons. These links lead you to all the details about each function, including the prerequisites, new features, and benefits. Make sure that you have studied them thoroughly before activation.
Release This specifies the release number or the enhancement package number where this feature was first delivered. Note that enhancement package releases are denoted as 602 (for EhP2) , 603 (for EhP3), and so on.
SAP Test Catalog Along with the new business function, there is a SAP Test Catalog. It is a set of predefined test scripts from SAP to help you test the impact of the activation.
Activated On This shows the date and time on which the business function was activated.
Impact Analyzer If you right-click the name of a business function, you will find a new menu with a feature called Impact Analyzer. This tool helps you assess the impact of the new functionality. It will list the transaction codes, the user profiles, and the user IDs that will be impacted by the change. This can help you plan change management, testing, and training that will be required before you can activate the change in your production environment.
For example, Logistics S&D Simplification (SD_01) is an important business function. The release information tells you that it was delivered with enhancement package 2 (602). The documentation about SD_01 informs you that this feature will deliver the business packages for the implementation of Internal Sales Representative roles on the portal, for enhanced material search and material view in sales order processing, for integrating the search engine (TREX), and for a new business add-in for credit cards.
To activate a business function, select the row, and click Activate Changes.
WARNING Always remember that activation is irreversible.
Important Tools and Techniques
In the following sections, we will discuss some of the important tools and techniques that are available in SAP. You can use them to meet specific requirements such as communicating with other partners and systems, reporting, mass updating, and carrying out custom enhancements to SAP.
QuickViewer
QuickViewer is a simple tool to design custom reports without the need for any programming. You can use it to design and run QuickViews (reports designed using QuickViewer) and export them to spreadsheets. Note that these reports are user-specific and cannot be shared with other users.
Before you start, identify the following:
- The fields required in your report
- The selection screen and criteria on which you will run the report
- The source of data fields, in other words, the database tables where the data is stored
- The key fields linking the tables together, in case the data is scattered over multiple tables
- The layout of the report and arrangement of fields
To access this tool, the path is SAP Menu Tools ABAP Workbench Utilities QuickViewer (SQVI).
On the initial screen (Figure 14-4), you can edit or execute a QuickView that you may have created earlier, or create a new one.
Figure 14-4: QuickViewer: Initial Screen
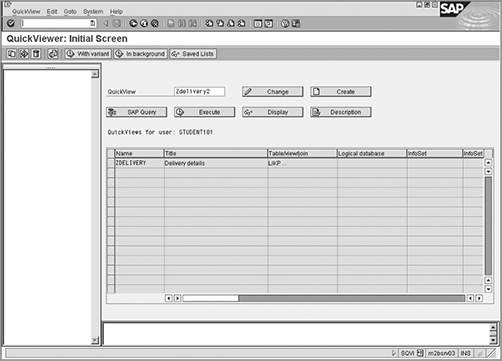
To create a new QuickView, start with a meaningful name for your report, and click the Create option. A pop-up Choose Data Source box appears, as shown in Figure 14-5. Enter a report title and comments if any.
Figure 14-5: Creating a QuickView
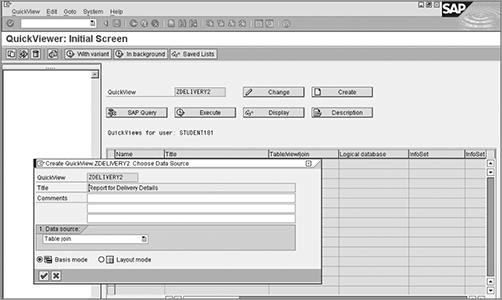
As an example, we’ll show you how to set up a QuickView to display delivery-related information. The major tables that you will use in the example are LIKP and LIPS.
In the Choose Data Source box, select an option for a data source. You can choose a single table or a join of more than one table. As we said, for this example, use the join of two tables, LIKP and LIPS.
If it were a single table, you could choose the table name in the Table/View field. When you opt for a table join, you can enter the table names in a subsequent screen (we will come to that soon).
Next is the choice between Basis and Layout modes. Choose Basis mode if you want your report design in a standard format. However, if you want to design a custom layout for the report, choose Layout mode. We will explain both the modes as we go along. For now, select Basis mode.
On the next screen, you have to add the tables. As shown in Figure 14-6, select Edit Insert Table for each table that you have to add to the QuickView. The system automatically proposes the key fields linking the tables. You can check and confirm (or override) the proposed keys using the Join Condition button.
Figure 14-6: Inserting tables in the QuickView

As shown in Figure 14-7, the key joining LIKP and LIPS is the delivery number (VBELN). It is denoted by a line joining the VBELN fields in both tables.
After maintaining this setting, hit the back arrow navigation key. This leads you to the screen shown in Figure 14-8. The left window contains a list of all the fields available in the joined tables. The window to the right has the same information in a different presentation format. You can use either window to select the fields that you require in the report and on the selection screen.
Figure 14-7: Basis mode, displaying the table join
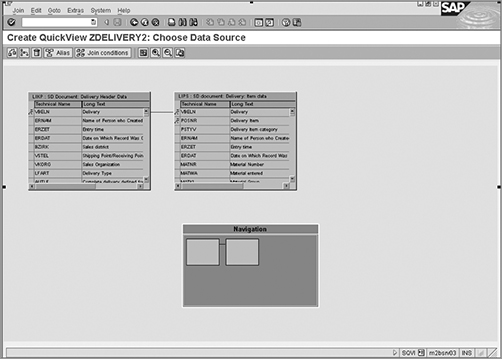
Figure 14-8: Field selection
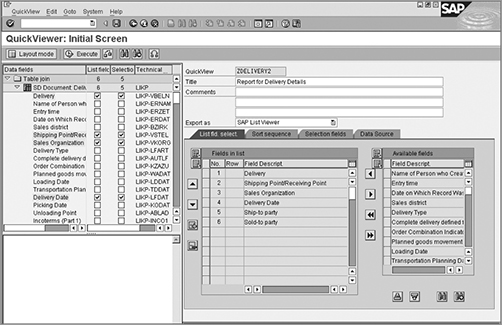
We will use the left window for this example. Here, you’ll see two sets of check boxes provided next to each field, one for list display and the other for selection screen display. Select the fields based on your reporting requirements.
TIP While you are selecting the fields that you’ll need in your report, make sure you are choosing the correct fields by verifying the field names. It is always helpful to have another session with SE16 open. Display records from the tables you have selected, and verify the field names that you are going to use.
At this stage, if you want to customize the layout of your report and the placement of fields, you can switch to the Layout mode using the button in the top row. Customizing the layout is an optional step.
Figure 14-9 shows the layout mode. You can drag and drop fields to their required positions and customize the layout. You can also change the name of the field as it appears in the header columns and add header and footer text.
Figure 14-9: Layout mode

At any stage, you can execute the report. Check whether the fields appearing on the selection screen are as per your requirements. You can always go back using the Change mode and make corrections.
Figure 14-10 shows the QuickView report. It extracts information from the joined tables and displays the records as per the selection criteria. The next time you go back to SQVI, you will find this new report added to your list.
Figure 14-10: Result of QuickView execution
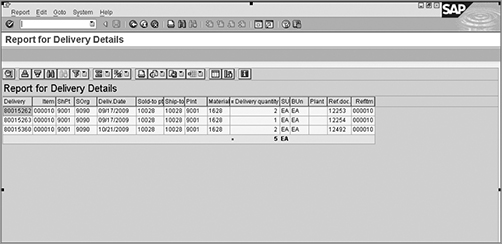
SAP Query
SAP Query is another tool to create reports without any programming. Query has more features than QuickView. The main advantage is that a query can be shared with a group of users.
Setting up SAP Query is a three-step process:
1. Create an InfoSet. This process is similar to the QuickView setup discussed earlier. Create an InfoSet by choosing the source tables.
2. Set up a groups of users who will be authorized to use the InfoSets. You assign user IDs to each group and specify the list of InfoSets that the group can use.
3. Design queries using the fields in the InfoSets.
For example, say Galaxy Musical Instruments needs a report with information about billing documents. We will show how to extract data from tables VBRK and VBRP. Specifically, you will learn how to set up a user group for the billing department so that only this group can use the InfoSet. Then you will learn how to design a query using the InfoSet.
Create an InfoSet
The first step is to create an InfoSet. Follow the path SAP Menu Tools ABAP Workbench Utilities SAP Query InfoSets (SQ02).
On the InfoSet: Initial Screen screen, shown in Figure 14-11, enter a suitable name. Choose a data source. Based on your requirement, choose either Table Join Using Basis Table, Direct Read Of Table, or Logical Database as a source.
Figure 14-11: InfoSet: Initial Screen
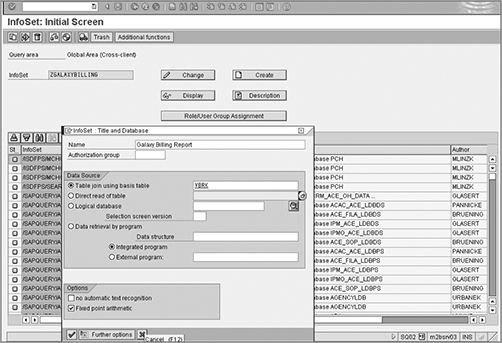
In the example, the InfoSet ZGALAXYBILLING is being created. In the Data Source fields, select the Table Join Using Basis Table option and specify the first table VBRK as the source of data. The next screen, which is identical to Figure 14-7, is where you can add the other tables.
After adding all the tables and checking the join conditions, you can save the InfoSet.
Upon saving, you will see a Field Group Defaults dialog box (Figure 14-12). Always choose the Create Empty Field Groups option.
Figure 14-12: Field group defaults
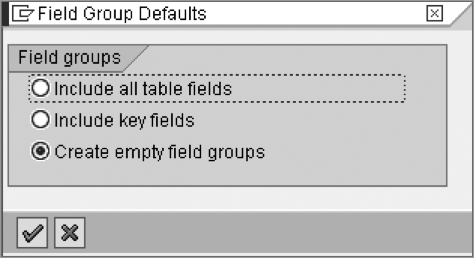
As a result, on the next screen (Figure 14-13), there are empty field groups created, as shown in the top-right window. In this case, there are two tables, and hence there are two empty groups. Now choose the fields from the tables VBRK and VBRP, and add them to the field groups. Thus, you filter only the required fields into the groups for further processing.
Figure 14-13: Selecting fields for the InfoSet
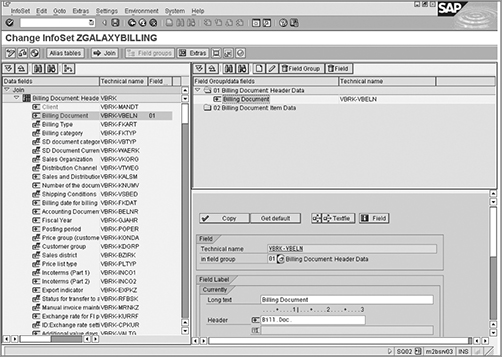
You can click the list of fields (on the left), and the attributes are displayed in the lower-right window.
You can drag and drop the field into the field groups on the right. Figure 14-13 shows that the first field (Document Number) has been added to the field group Billing Document: Header Data field. Similarly, you can proceed to add the other fields that you require in your InfoSet.
Save and generate the InfoSet once you have updated the field groups. You can choose to save it as a local object or a transport relevant object. If you plan to transport the query to other systems, you can choose the latter option.
Create a User Group
To create a user group, use the following menu path: SAP Menu Tools ABAP Workbench Utilities SAP Query User Groups (SQ03).
Select a name for the user group, and choose Create (Figure 14-14). You can save it as a local or a transport relevant object. We will set up a user group named Z_GALA_BILL for the Galaxy billing department.
Figure 14-14: User Group: Initial Screen
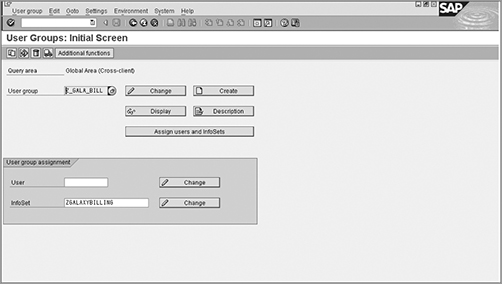
Next, on the initial screen, select the Assign Users And InfoSets option. You can assign the users to the newly created group. Figure 14-15 shows this assignment.
Figure 14-15: Assigning users to a user group
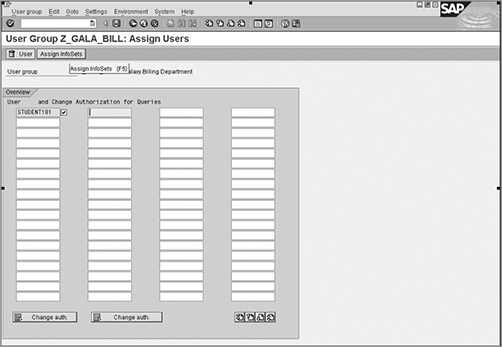
From the same screen, you can launch Assign InfoSets to add the list of InfoSets that this group is authorized to use. For this example, assign the InfoSet ZGALAXYBILLING to the user group Z_GALA_BILL.
Create a Query
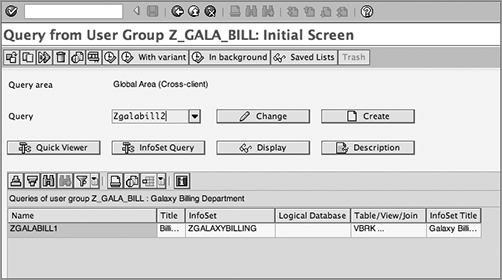
For this example, you have defined InfoSet and assigned it to a user group. Now you can create a query to generate a report you require. The menu path is as follows: SAP Menu Tools ABAP Workbench Utilities SAP Query Queries (SQ01).
You can use this transaction code either to execute any existing queries or to define a new one. To start with, select the user group to which you belong by clicking the Other User Group icon ![]() .
.
Based on the group you choose, the existing queries (if any) for this group will be displayed in the list. You can choose and execute these queries directly from the list.
For this example, start by creating a new query. Enter a name for the query, and click Create, as shown in Figure 14-16. A dialog box will allow you to choose the InfoSet you want to use for your query.
Figure 14-16: Creating a query
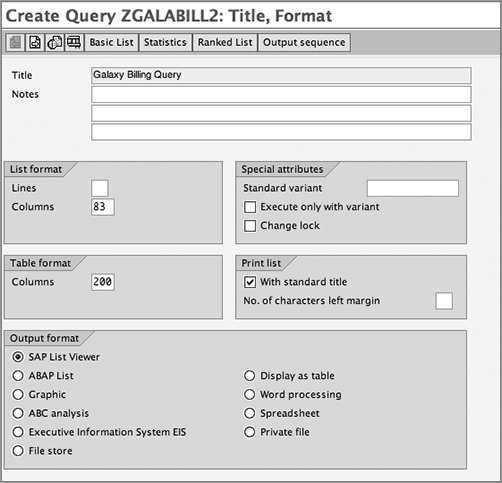
On the next screen, add a description (as shown in Figure 14-17), and specify the output display parameters.
Figure 14-17: Creating the query name and attributes
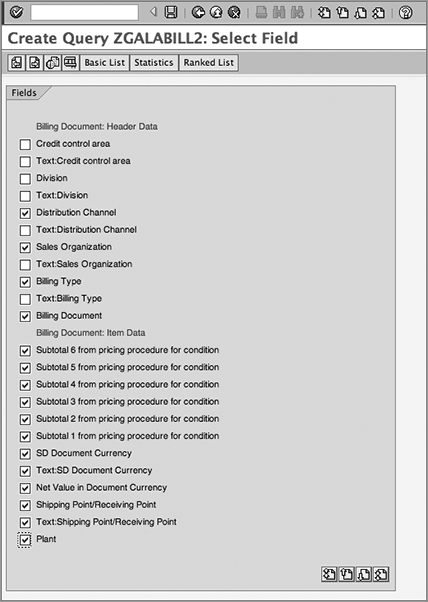
The Next icon on this screen will guide you through the other steps in query creation ![]() . Select the field groups and the fields that you plan to use in this specific query (Figure 14-18).
. Select the field groups and the fields that you plan to use in this specific query (Figure 14-18).
Figure 14-18: Selecting the field groups and fields
On the Selections screen (Figure 14-19), select the fields required as selection parameter for the query. You can arrange the selected fields in any order (by specifying the position number in the No column). The fields SV and 1Z allow you to further control the selection parameters. If you select the SV box next to a selection field, you cannot specify a range of values in the selection screen for that field (that is to say, the To Value box is suppressed). On the other hand, if you select the 1Z box, you cannot specify multiple values in the selection screen.
Figure 14-19: Choosing fields for selection screen
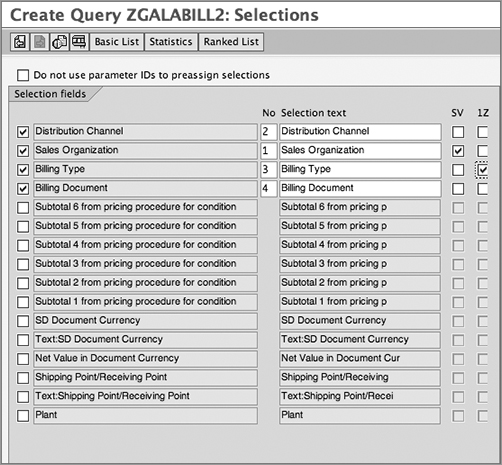
On the Selections screen, click the Basic List button to configure the layout of your report. This leads you to the Layout mode that we covered when discussing QuickView. You can select the layout of the fields on the screen and save the layout.
This completes the query setup. You can test the query using the Test option ![]() .
.
Note the selection screen shown in Figure 14-20. Since we’ve used the SV box for the Sales Organization field, we cannot specify a range here. Similarly, we used the 1Z option for the field Billing Type, so we can specify a range but cannot list multiple entries.
Figure 14-20: Selection screen for the query
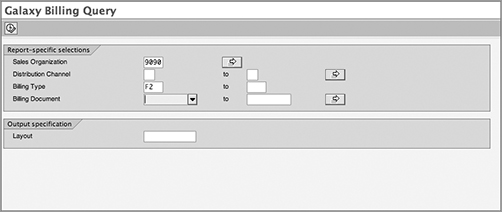
Enter the selection parameters, and execute the query. The system will search for database records that meet the criteria and display the results, as shown in Figure 14-21.
Figure 14-21: Query execution
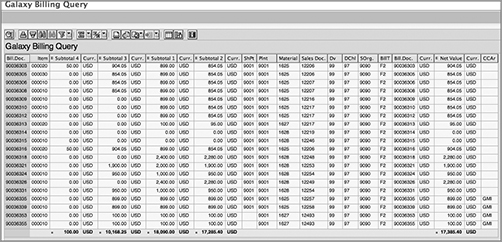
The next time you use SQ01, this new query will be added to the list of existing queries that are available to you for execution.
Mass Maintenance
Many organizations deal with a large volume of data. Mass changes to the master data (such as the customer or material master) or transaction data (such as the open sales orders) are often required. To facilitate mass changes, SAP has provided a cross-application mass maintenance tool. The user can choose the object to be changed (customer, vendor, and so on) and the fields that are to be updated. The changes are then carried out en masse, and the log is displayed to the user. This saves a lot of time and effort in carrying out mass changes.
You can access the tool by the transaction code MASS. The menu path is SAP Menu Logistics Central Functions Mass Maintenance Mass Maintenance Dialog Processing (MASS).
Use the Object Type field to specify the object that you want to change. As shown in Figure 14-22, there are numerous options such as Sales Orders (BUS2032), Customers (KNA1), and Materials (BUS1001).
Figure 14-22: Mass Maintenance screen, selecting the object type
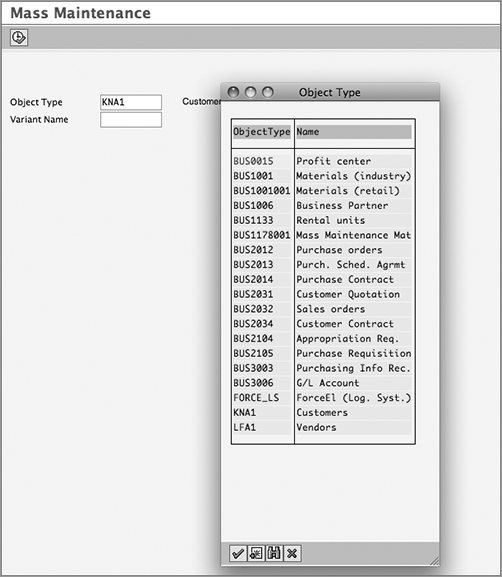
We’ll now show you an example of making a mass change to the customer master. Suppose Galaxy Musical Instruments decided to reorganize the grouping of customers. As a result of this change, all the customers belonging to group G1 are to be updated to group G3. We’ll show you how MASS functionality helps you make this change, and the steps to follow.
1. Launch the MASS transaction and enter KNA1 in the Object Type field. Execute the transaction.
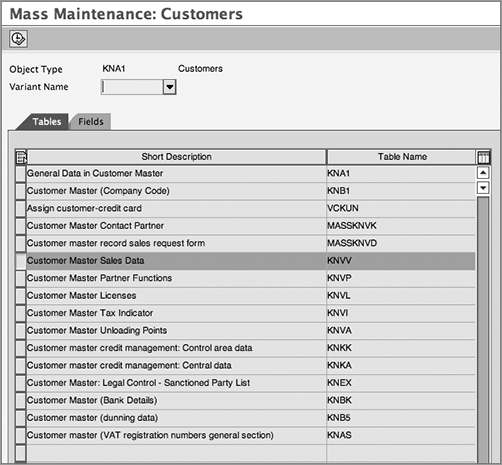
2. Next, select tables and fields. The screen will display the various tables and fields in which customer data is stored. As shown in Figure 14-23, there are two tabs. Go to the Tables tab. The customer group is stored in the KNVV table. Hence, select this table. Similarly, in the Fields tab, you can select all the fields that you would like to check or update. For your convenience, you can use the Find function to search for the required fields from the list. For this example, choose the Customer group field KNVV-KDGRP. While you are visiting KNVV, you can also verify some other fields such as price group, so add KNVV-KONDA to the list of fields, and execute the transaction.
Figure 14-23: Selecting tables and fields
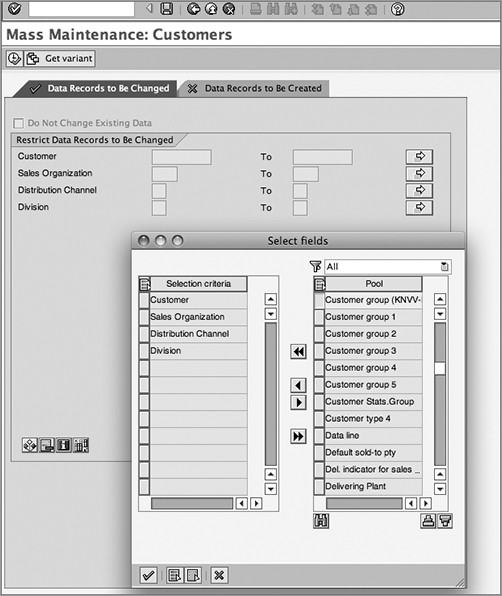
3. Next you select data records to be changed or created. Figure 14-24 shows the next screen. You can enter selection parameters to find records that are to be updated. There are two tabs here: one to change existing records and the other to create new records. We will proceed with the change option. The Choose Selection Fields option ![]() allows you to change the fields appearing on the selection screen. In this example, add the Customer group to the list.
allows you to change the fields appearing on the selection screen. In this example, add the Customer group to the list.
4. Enter the selection parameters, and execute this query. Records matching the selection criteria are listed in the report.
TIP If you plan to run this report again, you can save the selection screen as a variant. This way, you can call up the variant without having to customize the selection screen again.
Figure 14-24: Selecting tables and fields
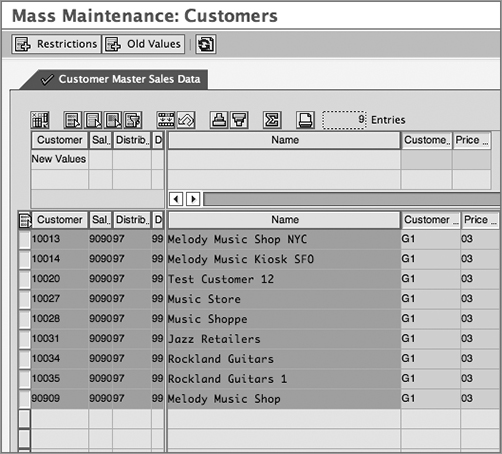
5. In the next step, you specify new values for each record. Figure 14-25 shows a list of master data records that are to be changed. The list allows you to overwrite the values to certain fields that you had chosen earlier (Customer Group and Price Group). Suppose you have to update all the customers to customer group G3. You can either overwrite G1 with G3 in each record or enter G3 in the header record (in the upper window) and click Carry Out A Mass Change ![]() . This copies the header value to all the selected records. The effort of manually entering a value in each record is thus saved.
. This copies the header value to all the selected records. The effort of manually entering a value in each record is thus saved.
Figure 14-25: Changing values in selected records
WARNING If you leave the header record blank and click Carry Out A Mass Change, the existing field value in all selected records will be wiped out (blanked).
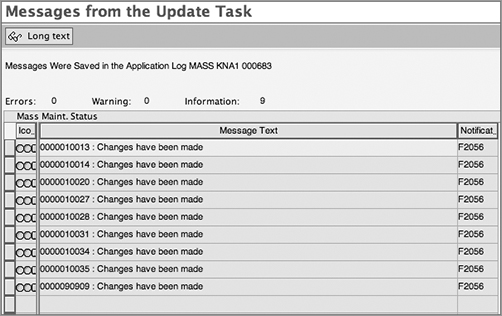
6. When you update the changed values and click Save, a warning message reminds you that a mass change is about to be done. After the update is carried out, a log file is displayed confirming the change (Figure 14-26).
Figure 14-26: Change log
In SAP, you can use transaction code VA05 to perform mass change of pricing, material number, plant and currency data in sales documents. You can also use MASS for the same purpose. Just select the object as BUS2032 for Sales Orders. This offers many more fields to choose from.
In our discussion about Figure 14-24, we noted that there are two tabs. We discussed the tab for changing records. We’ll now discuss the option of creating new records.
You can use MASS to generate new data records. An example is if you have created general data for a set of new customers and you want to create sales area data en masse. From the MASS transaction, choose the Data Records To Be Created tab (shown in Figure 14-27). On the lower part of this screen, there are fields to specify a reference customer record. By executing the transaction, the fields from the reference customer record will be copied into the new records being created.
Figure 14-27: Creating new records using MASS
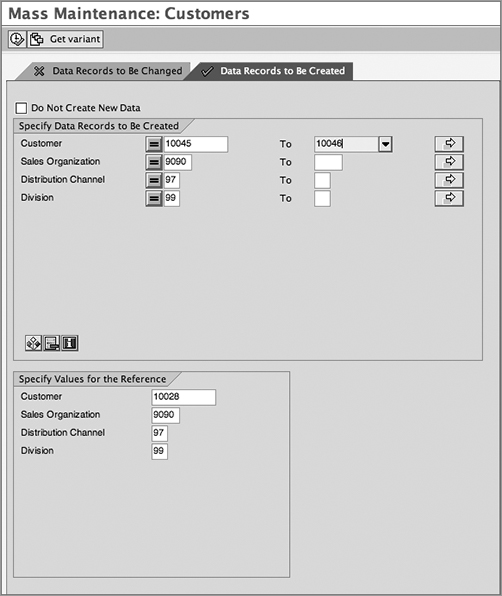
TIP MASS is a very powerful tool. Besides changing and creating records, it can also serve as a quick reporting tool. As shown in our example, you can customize the selection screen and the fields to be displayed in the report!
Logistics Information System
Logistics Information System (LIS) is a data warehouse solution provided by SAP. It consists of components for each logistics application such as sales, purchasing, inventory control, and so on. Sales Information System (SIS) is part of LIS that deals with sales-related data.
The purpose of Logistics Information System is to help generate key reports. To enable this, an information system first collects and aggregates transaction information into information structures. A typical structure consists of characteristics (that is, the basis on which data is to be aggregated, such as the sales organization, the distribution channel, the customer group), key figures (statistics such as the order quantity, the net value, and the gross value), and a period unit (a time element such as daily, weekly, or monthly). The value of the key figures are aggregated at a regular time interval specified by the period for each characteristic in the information structure. This enables you to generate analysis reports such as the total monthly (a period unit) order value (a key figure) by the sales organization (a characteristic).
The configuration of LIS is a vast topic that cannot be compressed into this chapter. The purpose of this discussion is to provide a basic understanding and to get you started with the standard information structures and standard analysis.
We’ll now discuss the steps in maintaining an information structure and setting up rules to control how it is updated with data.
Managing Information Structures
The first step is to define the information structures that you want to use in your system. You can choose from the standard structures created by SAP or define a custom information structure by following the path IMG Logistics - General Logistics Information Systems (LIS) Logistics Data Warehouse Data Basis Information Structures Maintain Self-Defined Information Structures.
From this node, you can create (MC21), change (MC22), or display (MC23) information structures. SAP delivers several standard information structures, such as the following:
- S001: Customer
- S002: Sales Office
- S003: Sales Organization
- S004: Material
- S005: Shipping Point
- S006: Sales Employee
- S020: Credit Management
Figure 14-28 shows the details of standard information structure S001. As you can see, it has characteristics such as the sold-to party and statistics such as incoming orders and open orders as key figures.
Figure 14-28: Info structure details
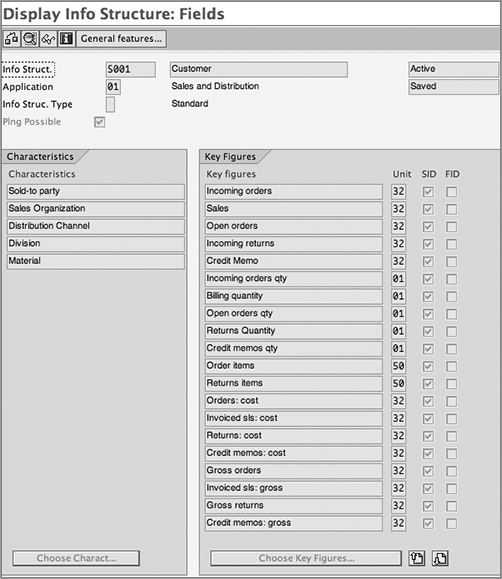
You can also define a custom information structure by choosing from a catalog of characteristics and key figures.
After selecting the information structure, you can control how the structures are updated with data flowing in from various sales transactions using statistics groups and update groups.
Statistics groups help in controlling which data elements (documents, item categories, materials, and customers) update the information structure. Update groups help in controlling when the updates should occur. Next we’ll cover the steps in setting up these groups.
Defining and Assigning Statistics Groups
Statistics groups are used to filter the data that is updated in the information structure. Sometimes you have to control the customers and materials that should be updated. Similarly, you may want to segregate sales document types and item categories (such as regular orders and return orders). Statistics groups help you in controlling the updates.
There are statistics groups for materials, customers, sales documents, and item categories. The statistics groups are freely definable. You can add new groups as per your requirements. Then assign the statistics groups to sales documents and item categories. Similarly, customer master and material master data have to be updated with the appropriate value in the statistics group field.
Configuring Statistics Groups
Table 14-1 shows the steps in creating and assigning a statistics group from the configuration menu.
Table 14-1: Statistics Group Settings
| Menu Path | Transaction Code | Action |
| IMG Logistics - General LIS Logistics Data Warehouse Updating Update Control Settings: Sales Statistics Group Maintain Stat Group For Customers | OVRA | Define customer statistics group. |
| IMG Logistics - General LIS Logistics Data Warehouse Updating Update Control Settings: Sales Statistics Group Maintain Stat Group For Materials | OVRF | Define material statistics group. |
| IMG Logistics - General LIS Logistics Data Warehouse Updating Update Control Settings: Sales Statistics Group Maintain Stat Group For Sales Documents | OVRN | Define statistics group for document type and item categories. |
| IMG Logistics - General LIS Logistics Data Warehouse Updating Update Control Settings: Sales Statistics Group Assign Stat Group For Each Sales Document Type | Select sales documents, and assign statistics group | |
| IMG Logistics - General LIS Logistics Data Warehouse Updating Update Control Settings: Sales Statistics Group Assign Stat Group For Each Sales Document Type Item | Select item categories, and assign statistics group. | |
| IMG Logistics - General LIS Logistics Data Warehouse Updating Update Control Settings: Sales Statistics Group Assign Stat Group For Each Delivery Type | Select delivery document type, and assign statistics group. | |
| IMG Logistics - General LIS Logistics Data Warehouse Updating Update Control Settings: Sales Statistics Group Assign Stat Group For Each Sales Delivery Type Item | Select delivery item category, and assign statistics group. | |
| IMG Logistics - General LIS Logistics Data Warehouse Updating Update Control Settings: Sales Statistics Group Determine Billing Document Types Relevant To Statistics | Select billing document types, and check the ones relevant for statistics. |
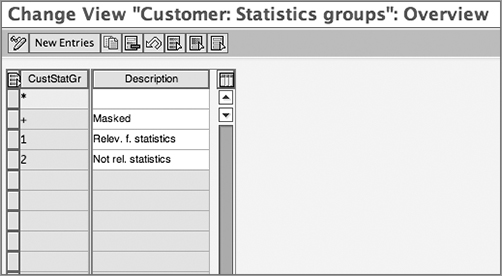
As a sample, Figure 14-29 shows the setup of statistics groups for customers using transaction OVRA. We will use the values defined here in the customer master data in the next step.
Figure 14-29: Maintaining customer statistics groups
Maintaining Statistics Groups in Master Data
Besides the customization setting, the master data also needs to be updated so that data flows to the information structures. You have defined the customer and material statistics group. You have to maintain these fields in the customer master and material master records, respectively.
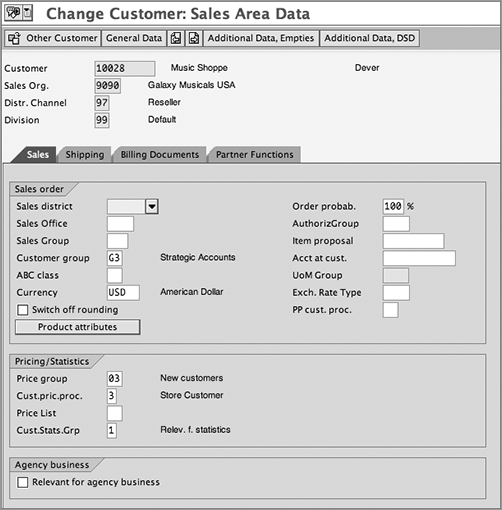
In the customer master, this field appears on the Sales tab in the Sales Area Data screen (Figure 14-30). Note that the values defined in Figure 14-29 are assigned here.
Figure 14-30: Customer statistics group field in customer master data
In the material master, this field appears in the Sales: Sales Org 2 view (Figure 14-31).
Figure 14-31: Material statistics group field in material master data
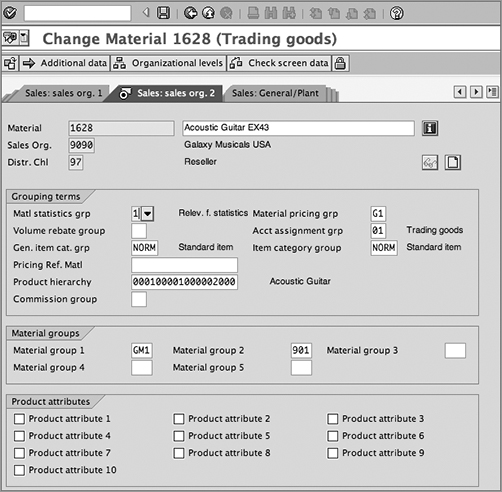
TIP . If you have already created customer and material master records in the system and you have to do a mass update for the statistics group field, try using the MASS function. Both the customer master (object KNA1) and the material master (BUS1001) are supported by the MASS transaction. The customer statistics group is the field KNVV-VERSG. The material statistics group is MVKE-VERSG.
Defining and Assigning Update Groups
You can use update groups to control the events that trigger the update of an information structure. Statistics groups are linked to update groups and control the updates. The following are the steps for maintaining update groups.
Defining Update Groups
To check the list of update groups, follow the path IMG Logistics - General Logistics Information Systems (LIS) Logistics Data Warehouse Updating Update Definition General Definition Using Update Groups Maintain Update Groups.
Update groups 1 and 2 are commonly used in SIS. Usually, you will not require more groups; however, there is a provision to set up new entries.
Maintaining Update Rules
You can use the update groups to define update rules. These rules control the events that are to be used to update the information structure. The path is IMG Logistics - General Logistics Information Systems (LIS) Logistics Data Warehouse Updating Update Definition Specific Definition Using Update Rules Maintain Update Rules (MC24).
Select the information structure and an update group. For this combination, maintain rules for updating each characteristic and key figure.
Figure 14-32 displays the rules for each key figure (using MC26, Display Transaction) in the standard information structure S001 with update group 1.
For each key figure, you can specify the event (EV), such as a sales order (VA) or a billing document (VD), that should trigger the update of the key figure. We’ll present an example so you can understand the importance of events. The information structure S001 has certain statistics such as the incoming order value that would come from sales order data. Others such as the gross invoice sales would be updated only when a billing document is created. You will specify different events to control these updates.
The updating type (U) specifies how the statistic is to be updated. You can choose from A (Cumulative Updating) to add the statistics (such as values), B (Data Transfer Only) to overwrite the value, and C (Counter) to keep a count of items.
The Unit field specifies the unit of measurement for the statistic. For example, you can measure a document value in terms of document currency or statistics currency. Quantity can be measured in base units or sales units.
You can also add a formula (Form) and requirement routines (Req.) to control the update of a key figure.
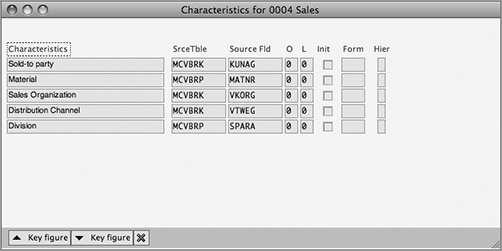
This completes the setup for key figures. To set up rules for characteristics, click the Rules For Characteristics button at the bottom of the screen. As shown in Figure 14-33, you can control the source table and fields for each characteristic.
Figure 14-32: Update rules for key figures
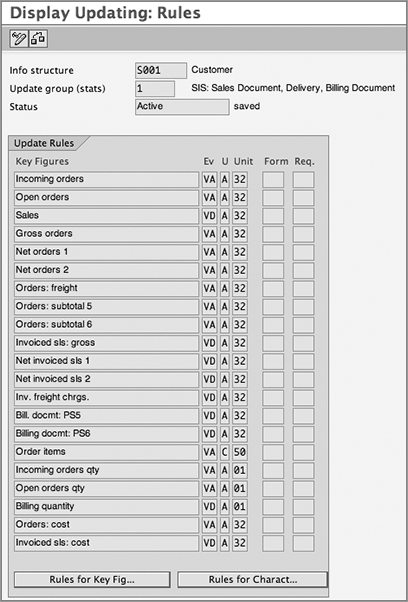
Figure 14-33: Update rules for characteristics
Assigning Update Groups
This step links together the statistics groups with the update groups. The menu path is IMG Logistics - General Logistics Information Systems (LIS) Logistics Data Warehouse Updating Update Control Settings: Sales Update Group Assign Update Group At Item Level (OVRP).
In this step, assign an update group for a combination of the following:
- Sales area
- Customer statistics group
- Material statistics group
- Sales document statistics group
- Sales document item statistics group
As shown in Figure 14-34, for the sales area (9090, 97, 99), update group 1 is assigned to sales documents. Update group 2 is attached to return documents.
Figure 14-34: Updating the group at the item level

Similarly, you have to assign the update group at a header level (Figure 14-35). The path is IMG Logistics - General Logistics Information Systems (LIS) Logistics Data Warehouse Updating Update Control Settings: Sales Update Group Assign Update Group At Header Level (OVRO).
In this step, assign an update group for a combination of header-level fields:
- Sales area
- Customer statistics group
- Sales document statistics group
With this setting, you have extended the update rules to the sales area and various statistics groups.
Figure 14-35: Updating the group at the header level

Activating Update
With this setting, you can control the frequency of updating the information structure and the period unit at which data is to be aggregated.
The menu path is as follows: IMG Logistics - General Logistics Information Systems (LIS) Logistics Data Warehouse Updating Update Control Activate Update.
Choose the application (such as Sales and Distribution). From the list, choose the information structure to be activated. Figure 14-36 shows the details screen for parameters.
Figure 14-36: Updating parameters
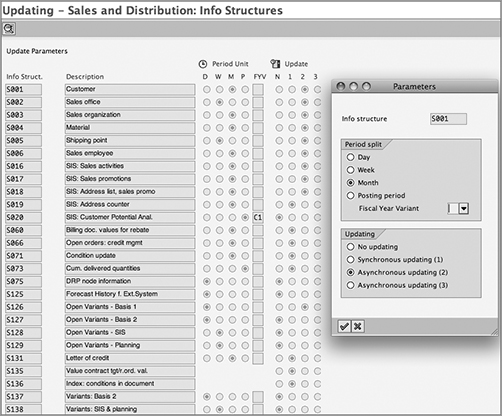
Choose the period split (such as daily, weekly, or monthly) at which the data is to be aggregated. For example, you may require monthly sales statistics or daily volumes of orders shipped.
In the options for updating, you can control when the information structure is to be updated:
No Updating With this option, the information structure is not updated at all.
Synchronous Updating (1) If you select Synchronous Updating (1), the structures are updated at the time of saving the transaction document. But you have to remember that if there is any problem during the update that results in process termination, then the original document is not saved.
Asynchronous Updating (2) If you select Asynchronous Updating (2), the document update happens separately from the statistics update. Unlike synchronous updating, a termination of the statistics update does not affect the document.
Asynchronous Updating (3) This option is similar to the previous one with one added feature: a time schedule. The update can be executed at a later time. Moreover, as opposed to the earlier options, the update is carried out for a batch of documents. Hence, it is also called collective update.
Accessing Reports
The data updated in the information structure can be queried and accessed based on your reporting requirements. SAP provides a set of standard reports (standard analyses) using the standard information structures.
We’ll focus on the standard analyses for the Sales Information System. The menu path is SAP Menu Logistics Sales and Distribution Sales Information System Standard Analyses.
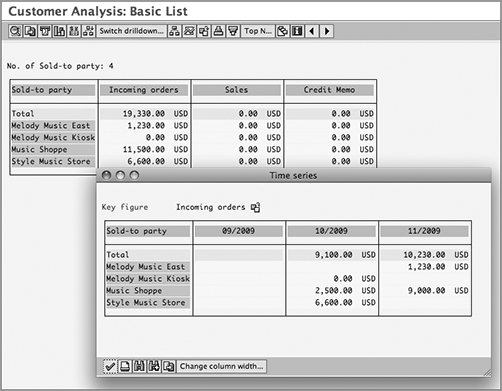
In this menu, you can get a list of available reports. Figure 14-37 shows an example of Customer Analysis (MCTA). It shows the statistics related to incoming orders for the customers of Galaxy Musical Instruments. There are several special functions in the menu bar (at the top of Figure 14-38) that help provide detailed analysis. For example, the Switch Drilldown function allows you to run the analysis at different characteristic levels. Thus, you can execute the same report at a sales organization level or a material level.
The Time Series option can split the data further into time buckets. In Figure 14-38, the statistics are reported on a monthly basis.
Figure 14-37: Customer Analysis screen
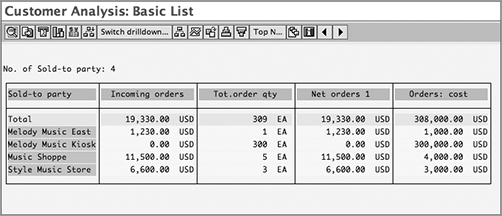
Figure 14-38: Time series analysis
Before you exit from the report, a dialog box helps you save the analysis. This is known as a selection version. At any point, this version can be called up to get a “snapshot” of the report as of a particular time.
If the standard analyses do not meet your reporting requirement, you can customize your analysis using the flexible analyses option.
There is also a provision to update planned data. You can generate reports that show planned vs. actual statistics for comparison and ease of decision making.
An early warning system allows you to set up exception messages. You can set up requirements and specify a threshold value for a key figure. If the threshold is crossed, the system can perform a “follow-up” action. Such an analysis can bring the exceptional record to the attention of the decision maker. For example, you can define a warning that if the total order value is less than $1,000 for a customer, the records should be highlighted in red. Use transaction MC/Q to create an exception rule. Specify a requirement that the order value is less than $1,000. Then define follow-up processing to flag the item in red.
EDI/ALE/IDoc
Intermediate Document (IDoc) is a document-exchange format used by SAP to transmit and receive messages between two application systems. Using IDoc, you can send and receive structured messages for transactions with business partners, such as vendors and customers. The standard structure is understood by both the sending and receiving systems. Since the message has a specific structure, it can be processed automatically. In contrast, if transaction details are sent by mail or fax, the receiver has to read and enter the data manually in their system. Structured messages save you from this effort and also ensure consistency and speed.
EDI and ALE
EDI and ALE are two techniques that use IDoc for exchanging business data.
Electronic Data Interchange (EDI) is the electronic exchange of business data between two partners. From an SD point of view, a common use of EDI is to exchange transactions about sales orders, deliveries, and invoices with your customers.
Application Link Enabling (ALE) enables the linking together of different applications running on different systems. For example, if you have other SAP or non-SAP systems in the landscape, you can share customer master or material master data with all the systems using ALE.
Setting up the EDI/ALE interface and IDoc is a vast topic that is outside the scope of this book. In this chapter, we will introduce you to some of the fundamentals that you will require as an SD expert.
The IDoc Structure
An IDoc is structured into three parts:
Control record The control record contains administrative information about the IDoc. This includes information about the IDoc being sent, the sender, and the recipient. It can be compared to a cover letter that precedes and introduces the main correspondence.
Data records There can be several data records structured logically. They contain the transaction information such as sold-to party, material, quantity, price, and so on.
Status record The status records contain information about the processing status of the IDoc along with a time stamp. The status records get added over time, based on the progress of the IDoc. For example, there will be a status record when the IDoc has been generated, when the IDoc is ready for dispatch, and when it has been processed successfully. In the case of any error, the message and code are displayed in the status record.
To display an IDoc, the path is as follows: SAP Menu Tools ALE ALE Administration Monitoring IDoc Display Display (WE02).
On the selection screen, you can search for a list of IDocs. For a selected IDoc, you can see the details of the control, data, and status records. Figure 14-39 shows an IDoc for a sales order.
Figure 14-39: Structure of an IDoc
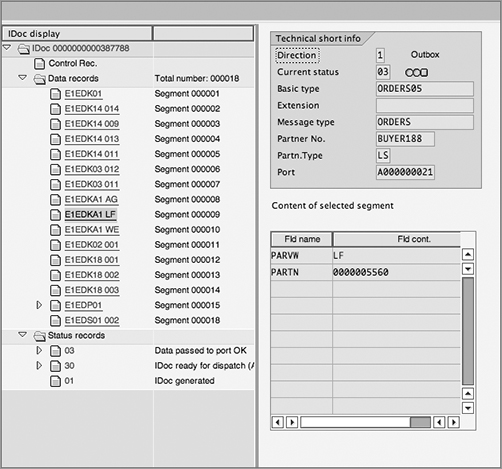
Let’s look at some of the IDoc details, as shown in Figure 14-39:
Technical Short Info The Technical Short Info box contains some of the control information. Among other details it has the Message Type field. ORDERS conveys that this IDoc is about a sales order. Similarly, DESADV is used for delivery-shipping notification, and INVOIC is used for billing documents.
Data segments Within the data records, there are data segments. The data is stored within the segments. If you examine the segment E1EDKA1 LF, as shown in Figure 14-39, you can see it contains information about the ship-to party. The segment consists of field names and actual field contents (data). In the example, one of the fields in the segment is the partner number (PARTN), and the value is 5560. Similarly, other segments contain all the data required to create a sales order. The data segment E1EDP01 contains item data such as the material number, quantity, and price.
One of the important fields in E1EDP01 is the customer expected price. This feature helps avoid price-related disputes. Often there are pricing agreements between the two parties recorded in contracts or catalogs. To make sure that they agree on the same price, the customer can send an expected price along with the purchase order. During the processing of the IDoc, the customer expected price is compared with the item price in sales order creation. If the difference is beyond a tolerance limit, the order can be placed on a block, and corrective action is required. This step reduces price-related disputes at a later stage.
The customer expected price is mapped in E1EDP01. It can either be a unit price (such as $10 per unit) or a value (such as the total item value of $100). When a sales order is created by processing the IDoc, the expected price gets copied to pricing condition type EDI1 (expected price) and EDI2 (expected value) in the pricing procedure. The value is then compared with the net price of the sales order item. The pricing routines 8 and 9 are used with pricing condition types, respectively. They control the deviation that is permitted.
NOTE One of the important uses of IDoc is in the intercompany billing scenario discussed in Chapter 9, “Billing.” The invoice sent by the supplying company code to the receiving company code has to be entered at the receiving end as a vendor invoice. In this case, the two company codes are set up as customers and vendors to each other. The intercompany invoice can be transmitted via IDoc and processed at the receiving end as a vendor invoice. This saves time and effort and ensures consistency of intercompany data.
IDoc Processing
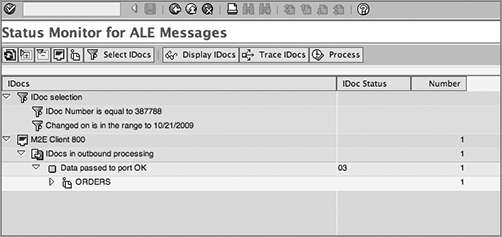
IDocs are processed in the background with regular jobs. You can monitor and process an IDoc manually using transaction BD87. The menu path is SAP Menu Tools ALE ALE Administration Monitoring IDoc Display Status Monitor (BD87). Enter the IDoc number in the selection screen and process. The outcome will be displayed in the status monitor, as shown in Figure 14-40.
Figure 14-40: Status monitor
Output Processing for ALE and EDI
In our discussion on output determination in Chapter 4, “Partner, Text, and Outcome Determination,” we showed you how output types are configured and how an output medium is assigned to them. In the case of transmitting the outbound message via EDI, the output medium is 6. In the settings for the processing routine, assign the form routine EDI_PROCESSING in the program RSNASTED. For ALE, the communication medium is A. Use the routine ALE_PROCESSING of the program RSNASTED. Figure 14-41 shows a typical output type setup for EDI and ALE.
Figure 14-41: Output processing for ALE and EDI

Custom Enhancements in SAP
During the course of this book, we have covered different functionalities and how they can be configured to suit the requirements of your organization. The customization menu provides these options to tailor the system response as per your requirements. However, it may not be adequate to meet certain needs specific to your organization or industry. In such cases, you can introduce changes to the program code in a controlled way. It is very important that the changes introduced do not have any side effects on the core functionality offered by SAP.
The following sections introduce the various options for carrying out enhancements to programming code. You will always require an ABAP expert to write the program code. This is just an overview and not a complete guide to implementing enhancements.
User Exits
There are specific points in standard programs where the user can attach their custom logic. These are called user exits. The common analogy used is that these are like hooks provided by SAP, where you can attach your custom code to the main programs. You have already seen some examples of user exits in earlier chapters such as Chapter 5 and 8.
User exits are available for different functionality, such as sales order user exits, delivery-related user exits, and so on. In the customization menu, user exits are listed under the System Modification nodes in each application area.
SAP Enhancements
SAP enhancements are customer exits provided by SAP as a controlled way to carry out changes. They consists of a function module that has an include statement where the custom code can be introduced. The input and output parameters control the data that can be brought in and sent out from the enhancement.
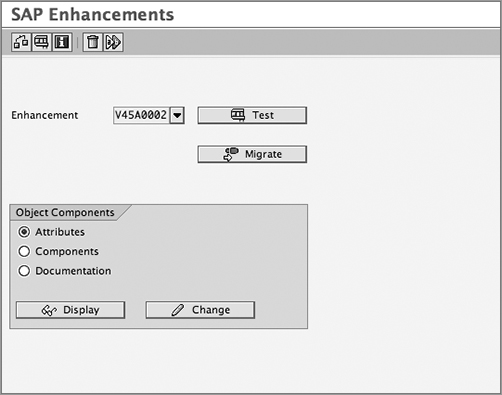
You can check the available enhancements using transaction SMOD. The menu path is SAP Menu Tools ABAP Workbench Utilities Enhancements.
If you have to use an enhancement, you have to first create a project using transaction CMOD and assign the SAP enhancement to the project. Then you can introduce your code below the include statement.
Figure 14-42 shows enhancement V45A00002 in SMOD. You can use this enhancement to define a default sold-to party when a sales document is being created.
Figure 14-42: Enhancements
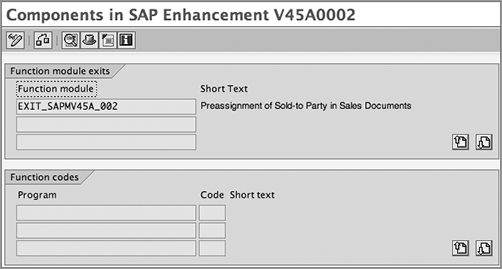
Within this enhancement is the function module EXIT_SAPMV45A_002 with an include statement (Figure 14-43). The export parameter listed for this function module includes the customer number (KUNNR). This means that you can write a custom code that will export a customer number to the main program. This number will then appear in the sales document.
Figure 14-43: Function module within the enhancement V45A00002
Business Add-ins (BAdI)
A business add-in is a new technique provided by SAP for carrying out enhancements. With the release of Netweaver 7.0, the concept of BAdI has been further enhanced.
In the customization menu, BAdIs are listed under the System Modification nodes in each application area. From the list, you can select the BAdI based on your requirement.
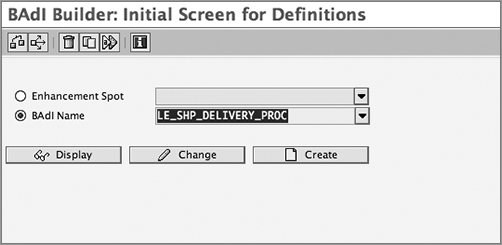
BAdIs are also accessible using the BAdI builder transaction SE18. The menu path is as follows: SAP Menu Tools ABAP Workbench Utilities Business Add-Ins.
Consider the example of the BAdI LE_SHP_DELIVERY_PROC in Figure 14-44. It enables you to carry out enhancements in delivery processing.
Figure 14-44: BAdI builder
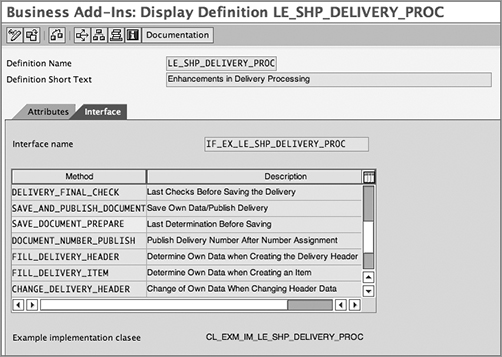
This BAdI has the interface IF_EX_LE_SHP_DELIVERY_PROC with methods such as SAVE_DOCUMENT_PREPARE, as shown in Figure 14-45. Using this method, you can perform additional checks or changes to data just before the delivery document is about to be saved.
Figure 14-45: Details of a BAdI
In this chapter, we discussed the concept of enhancement packages and switch frameworks that will help in implementing innovations released after ECC 6.0. We also covered the following important tools and techniques:
- QuickViewer and SAP Query, which are reporting tools
- MASS, a tool for mass update of documents
- Logistics Information System, a reporting tool
- EDI/ALE/IDoc, which are tools for communicating with other systems and partners
- User exits, enhancements, and business add-ins, which are used in making custom enhancements to SAP standard programs
This is the concluding chapter of this book. In these 14 chapters, you should have gained insights into the various steps in a sales cycle and the associated functionalities. Armed with this knowledge, you should continue to explore SAP further and leverage it to meet the changing needs of your organization.
We wish you all the best in your SAP adventures!
