
Chapter 5. Choose Event Sources
In his book The Paradox of Choice (Harper Perennial), author Barry Schwartz states:
Scanning the shelves of my local supermarket recently I found 85 different varieties and brands of crackers…285 varieties of cookies….13 sports drinks, 65 box drinks…and 75 teas…80 different pain relievers…29 different chicken soups…120 pasta sauces…275 varieties of cereal....
Schwartz examines durable goods such as electronics, then surveys life-impacting decisions regarding investments, insurance, retirement, and healthcare. Schwartz’s thesis is that having too many choices can lead to anxiety, dissatisfaction, and regret. In contrast, the choices for event sources, though varied, are not nearly as complex as those lamented by Schwartz, and should by no means cause you mental distress!
Now that you’ve worked through the steps of defining security policies, you know your network, and you’ve selected your targets, you can build on that foundation by choosing your event sources. For the network, systems, and device types you are monitoring, there are several corresponding event data types from which to choose. For example, network routers can yield system status messages and access-list deny logs via syslog, interface statistics via Simple Network Management Protocol (SNMP), network telemetry via NetFlow, as well as deep packet inspection results.
Although it may be tempting to use all of these sources for security event monitoring, not all of them are appropriate. This chapter provides an overview of the various device types and their event sources, how you can collect them, and how you can inspect them for security policy violations. We’ve gathered the myriad choices into a subset of the best event sources to help you choose the appropriate sources quickly, without becoming overwhelmed in the sea of possible event feeds.
Event Source Purpose
To best determine which event sources to use for monitoring, you must determine how the event source will be used. Your purpose in collecting any event source will impact storage requirements, data retention policies, and collection intervals. An event source may be used for one or more of the following reasons:
- Monitoring
Event collection consists of continuous streams of alerts recorded and analyzed in real time or near-real time. Correspondingly, systems selected for monitoring have a lower storage capacity and a shorter data retention policy because their window of focus is very near-term.
- Incident response and investigation
Incident response and investigation typically requires a higher storage capacity and longer data retention policy. Events are often stored in a database for fast querying of recent event data (typically within one month). This time frame depends heavily on event rate and volume, with high volume and high event rates decreasing retention time and increasing storage requirements.
- Regulatory compliance, legal requests, and forensics
Systems that fall under the purview of government regulation often have special compliance requirements. These include long-term, multiyear storage of event data, supporting investigations of legal matters such as lawsuits. Forensic investigations often extend to data from the distant past, requiring access to data located on tape backup, typically stored off-site. Access to this data is far from real time, as a restore from tape backup can require hours or days to complete.
Let’s look at an example legal request. Say you received the following message from your legal counsel:
From: Dewey Cheatem (Legal Counsel)
Sent: Thursday, May 8, 2008 10:57 AM
To: [email protected]
Cc: Michelle Howe (Legal Counsel)
Subject: Computer Investigation Request
Importance: High

ATTORNEY/CLIENT PRIVILEGE:

Computer Security Incident Response Team,

We are currently involved in litigation from a former employee, Jermison Bue-
Snockley, who states that his co-worker logged in to his email and sent damaging
communications to friends, family, and complete strangers that resulted in a police
investigation into alleged illicit activities. We need to find out who accessed
Jermison's computers on the following dates:

October 10 2007
October 12 2007
November 4 2007
November 8 2007

In addition, Mr. Bue-Snockley claims that he was signed up for several email lists
of an adult nature from the following sites and dates:

~November 18th - lonely-adult-hookup.com
~November 20th - cannibis-exchange.com

Please investigate this incident and provide an initial writeup by the end of next
week.

Sincerely,

Dewey Cheatem, BigBucks Legal Services
How will you address this request? Is this data logged? For how long is it retained? Will it require a restore from backup? If you’ve collected all necessary event types, your response might resemble the following:
From: [email protected]
Sent: Friday, May 9, 2008 9:15 AM
To: Dewey Cheatem (Legal Counsel)
Cc: Michelle Howe (Legal Counsel)
Subject: Re: Computer Investigation Request
Importance: High

ATTORNEY/CLIENT PRIVILEGE:

Mr. Cheatem / Ms. Howe,

I've checked with our lead incident handler and we should be able to provide most
of this data by early next week. We won't be able to look directly at Mr. Bue-
Snockley's computer data for 3-5 business days as the backups have already been
taken offsite.

Regards,

Blanco CSIRT
The Blanco CSIRT team in this example has NetFlow, which recorded connectivity from a computer connecting to the IP addresses of the websites in question, as well as proxy logs showing the specific URLs used to register Mr. Bue-Snockley’s email address to the alleged websites (plus several others that he may not yet have seen). In addition, the team has logon/logoff messages collected via syslog from all systems, including Mr. Bue-Snockley’s. As it turns out, the CSIRT investigation found logon events that corresponded with the time frame of the NetFlow. It was later learned that an employee on Jermison’s team logged into his computer and signed him up for the lists, in retaliation for a personal conflict.
Event Collection Methods
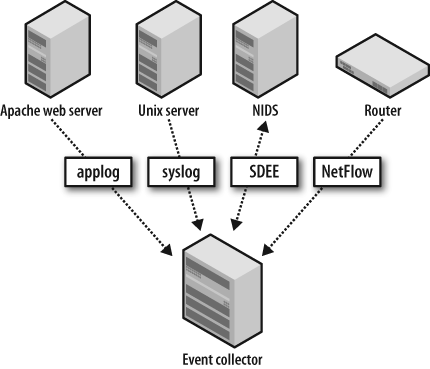
When selecting event sources for security monitoring, you must factor in the method for collection, since it will affect performance and timeliness. As depicted in Figure 5-1, there are two general methods for collecting events: push and pull.
- The push method
With the push method, events are sourced from the device at specified intervals or in real time, as configured on the device itself. The event collector must be prepared to receive the events as they occur. Examples of this method include syslog messages, access-list (ACL) logs, and NetFlow.
- The pull method
With the pull method, events are stored locally on the originating device and are retrieved by the collector. That is, the collector initiates collection of the event messages from the device that generates the events. Two common protocols for pulling event data are Security Device Event Exchange (SDEE) and the familiar SNMP. SDEE was developed by a working group at ICSA Labs, called the Intrusion Detection Systems Consortium (IDSC), which consisted of Cisco, Fortinet, INFOSEC Technologies, ISS, SecureWorks, Sourcefire, Symantec, and Tripwire, which provide the following information regarding the protocol:
The Security Device Event Exchange (SDEE) specifies the format of the messages as well as the protocol used to communicate the events generated by security devices. SDEE is designed to be flexible and extensible so that vendors can utilize product specific extensions in a way that maintains messaging compatibility. SDEE builds upon the XML, HTTP and SSL/TLS industry standards to facilitate adoption by vendors and users by allowing them to utilize existing software that implements these standard interfaces.
SDEE Data Format
Currently addresses the data format of intrusion detection/protection alerts
Events formatted as XML elements
Formats specified using XML schema. Supports schema validation
Documented with schema annotations
Designed to support extensions and to evolve while maintaining core compatibility
Designed to be efficiently managed
SDEE Communication
Extensible. Support for different transport bindings
Currently specifies bindings to HTTP and HTTP over SSL/TLS
Using existing technology eases adoption for providers and clients
Support for authorization and encryption with existing HTTP and SSL/TLS
Client initiated event retrieval
SDEE has been implemented on numerous security devices, such as firewalls, NIDSs, routers, and other network devices. It is also used on various host intrusion prevention system (HIPS) solutions, such as Cisco’s CSA software. The SDEE standard, released in 2004, has been adopted primarily by Cisco, ISS, and Sourcefire, which developed and documented the standard. The IDSC was renamed the Network IPS Product Developers (NIPD) Consortium in March 2005.
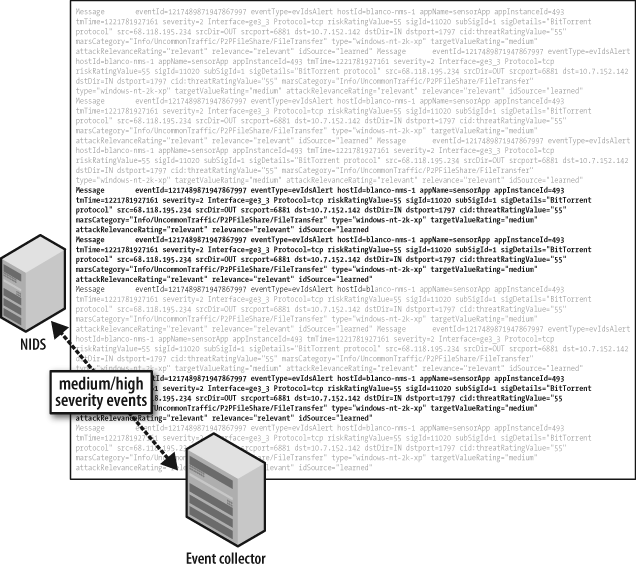
The pull collection method offers some advantages over the push collection method, including event-rate control, preparsing (allowing you to specify the specific events types to pull), and guaranteed delivery. These benefits are illustrated in Figure 5-2. In contrast, most connectionless UDP-based push technologies, such as syslog, SNMP, and NetFlow, only provide “best effort” delivery. Consequently, pushed events offer less control, especially in controlling event rates; these messages are sent “fire and forget”.
Event Collection Impact
Event collection can impact a system in several ways, most commonly in terms of system performance and storage requirements. Due to separation of duties, it’s unlikely that you’ll have responsibility for every device used in event collection. You may have direct control over the event collector, allowing you to configure storage space to meet your needs. The performance of the devices generating the events, however, is more likely under the control of IT system and network administrators. This obviously complicates the process of accessing the events, and requires careful planning to prevent disruption to your event collection.
Here are some important issues to consider when you’re configuring event data feeds:
- Impact on the sending device’s CPU
Collect only necessary messages (many devices use a term such as alert level). This will minimize both the performance impact and the disk storage requirements. As we mentioned in Chapter 3, using standard templates for each type of device will speed the process for configuring devices.
- Event message detail
You should analyze messages generated by each event source to verify that the contents are useful and have the appropriate level of detail. For example, a login message that lacks the username and system name is not attributable; it lacks sufficient detail to allow immediate analysis and response. Such messages are not worth collecting, and they take up space without providing proportionate usefulness.
- Event volume
The impact of event volume depends on the system’s purpose, rate of utilization, and configured logging level. For example, a firewall that is logging deny messages via syslog can send messages at a rate that would quickly fill your collector’s disk, decreasing the retention time for all of your event data.
Event logging configuration plays an important role in system performance, and can create a negative impact on the sending device’s CPU. In denial-of-service (DoS) attacks, for example, a router configured with an access control entry logging denied packets could have its performance severely degraded. The impact can cascade to other devices as critical router processes such as routing itself (BGP peers dropping, etc.) are unable to function properly due to the lack of CPU resources. It is important to verify with your network hardware vendor what the CPU impact could be and whether there are ways to mitigate it, such as log rate limiting. Cisco, for example, gives the following advice when logging ACLs:[40]
ACL logging can be CPU intensive and can negatively affect other functions of the network device. There are two primary factors that contribute to the CPU load increase from ACL logging: process switching of packets that match log-enabled access control entries (ACEs) and the generation and transmission of log messages.
You can mitigate this scenario with rate limiting and by increasing the logging interval:
The
ipaccess-listlogginginterval10command limits log-induced process switching to one packet per 10 milliseconds, or 100 packets per second. Theloggingrate-limit100except4command in the example limits log generation and transmission to 100 messages per second except for log levels 4 (warnings) through 0 (emergencies).
The configuration for rate limiting is quite simple; the following commands implement these suggestions for a Cisco router:
logging buffered informational
logging rate-limit 100 except 4
ip access-list logging interval 10
Cisco’s NIDS solution also features a throttling mechanism to prevent a DoS attack on the sensor via its event summarization modes. The sensor will “summarize” a large burst of individual events into a meta-event that, although not specific (i.e., it doesn’t include a source/destination IP), can prevent an overload from the same event. This thwarts attacks that attempt to overwhelm the security staff with alert volume, such as the “Stick” attack described by Coretez Giovanni.[41] You will still get the source and destination IPs in the first few events before the summarization starts.
Just as important as the performance impact on the sending device is the need to obtain the appropriate amount of detail in the collected messages. Too little detail and the messages are not useful; too much detail and the messages require unnecessary extra processing and storage. For example, a NIDS alert can contain data ranging from minimal contextual information to full packet capture (often called a trigger packet). In some situations, you may want to know exactly what packet(s) triggered the alert. You may also require the packet contents from the next few packets after the alert as well. For example, the following log message shows that host 10.0.30.209 connected to the HTTP port on 64.62.193.129. If that is all you need to know (the fact that one host connected to the other, similar to what you’ll get with NetFlow), the message is sufficient with its timestamp and source/destination IP information.
20:29:54.829259 IP 10.0.30.209.1514 > 64.62.193.129.80
However, you may want to know specifically what host 10.0.30.209
has requested from the web server. Those details need to come from the
application log source, such as the access_log file from your proxy server:
20:29:54.829259 10.0.30.209 TCP_MISS/200 1393 GET http://
64.62.193.129/J05532/a4/0/0/pcx.js text/x-c DEFAULT_CASE-DefaultGroup <Busi,-
2.4,0,-,-,-,-,1,-,-,-,-,"Skipped"> -
Further inspection of the pcx.js file shows that it contained a set of commands passed to malware running on the host, instructing it to download an updated victim list for DoS attacks.
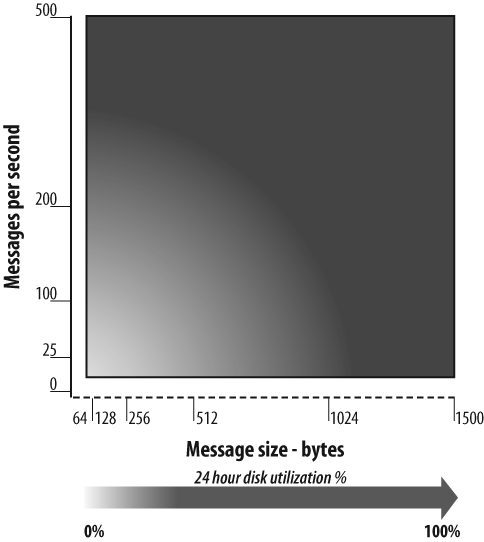
The last issue, event volume and rate, impacts your ability to retain data for the appropriate length of time, as depicted in Figure 5-3. As the event rate received and stored increases, the available disk space correspondingly decreases. Since disk resources are finite, your event collector will likely purge the alerts in a first-in, first-out (FIFO) fashion.
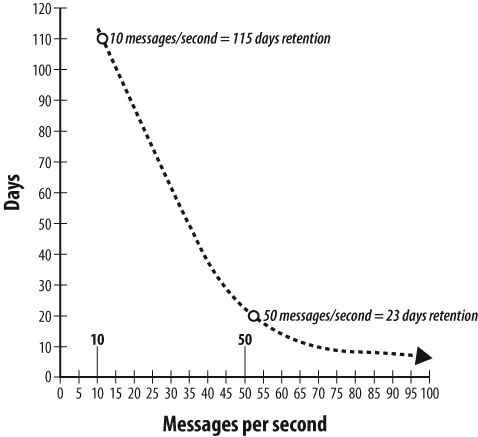
For example, if your event collector can hold 100 million alert messages on 50 GB of disk space and your event rate is normally 10 messages per second, it would take approximately 115 days (10 million seconds) to fill your disk (see Figure 5-4). If your rate spikes to 50 messages per second, the time to fill your disk will drop to 23 days. At 100 events per second, your retention time drops to 11 days!
This impact becomes clear when you consider an example such as a Cisco terminal server configured for TACACS+ authentication on TTY lines. The presence of noise on the async lines causes EXEC processes to be spawned and authentication attempts to be sent to the Authentication, Authorization, and Accounting (AAA) server:
07:44:26 aaa.blanco.com : [ID 259349 local0.warning] - User *(#$''''%^@ not found
07:45:26 aaa.blanco.com : [ID 259349 local0.warning] - User *(#$''''%^@ not found
07:45:28 aaa.blanco.com : [ID 450946 local0.warning] - User !_)*$^ not found
07:45:32 aaa.blanco.com : [ID 450946 local0.warning] - User !_)*$^ not found
07:45:48 aaa.blanco.com : [ID 259349 local0.warning] - User *(#$''''%^@ not found
07:46:33 aaa.blanco.com : [ID 624588 local0.warning] - User !_)*$^ not found
07:46:44 aaa.blanco.com : [ID 259349 local0.warning] - User *(#$''''%^@ not found
07:47:43 aaa.blanco.com : [ID 259349 local0.warning] - User *(#$''''%^@ not found
07:48:36 aaa.blanco.com : [ID 259349 local0.warning] - User *(#$''''%^@ not found
07:49:01 aaa.blanco.com : [ID 259349 local0.warning] - User *(#$''''%^@ not found
These errant authentication messages are essentially garbage data, filling up your logfiles and wasting disk space. Such large volumes of messages can burst into your collector, severely degrading your capacity to retain log messages.
As you can see, controlling message rates from your devices is required to ensure that your data will be there when you need it, along with the necessary detail. One effective configuration technique is to allot a specific quota of disk space for each type of data source, controlling the impact of any single event source on the entire collection system.
Let’s consider some specific examples of event data types, and the unique collection impact of each.
Host logs
The bulk of host logs includes OS system messages (such as those logged to /var/log/system or /var/log/messages, etc.) that are written locally as configured by the system administrator. Host logs are almost always pushed to the collector. The event rate will vary among systems, depending on usage and logging level. A frequently used system configured to log at a very high level (such as debug logging) could cause the syslog daemon to use too many system resources. This will impact not only CPU performance, but local disk storage as well; the generated messages could fill the local system disk, causing the syslog daemon or the system itself to crash.
In Example 5-1,
you can see several messages about system performance and application
transactions. These messages contain critical details that you don’t
want to miss. Specifically, you can see user
drobbins logging in as root
with the sudo command. Using
templates for host syslog configuration, as we will discuss in Chapter 6, can ensure that this information is
logged. In this example, they were used to specify appropriate syslog
settings to capture login messages for this server.
Sep 18 03:05:24 blanco-linux installdb[80516]: started (uid 96)
Sep 18 03:05:24 blanco-linux installdb[80516]: Opened receipt database on '/' with
schema 17.
Sep 18 03:05:36 blanco-linux installdb[80516]: done. (0.007u + 0.005s)
Sep 18 19:06:02 blanco-linux sshd[84532]: Could not write ident string to UNKNOWN
Sep 18 20:59:19 blanco-linux sshd[26778]: Accepted keyboard-interactive/pam for
drobbins from 64.102.56.104 port 56475 ssh2
Sep 18 20:59:19 blanco-linux sshd(pam_unix)[26784]: session opened for user
drobbins by (uid=0)
Sep 19 21:22:40 blanco-linux sudo: drobbins : TTY=pts/1 ; PWD=/home/drobbins ;
USER=root ; COMMAND=/bin/su -
Sep 19 21:22:40 blanco-linux su[28169]: Successful su for root by root
Sep 19 21:22:40 blanco-linux su[28169]: + pts/1 root:root
Sep 19 21:22:40 blanco-linux su(pam_unix)[28169]: session opened for user root by
(uid=0)
Sep 18 22:29:13 blanco-linux syslog-ng[4791]: Log statistics;
processed='center(queued)=258910', processed='center(received)=129455',
processed='destination(messages)=129455',
processed='destination(console_all)=129455', processed='source(src)=129455'
Sep 18 22:30:07 blanco-linux ReportCrash[85189]: Formulating crash report for
process aex-pluginmanager-bin[85188]
Sep 18 22:30:07 blanco-linux ReportCrash[85189]: Saved crashreport to
/Library/Logs/CrashReporter/aex-pluginmanager-bin_2008-09-18-211606_blanco-
linux.crash using uid: 0 gid: 0, euid: 0 egid: 0
Sep 18 22:30:11 blanco-linux ReportCrash[85189]: Formulating crash report for
process aex-pluginmanager-bin[85190]
Sep 18 22:30:11 blanco-linux ReportCrash[85189]: Saved crashreport to
/Library/Logs/CrashReporter/aex-pluginmanager-bin_2008-09-18-211610_blanco-
linux.crash using uid: 0 gid: 0, euid: 0 egid: 0
Sep 18 22:30:15 blanco-linux ReportCrash[85189]: Formulating crash report for
process aex-pluginmanager-bin[85191]
Network IDS
Network IDS (NIDS), as we will discuss in Chapter 6, holds an advantage over other event sources: it does not introduce extra load on the monitored systems. Each sensor, however, has the potential to generate millions of alerts per day if it is left untuned. You must ensure that your NIDS is properly tuned to prevent the collection and storage of massive amounts of false-positive alerts.
You can process NIDS alerts via either a push or a pull technology, depending on its configuration and features. Use caution when rolling out new signatures on the sensors, however. A poorly written signature that matches expected traffic in your network can generate so many false-positive alerts that your retention will be impacted, as we previously discussed. A well-tuned NIDS with appropriate context added from network variables, as shown in Example 5-2 and discussed further in Chapter 6, is one of the best sources of reliable security event data.
Message eventId=1217489871947867997 eventType=evIdsAlert hostId=blanco-ids-1 appName=sensorApp appInstanceId=493 tmTime=1221781927161 severity=2 Interface=ge3_3 Protocol=tcp riskRatingValue=55 sigId=11020 subSigId=1 sigDetails="BitTorrentprotocol" src=68.118.195.234 srcDir=OUT srcport=6881 dst=10.10.1.68 dstDir=WEBAPP_SERVERSdstport=1797 cid:threatRatingValue="55" marsCategory="Info/UncommonTraffic/P2PFileShare/FileTransfer" type="windows-nt-2k- xp" targetValueRating="medium" attackRelevanceRating="relevant" relevance="relevant" idSource="learned"
NetFlow
NetFlow is collected via push, and
represents a critical source of incident data with a variety of uses
for security. For instance, you can collect NetFlow in raw format to
be stored on disk, then relay it to systems that interpret trends or
identify anomalies. Because NetFlow is based on network traffic
patterns, spikes in traffic, such as those caused by a DoS attack, can
negatively impact data retention. However, you can configure NetFlow collection with OSU flow-tools
to drop (not store) certain traffic based on source/destination
address, source/destination ports, IP network, AS number, type of
service, prefix length, TCP flag, and other attributes. To drop
traffic based on these criteria, you can define your settings with the
capture filter command. For more information, reference documentation
via the man flow-capture
command.
You should collect NetFlow at critical choke points, such as distribution gateways in a data center and perimeter devices in your DMZ. You will find these choke points at your network ingress/egress demarcations; they are often the division point of security policies. In our experience with OSU flow-tools, we’ve found that 1.2 gigabits per second of bandwidth running at 200,000 packets per second (pps) can be stored in 600 GB of storage, allowing approximately 90 days of history.
Figure 5-5 depicts your visibility into a network without NetFlow. Without NetFlow, you are essentially blind to anything happening on your network. Did someone download the payroll database? Who uploaded a trojan file to the web server? How many times was the accidentally exposed data downloaded? The answer to all of these questions is “I don’t know” without network telemetry such as NetFlow.

Application logs
Application logs can be extremely useful to collect, as they provide in-depth data about application activity between users and systems. Because application log formats vary so widely, identifying specific incidents and ruling out false positives can be challenging, even with the more popular applications such as Apache Web Server and the Squid proxy, with their large and well-established user base.
As you can see in Example 5-3, proxy server logs include varying levels of detail regarding HTTP transactions. The volume and detail of messages in a proxy server typically require third-party tools to analyze the logs, such as AWStats,[42] Sawmill,[43] or Splunk.[44]
1219859423.875 56 10.0.30.209 TCP_MISS/200 1085 GET
http://rad.msn.com/ADSAdClient31.dll?GetAd=&PG=IMUSVT - DIRECT/rad.msn.com
text/html ALLOW_WBRS-DefaultGroup <Adve,7.7,-,-,-,-,-,-,-,-,-,-,-> -
1219859448.869 42 10.0.30.209 TCP_MISS/200 7106 GET
http://edge1.catalog.video.msn.com/videoByTag.aspx?mk=us&ns=gallery&tag=im_f_35
-49&responseencoding=rss&p=im_f_35-49 - DIRECT/edge1.catalog.video.msn.com text/xml
ALLOW_WBRS-DefaultGroup <Stre,7.7,-,-,-,-,-,-,-,-,-,-,-> -
1219859840.488 16 10.0.30.209 TCP_MISS/200 384 HEAD
http://download.windowsupdate.com/v7/windowsupdate/redir/wuredir.cab?0808271800 -
DIRECT/download.windowsupdate.com application/octet-stream DEFAULT_CASE-
DefaultGroup <Comp,2.8,0,-,-,-,-,-,-,-,-,-,-> -
1219859846.256 105 10.0.30.209 TCP_MISS/200 368 HEAD
http://www.update.microsoft.com/v7/microsoftupdate/redir/muauth.cab?0808271800 -
DIRECT/www.update.microsoft.com application/octet-stream ALLOW_WBRS-DefaultGroup
<Comp,8.4,-,-,-,-,-,-,-,-,-,-,-> -
1219859857.528 20 10.0.30.209 TCP_MISS/200 368 HEAD
http://download.windowsupdate.com/v7/microsoftupdate/redir/muredir.cab?0808271800 -
DIRECT/download.windowsupdate.com application/octet-stream DEFAULT_CASE-
DefaultGroup <Comp,2.8,0,-,-,-,-,-,-,-,-,-,-> -
1219860033.536 53 10.0.30.209 TCP_MISS/200 1085 GET
http://rad.msn.com/ADSAdClient31.dll?GetAd=&PG=IMUSVT - DIRECT/rad.msn.com
text/html ALLOW_WBRS-DefaultGroup <Adve,7.7,-,-,-,-,-,-,-,-,-,-,-> -
1219860058.807 33 10.0.30.209 TCP_MISS/200 7029 GET
http://edge1.catalog.video.msn.com/videoByTag.aspx?mk=us&ns=gallery&tag=im_default&
responseencoding=rss&p=im_default - DIRECT/edge1.catalog.video.msn.com text/xml
ALLOW_WBRS-DefaultGroup <Stre,7.7,-,-,-,-,-,-,-,-,-,-,-> -
1219860068.892 62 10.0.30.209 TCP_CLIENT_REFRESH_MISS/200 364 GET
http://watson.microsoft.com/StageOne/Generic/mptelemetry/80072efe/endsearch/sea
rch/1_1_1593_0/mpsigdwn_dll/1_1_1593_0/windows%20defender.htm?LCID=1033&OS=5.1.2600
.2.00010100.2.0&DWVer=11.0.8163.0 - DIRECT/watson.microsoft.co
m text/html ALLOW_WBRS-DefaultGroup <Comp,8.4,-,-,-,-,-,-,-,-,-,-,-> -
1219860592.185 463 10.0.30.209 TCP_CLIENT_REFRESH_MISS/302 752 PROPFIND
http://services.msn.com/svcs/hotmail/httpmail.asp - DIRECT/services.msn.c
om text/html ALLOW_WBRS-DefaultGroup <Web-,7.7,-,-,-,-,-,-,-,-,-,-,-> -
Because application logs can be complex and capacious, you should only collect them from the most critical systems, including those under regulatory compliance requirements. If you’re not in IT, you’ll need to maintain a strong relationship with IT application owners, as you will need their cooperation and input to interpret the logs properly.
Database logs
As we will discuss further in Chapter 6, database logs are one of the most challenging event sources to collect. The most detailed, useful messages require corresponding auditing configuration in the database. In Oracle, for example, auditing features are complex and require careful configuration to produce useful results that will not harm database performance. Database messages require automated parsing for efficient collection and storage, as shown in Example 5-4. Since these systems are likely to house your most precious intellectual property and critical business data, good database logging can become one of the most powerful pieces of security data.
USERNAME        TERMIN ACTION_N TIMESTAMP       LOGOFF_TIME     RETURNCODE
--------------- ------ -------- --------------- --------------- ----------
SYS             pts/3  LOGOFF   02152013:221056 02152013:221651          0
VINAY           pts/1  LOGON    02152013:221651                       1017
SYS             pts/3  LOGOFF   02152013:221659 02152013:223022          0
SYS             pts/2  LOGOFF   02152013:222622 02152013:223508          0
VINAY           pts/1  LOGON    02152013:223022                       1017
Network ACL logs
ACL logs from network firewall devices can provide visibility into traffic that is dropped (deny logs) or passed (permit logs), based on the codified rules of the ACL. You must be extremely cautious when collecting ACL logs from network devices because the CPU utilization often impacts other device functions. This impact will vary among hardware platforms and operating systems, but devices that act as dedicated security hardware, such as commercial firewalls, are usually designed to handle such workload. Cisco IOS, the operating system used on most Cisco routers, allows you to define update thresholds and rate limiting to mitigate the impact of ACL logging. Due to the potential impact, however, be prepared with appropriate justification before enabling ACL logging on any devices not specifically dedicated to firewalling traffic.
Network ACL logs can also be an invaluable source of troubleshooting information. For instance, in Example 5-5, you can see why a partner’s Win32 computers are not getting updates and patches from Microsoft; the traffic is being blocked.
Sep 23 18:32:39.029 IST: %SEC-6-IPACCESSLOGP: list BLANCO-XNET denied tcp
10.56.68.104(3288) -> 65.55.27.221(443), 1 packet
Sep 23 18:32:45.041 IST: %SEC-6-IPACCESSLOGP: list BLANCO-XNET denied tcp
10.56.68.104(3288) -> 65.55.27.221(443), 1 packet
Sep 23 18:33:07.173 IST: %SEC-6-IPACCESSLOGP: list BLANCO-XNET denied tcp
10.56.78.215(4108) -> 65.55.27.221(443), 1 packet
Sep 23 18:33:10.393 IST: %SEC-6-IPACCESSLOGP: list BLANCO-XNET denied tcp
10.56.78.215(4108) -> 65.55.27.221(443), 1 packet
Now that you have an idea of how events are collected, which event types are available, and what potential performance impact exists, let’s look at how Blanco has chosen its event sources.
Choosing Event Sources for Blanco Wireless
Figure 5-6 shows the configuration of event source collection for Blanco’s security monitoring. Notice that Blanco has configured NetFlow, NIDS, syslog, application logs, and database audit logs to detect policy violations affecting its selected monitoring targets.

To monitor the targets selected in Chapter 4, Blanco has enabled NetFlow export from its data center routers, storing the flow data in a NetFlow collector system. Blanco’s security team will use this data to identify connections sourced from critical systems toward external systems, and to identify large volume copies from database systems.
Blanco’s Unix servers are configured to send messages to a syslog
collection server. The security team will monitor these messages for
direct privileged logins and privilege escalation via sudo. The servers are also configured to log and
relay messages recording stops and starts for the web server, SSH, and
database processes.
Blanco’s NIDS is configured to monitor for known attacks against the Oracle suite. The security team has created custom signatures to identify:
Unencrypted transmission of Social Security numbers (a policy violation)
The
describecommand issued against any production database (an indication of database enumeration by someone unfamiliar with the schema)
Blanco’s database administrators have configured the Oracle database servers to audit for:
Queries against the
SSNcolumns in the customer account tableQueries against
V$(another method for enumerating system users, processes, and connected applications)Direct privileged logins (
systemorsys)
Conclusion
Not every log message or event source proves useful for security monitoring, and even good event sources can overtax the devices you’re monitoring. The work we’ve done to carefully choose event sources is our last selection step to configure policy-based monitoring. A clear understanding of how you intend to use and collect event sources will prioritize how you determine proper configuration of logging levels, select collection hardware, and set data retention policies. In Chapter 6, we will focus on strategies and methods to collect these event sources, filtering them into actionable security events.