
Chapter 7. Maintain Dependable Event Sources
In “Stalking the Wily Hacker,” Cliff Stoll describes his investigation of a major security breach at Lawrence Berkeley Laboratories. According to the account, the hacker took pains to avoid leaving tracks of his intrusion: “Whenever possible, he disabled accounting and audit trails, so there would be no trace of his presence....”[54]
Security events such as user activity logs, network intrusion detection system (NIDS) alerts, server logs, and network device records are indispensable footprints, allowing security investigators to trace activity and monitor for problems. Without reliable event sources, monitoring is a futile exercise—there’s no way to discern lack of activity from unrecorded activity.
Figure 7-1 displays a router traffic graph, generated by Multi Router Traffic Grapher (MRTG) to show traffic throughput for a series of network interfaces. It illustrates traffic received by eight NIDSs in a production environment. There’s clearly a problem with one of the sensors—it’s no longer receiving any traffic.
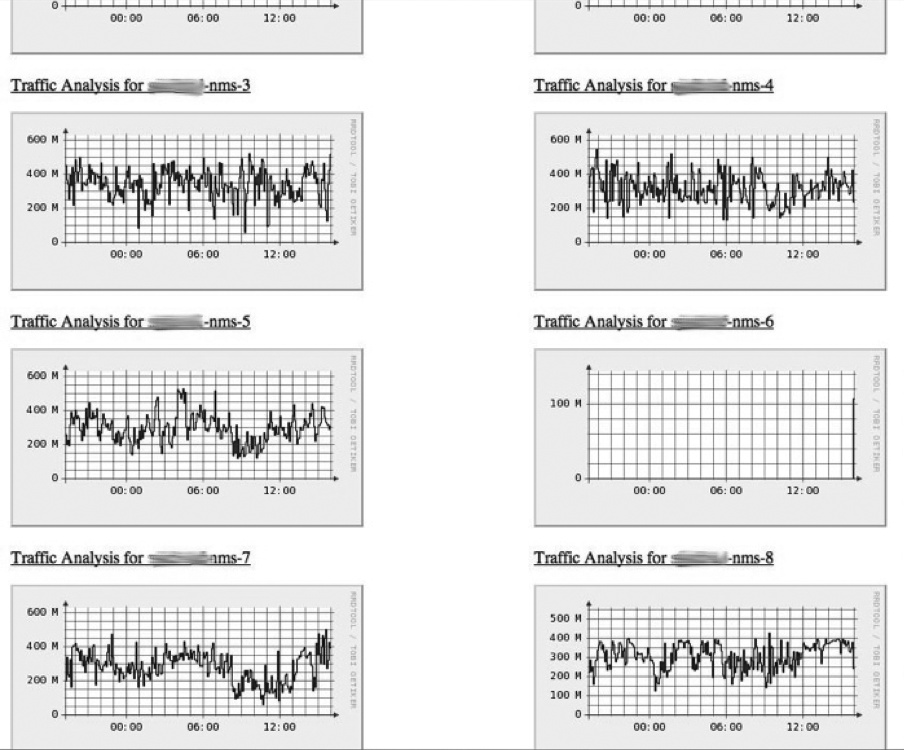
This may be a planned outage. Perhaps the sensor was just placed into service, or its SPAN was disconnected from the router for scheduled maintenance. It’s possible there’s a malicious explanation for this outage, but as is true with much of security monitoring, the explanation is likely mundane. Regardless of the source for this outage, you’ll be blind to security alerts while the sensor is offline. What can you do to catch these problems, keeping downtime to a minimum?
Consider other gaps—systems or network segments of which you’re not even aware. If you have a relatively large network, it’s probably not constant; new networks and systems are being added monthly or even weekly. This illustrates another blind spot: new areas of the network and new systems where security intrusions could go unnoticed; you probably aren’t yet collecting events from these systems. Without these events, there’s nothing to trigger alerts in your monitoring system. How can you prevent such gaps while watching for substantive changes to your environment?
To maintain reliable security monitoring, you must not only deploy the proper event sources, but also monitor the event sources to catch interruptions. In addition, you must keep watch for new systems deployed into your environment to ensure that events are properly recorded. This chapter will introduce you to tools and processes to keep security events continually recorded. We’ll describe how to maintain proper device configurations, how to keep an eye on your event feeds, and how to maintain agreements with the support staff.
Maintain Device Configurations
One of the most effective means for keeping event sources working reliably is to manage configurations on the devices themselves. Recall that Chapter 5 provided guidance for configuring security event feeds. For example, a NIDS deployed passively requires a copy of the network traffic via a router switch port analyzer (SPAN) port, and a Unix server hosting an Apache web server should be configured to log authentication events to an event collector via its syslog.conf file. Consistent event collection depends on specific configuration directives on the source systems. If a network engineer removes a SPAN or a system administrator overwrites the syslog.conf settings, event feeds will suddenly stop. To minimize such errors, this section introduces the following techniques:
Maintain documented agreements with device administrators.
Where possible, leverage an automated configuration system to ensure that all systems maintain proper configuration for sending events.
Create Service Level Agreements
Device administrators (those who maintain servers, network equipment, and databases) hold responsibility for keeping things running smoothly and securely on the devices they support. They also hold superuser privileges on these devices, allowing them to make changes to configurations as they see fit. Consequently, the event feeds upon which you depend will require their cooperation to configure these devices and keep them functioning properly.
You may have a strong rapport with these administrators, and believe you can depend on them to keep your event feeds running smoothly. However, organizations change—a boss is promoted, a colleague reassigned—and can disrupt your informal agreements. To ensure commitment to your goal, we recommend you document your configuration requirements in formal agreements. Such agreements are best expressed in a contract called a service level agreement (SLA), formed between two parties: you (the client party), and the administrator’s organization (the service provider party).
When building an SLA, be sure to clearly represent the following:
- Rationale
Why is the agreement necessary? What value does it protect for the business?
- Specific, required actions for each party in the agreement
This is the heart of the SLA, to document what’s expected in a way that can be quantified. It’s not reasonable to document what’s required of only one party. Each party must bear some responsibility.
- Time period in which the agreement will be in effect
(Almost) nothing lasts forever.
- Signatures of accountable managers for each party to the agreement
These can be ink or electronic signatures. The point is to ensure that you’ve reached a final agreement so that you can put it in effect and hold each party accountable.
You’ll need a separate SLA for each organization you engage. If your company is organized like most are, this means you’ll have one SLA per type of event source. Table 7-1 outlines the types of configuration directives you’ll want to maintain via the SLA and the commonly used names for the organizations you’ll probably need to engage.
Event source | IT organization | Configuration support |
NIDS alerts | Network engineering/administration |
|
Server events (syslog, etc.) | System administration/hosting |
|
Database events | Database administration (DBA) |
|
Application events (web servers, app servers, etc.) | Application administration (webmasters, etc.) |
|
Back It Up with Policy
Just as Chapter 2 described, policy is the foundation for effective security monitoring. Before you build an SLA, establish a device logging policy that documents expectations for the following:
Which devices must log events (which devices are “in scope” for the policy)
Which event types must be logged
Where events must be logged (a “collection server” for security events)
Who must have access to such logs (be sure to include your security team members)
This policy provides the foundation for building an SLA and maintaining a configuration template, which we’ll illustrate in the next section.
SLA Sections
To build your SLA, include the following sections:[55]
- Service description
This is where you should document the scope of the service being offered. By scope, we mean to define the bounds of the service, indicating that you are committing to only certain devices, certain parts of the globe, and so forth. For the purpose of security event monitoring, you should describe exactly which devices are included in the scope of support and what event feeds you are expecting to be maintained.
- Roles and responsibilities
This is where each participant is named, both the service provider and the service client. For the purpose of event monitoring, this should name the group that maintains the device and exactly what is expected, including maintenance of event feeds and configuration directives. You are the client of such an agreement.
- Requesting service
This is where the process for making requests is documented. For security event feeds, this should document how the client (you) is expected to make requests of the device owner, and how the device owner is to make you aware of service outages or configuration changes.
- Hours of operation
This is where you should document expectations regarding expected up time of event feeds and support staff.
- Response times
This is where you should document the expected turnaround times for reported issues with event feeds.
- Escalation
Document how cases will be escalated, including to whom they will be escalated, when, and under what conditions. This section should also include information about how requests are prioritized.
- Maintenance and service changes
Document the expected maintenance schedule (e.g., “every Sunday from midnight to 3:00 a.m.”), as well as a process for communicating changes to the event feeds.
- Pricing
If your company uses a chargeback system, or if an outside organization maintains your event feeds, you may need to document the pricing for various services in this section. This should include a process for how rates are set, as well as a catalog of charges that the client should expect.
- Reporting, reviewing, and auditing
Document the start/end dates for your agreement, and include a regular review process and owner. Note the dates in this section for the next review, the previous review, and so on. This section should also note the official electronic “home” of this document.
- Associated policies and processes
It’s important to link this agreement to specific policies about event recording, configuration management, and security.
You’ll find a sample SLA for supporting NIDS feeds in Appendix B.
Automated Configuration Management
SLAs are an effective means of maintaining agreements, but they’re only as reliable as the human beings who maintain them. An important supplement to maintain sound configuration for collecting security events is to maintain your device configurations with automated tools. For example, if you run Red Hat Enterprise Linux (RHEL) servers, you’re probably already using the Red Hat Network (RHN) to download and apply package updates. You also can use RHN to push configuration files to managed servers. Such a configuration service allows administrators to deploy packages based on a “template” for system configurations, ensuring that all managed systems have correct settings applied for firewall settings, logging, user authentication, and so on. For Windows servers, Active Directory (AD) domains allow server configurations to be maintained and managed with Group Policy Objects (GPOs). You can even develop your own tools with a bit of shell scripting and some SSH trusts.
For example, to maintain reliable security events from your Unix servers, use a template like the following one for syslog.conf, to ensure that the correct events are logged and sent to your log collection server (in our example, the collection server is at 10.83.4.102):
# Sample section of syslog.conf to enable remote logging
local2.notice   /var/log/sudolog
local2.notice   @10.83.4.102
local3.info     /var/adm/ssh.log
local3.info     @10.83.4.102
local4.info     /var/adm/tcpwrap.log
local4.info     @10.83.4.102
local7.info     /var/adm/portsentry.log
local7.info     @10.83.4.102
*.err;kern.debug;daemon.notice;mail.crit        @10.83.4.102
auth.notice     /var/log/authlog
auth.notice     @@10.83.4.102
At Cisco, for example, we use something called autoconfig templates. This allows us to deploy a set of approved templates to our network devices. To ensure that we have the security feeds we need, we could build a “security event template” to make sure NetFlow and event logs are sent to the appropriate event collectors. A template for NetFlow feeds might look like this:
# Setup NetFlow export to our NetFlow collector at 10.83.4.99
ip flow-export source Loopback0
ip flow-export version 5
ip flow-export destination 10.83.4.99 2055
A template for syslog events would look like this:
# Setup logging for certain events to our event log collector at 10.83.4.102
logging facility auth
logging facility daemon
logging trap informational
logging host 10.83.4.102
If you wish to use off-the-shelf products to automate the configuration of your network devices you could use Cisco Network Compliance Manager, or Cisco Security Manager which manages configuration of security devices.
Monitor the Monitors
If you’ve worked in information security for long, you’ve noticed a phrase emerge over the past few years: “watching the watchers”. The idea is to keep an eye on your privileged users—the ones maintaining the systems for common users. We must apply the same concept here: to make sure the systems used for conducting security monitoring are reliably maintained. Without that assurance, critical security events may be lost or deliberately suppressed.
To effectively monitor the health of your monitoring system, you must first set a benchmark for “normal” activity. As Æleen Frisch writes in Essential System Administration: “As with most of life, performance tuning is much harder when you have to guess what normal is. If you don’t know what the various system performance metrics usually show when performance is acceptable, it will be very hard to figure out what is wrong when performance degrades. Accordingly, it is essential to do routine system monitoring and to maintain records of performance-related statistics over time.”[56]
You’ll use this benchmark to compare recent activity and determine whether anything has changed, and whether that change requires attention. For example, if you know that your NIDS normally sustains 400 Mbps of traffic, a sudden, sustained drop to 5 Mbps should cause you to take note and look for problems on the network or the devices. If you normally receive 150 messages per hour from your Windows domain controller, you’ll want to be notified if the rate has dropped to 0 in the past 60 minutes.
In this section, we’ll discuss how to keep your monitoring systems running smoothly by tracking the system health (CPU, memory, disk, etc.), as well as each event feed. We’ll discuss each type of system (NIDS, server, and database), along with specific checks for each type of system, to keep them reporting reliably.
Monitor System Health
The systems that generate and feed events necessary for security monitoring must be monitored themselves; if they’re not functioning properly, they can’t continue sending events. System load, disk space, and built-in hardware sensors should be observed to provide early warning of present or imminent failure. To monitor overall system health, observe the following system indicators, measuring them against your “normal” benchmark.
Monitor system load
Take snapshots of system load at regular intervals (spaced a few
seconds apart) to trend and watch for spikes. This includes snapshots
of CPU performance such as what you can see with uptime, procinfo, or w:
[mnystrom@blanco-rich-1 ~]$ uptime
 07:25:11 up 32 days, 17:04,  1 user,  load average: 0.01, 0.02, 0.00
It turns out that different types of systems compute this number differently. Linux does not take into account the number of processes waiting for the CPU, whereas HP does. Therefore, you’ll want to understand how the number is calculated before you set alerting thresholds. However, it’s fair to say that if the system is running normally when the load is less than 1, seeing it spike to 4 or 5 indicates that something has drastically changed, and you’ll want to look into what’s causing the spike.
Monitor memory
Watch memory to ensure that you aren’t exhausting all of your
free or swap memory. It’s good to check memory utilization against
what’s “normal,” but some processes grow over time. At the very least,
check to make sure you don’t run out of physical or swap memory. On a
Unix machine, you can check this with commands such as top, free, and meminfo.
Monitor disk space
Watch available disk space to ensure that there’s adequate room
to store collected events. Keep an eye on space utilization in the
partition where you’re collecting data, and where the system must keep
disk space available to function properly. You can check available
disk space on a Unix server with the command df. Beyond just having disk space available,
you’ll also want to ensure that the space is writable.
Monitor network performance
Check network performance and throughput to ensure that security
events aren’t overwhelming your network interface. You can check this
on Unix (as root), with the ifconfig command:
bash-3.00$ sudo ifconfig
Password:
eth0      Link encap:Ethernet  HWaddr 00:1E:0B:34:9F:D7
          inet addr:10.83.4.102  Bcast:10.83.4.255  Mask:255.255.255.0
          inet6 addr: fe80::21e:bff:fe34:9ee7/64 Scope:Link
          UP BROADCAST RUNNING MULTICAST  MTU:1500  Metric:1
          RX packets:20892745 errors:0 dropped:0 overruns:0 frame:0
          TX packets:12713946 errors:0 dropped:0 overruns:0 carrier:0
          collisions:0 txqueuelen:1000
          RX bytes:2754879057 (2.5 GiB)  TX bytes:1151366228 (1.0 GiB)
          Interrupt:209
Verify that you’re not seeing errors on the interface by inspecting the errors section of the output.
To continually monitor your systems, you should program these commands to run at frequent intervals, benchmarking them against normal values. We’ll describe an approach for accomplishing this later in Automated System Monitoring.
Now that we’ve discussed how to monitor the health of your systems, we’ll address how you should monitor each type of device to ensure a continual stream of events.
Monitor the NIDS
When functioning properly, a NIDS is one of the best event sources for security monitoring. To function properly, a NIDS must have bidirectional visibility to the network segments it monitors; it must be able to fully inspect every single packet on the wire. To maintain your NIDS so that you have an uninterrupted stream of events, you must be sure that a number of areas are working properly: monitor the traffic feeds, sensor processes, and recent alerts generated to ensure that the NIDS is performing as expected.
Monitor traffic feeds (uplinks)
To ensure that you’re getting traffic to your NIDS, watch the ports feeding into it. If your NIDS is configured to receive traffic via a SPAN port, watch the SPANs to ensure that they’re still pointed to your NIDS. (Occasionally a network engineer will “steal” the SPAN port to troubleshoot other problems. She may forget to reset the configuration for your NIDS.) Alternatively, if you’ve deployed your NIDS in the line of traffic (inline), watch the traffic rates to ensure that nothing has been interrupted. It will be obvious if your NIDS is no longer receiving traffic, as all downstream traffic will also be interrupted.
Note
MRTG is an excellent open source tool for watching traffic volumes. It uses Simple Network Management Protocol (SNMP) for status updates on the monitored device. If MRTG shows a sudden drop in network traffic for your NIDS, it’s likely that you’ve lost a traffic feed.
To ensure that your routers are still configured to send traffic
to your NIDS, you must watch the SPAN configuration on the routers
themselves. If you analyze the configuration of the monitor sessions
on the router, you should see that it remains configured to mirror
traffic to your NIDS. The best way to ensure that it’s working
properly is to document the output of the working configuration, and
compare it to the running configuration at regular intervals. For
example, here’s the output of show
monitor on an IOS 12.2 router:
blanco-dc-gw1>show monitor
Session 1
- ---------
Type                   : Local Session
Source Ports           :
   Both                : Gi1/1
Destination Ports      : Gi3/11


Session 2
- ---------
Type                   : Local Session
Source Ports           :
   Both                : Gi1/2
Destination Ports      : Gi3/12
In this example, a NIDS is connected to port Gi3/11 on Session 1 and Gi3/12 on Session 2.
Monitor sensor processes
Even if traffic is reaching your NIDS, you must be sure it can
process the events. The NIDS will have some processes responsible for
receiving and analyzing events, which must be kept running to continue
analyzing traffic and raising alerts. You should watch the sensor
processes to be sure they’re running normally. For example, on a Cisco
NIDS, the Analysis Engine must be running for the sensor to process
events. In a Snort deployment, it’s the snort process that’s critical. You may wish
to add further checks to ensure that the required processes are not in
a “zombie” state, and that they’re getting sufficient CPU
time.
Monitor alerts
If your router is sending traffic to the NIDS, and the processes are running normally, everything is probably working fine. One further check that you can add is to ensure that alerts are being generated. To do so, watch the alerts coming from the NIDS to ensure that you’ve received at least one alert within the past few minutes. On many networks, a properly tuned device will still generate events very frequently, so if you’ve not seen a single event within the past 30 minutes, something is definitely wrong.
Monitor Network Flow Collection
As we described in previous chapters, Cisco NetFlow is a popular open standard for recording network flows. We recommend capturing such flows for analysis, for monitoring, and as a secondary source to support investigations. To ensure that your network flows are flowing, monitor the collection servers to make sure you’re getting the amount of data you expect from the places you expect. You should monitor the system used to collect the flows, the processes that collect and store the flows, the network traffic along the segments in your network, and the routers sending NetFlow to your collection system.
Note
We recommend collecting NetFlow from routers that act as choke points on your network. Typically, such choke points are deployed where you’re already doing traffic filtering, such as the corporate Internet connection, data center gateways, and gateways to specialized networks for partners or labs.
Monitor system health
Most importantly, the network flow collector must itself be watched to ensure that it can receive, store, and relay flows properly. This requires “health monitoring,” as we expounded earlier in this section. Health monitoring checks that the collector can keep up with incoming data, and that the disk space and permissions are properly configured so that captured flows can be properly stored.
Monitor traffic feeds from routers
There’s more than one way to monitor for flows coming in from
each router you’re expecting. It’s most important to watch that the
sending routers are configured to send flows to your collector. On
each router, verify that the ip flow
export command is properly configured. For example, here’s
the NetFlow configuration on a Cisco IOS 12.2 router. It’s configured
to export NetFlow v5 to our collector at 10.83.4.99 on port
2055.
blanco-dc-gw1>show ip flow export
Flow export v5 is enabled for main cache
  Exporting flows to 10.83.4.99 (2055)
  Exporting using source interface Loopback0
  Version 5 flow records, peer-as
  327844689 flows exported in 10928453 udp datagrams
  -- output clipped for brevity --
You should also confirm that NetFlow is being exported from the
proper interface (in the preceding example, it’s exporting via the
Loopback0 interface). If you check
this again in a few seconds, you should see the number of exported
flows increasing, indicating that it’s still exporting
properly.
Monitor collector network configuration
Now that you’ve checked the configuration from the routers, you
should also check the collector to be sure it’s listening to receive
flows, and that they’re being received. Assuming the collector is
running Unix, simply use netstat to
check that the collector is listening for NetFlow traffic on the
proper port by “grepping” for the correct listening port:
[mnystrom@blanco-dc-nfc-1 ~]$ netstat -l | grep 2055
udp        0      0 *:2055                      *:*
You’ll also want to see whether you’re receiving traffic from
each router. One technique is to create iptables
rules on the collector itself, adding an entry for each router from
which you expect to receive NetFlow. For example, if you want to
monitor the amount of traffic you’ve received from two gateway
routers, add ACCEPT rules for each
router to the iptables INPUT
chain:
[root@blanco-dc-nfc-1 ~]# iptables -vL INPUT
Chain INPUT (policy ACCEPT 9875 packets, 14M bytes)
 pkts bytes target     prot opt in     out     source      destination
-A INPUT -s 10.83.4.1 -p udp -m udp --dport 2055 -j ACCEPT
-A INPUT -s 10.83.4.2 -p udp -m udp --dport 2055 -j ACCEPT
ACCEPT
COMMIT
Note
A typical use for iptables is to filter
traffic by including a DROP
statement somewhere in the chain, to dictate that any traffic not
explicitly allowed should be blocked. Because you’re using
iptables only to keep count of traffic from each
source, you don’t need to include a DROP rule in the configuration file unless
you want to filter traffic.
The iptables chain in the preceding code is
“accepting” connections from gateways 10.83.4.1 and .2 (corresponding
to blanco-dc-gw1 and gw2, respectively). You can periodically run
iptables -VL INPUT, to see how many
bytes and packets have arrived from each accepted host in the chain.
Simply compare those numbers with the ones from a few minutes ago to
prove that you’re getting traffic from each source:
[root@blanco-dc-nfc-1 ~]# iptables -vL INPUT
Chain INPUT (policy ACCEPT 9875 packets, 14M bytes)
 pkts bytes target prot opt in  out  source        destination
  159  230K  ACCEPT udp  --  any any  blanco-dc-gw1 anywhere udp dpt:2055
 4692 6776K  ACCEPT udp  --  any any  blanco-dc-gw2 anywhere udp dpt:2055
The preceding output proves that you’ve received 159 packets and
230,000 bytes since the last flush of the counters. Once you’ve
checked these numbers, flush the counters so that you can see whether
you’re accumulating flows at the next read. You can do this easily
with the “zero counters” option on the iptables command (indicated in the following
code by the –Z option):
[root@blanco-dc-nfc-1 ~]# iptables -vxL -Z INPUT
Chain INPUT (policy ACCEPT 273 packets, 130896 bytes)
 pkts bytes target  prot opt in  out  source         destination
  43 64156  ACCEPT  udp  --  any any  blanco-dc-gw1  anywhere udp dpt:2055
  11 16412  ACCEPT  udp  --  any any  blanco-dc-gw2  anywhere udp dpt:2055
Zeroing chain 'INPUT'
Monitor collection directories
To prevent a problem where routers are sending NetFlow but you’re not able to store it, check the directories where NetFlow is stored to be sure permissions are set properly. For example, to check the /apps/netflow directory on a Unix box, check that the write bit is properly set for the user writing the flows:
[mnystrom@blanco-dc-nfc-1 data]$ ls -l /apps/netflow
total 12
drwxr-xr-x  243 netflow infosec 12288 Jul 28 09:41 data
In the preceding example, you can see that the netflow user (the owner of the file) has
full permissions on the data file,
so the file system is properly configured. This is a good place to
verify that datafiles have been written to the collection directory
within the past few minutes.
Monitor collection processes
Once you’ve verified that the system can receive flows and that data is coming from the routers, you should ensure that the processes used for collecting and storing (and, if applicable, relaying) NetFlow are running, and that they haven’t failed or gone into a zombie state. To check processes, run a command on the operating system to see whether all the correct processes are running. Of course, you’ll first need to know which processes should be running, and how many of them.
[mnystrom@blanco-dc-nfc-1 ~]$ ps -ef | grep netflow
netflow  29982     1  0  2007 ?        1-09:34:16 /usr/local/netflow/bin/flow-
capture -w /apps/netflow/data -E54G -V5 0/0/2056 -S5 -p /var/run/netflow/flow-
capture.pid -N-1 -n288
netflow  29999     1  0  2007 ?        05:32:35 /usr/local/netflow/bin/flow-fanout
0/0/2055 0/0/2056 10.71.18.5/10.71.18.6/2055
In the preceding example, one flow-capture and one flow-fanout process is running. With OSU flow-tools, these processes are used to receive and store data to the local system, and relay them out to other systems.
Maintain flow retention
Many collection tools provide a means for keeping storage within
the bounds of available disk space by rotating out older data. With
OSU flow-tools, the flow-capture process allows you to set the
expire size or expire count
for flows. These settings allow you to set a limit on how many flows
you want to keep, or how much space you want to use for storing flows.
Assuming, for example, that you want to keep as much data as possible
within 1 TB of disk space, you could use the option -E 1024G on flow-capture. This option tells
flow-capture to throw away the oldest flows in order to keep within
the 1 TB (1,024 GB) disk space limit.
The knowledge that you have a full tool chest is useless without the accompanying knowledge of which tools are contained within. Likewise, you’ll want to know just how far back your NetFlow records go, so you can support necessary investigations and monitoring. If your collection directories are named by date, your job is an easy query against directory names. If not, simply finding the date of the oldest directory in your collection should show you how far back you can query NetFlow records.
Monitor Event Log Collectors
Like network flow collectors, event log collectors run software for gathering and forwarding event logs. To keep events flowing to security monitoring systems, and to ensure that downstream systems are not kept waiting for events routed through event log collectors, monitor system health as well as the health of collection and relay processes. Most importantly, you’ll need to watch the event flow coming from originating devices to prevent event gaps in your monitoring.
Monitor system health
Monitor system health using the same approach used for NetFlow collectors. Verify that the collector is functioning properly and has enough memory, that load is sufficient for processing, and that the disk can handle more incoming data.
Monitor collection processes
For event collection to work properly, the system processes used
for receiving and storing events must run constantly, listening for
relayed events. For example, when using syslog-ng
for collecting event logs, the syslog-ng process
must be listening for relayed syslog, normally via the standard syslog
port of UDP/514. To check whether the process is running and listening
on the correct port, use netstat to
check for running UDP listeners and what processes are bound to those
ports. You can do this with the -a
option to show all connections, along with the -p option to show programs bound to
ports:
[mnystrom@syslog-blanco-1 ~]$ sudo netstat -ap | grep syslog
tcp 0   0 0.0.0.0:514        0.0.0.0:*        LISTEN      1813/syslog-ng
udp 0   0 0.0.0.0:514        0.0.0.0:*                    1813/syslog-ng
udp 0   0 10.83.4.102:32851 10.71.180.220:514 ESTABLISHED 1813/syslog-ng
udp 0   0 10.83.4.102:32873 10.70.149.28:516  ESTABLISHED 1813/syslog-ng
unix  10  [ ]  DGRAM           4663   1800/syslogd        /dev/log
Note
You must run this command as a privileged user (root on Unix), to see the status of ports < 1024.
Based on the output from the preceding netstat -ap command, we can see that
syslog-ng is listening for syslog,
as we expect.
syslog-ng can handle listening for incoming
syslog as well as storing it and relaying it to other servers. This is
accomplished within one process, so there’s no need to monitor other
processes on this host. Alternative event collection systems may use
more processes in collecting and storing events. For example, Splunk,
a commercial flexible analysis tool for events, requires processes for
receiving events, helper processes, a watchdog process, and a web
server.
Monitor collection directories (logs)
You must watch the systems that are originating events to the log collector to ensure that they’re still sending data. There are a number of ways to oversee these event streams to ensure that they’re still flowing, but the most painless method is to watch the growing logfiles, checking for recent events from each system.
Begin with a list of hostnames from which you’re expecting
events, and then check the event logs for recent events from such
systems. Count any recent event as a “heartbeat” from the source
system, indicating that it’s still sending events. There’s no need to
evaluate the type of message that arrived from the source system; its
recent timestamp is enough to indicate that the event feed is
functioning. To check for a recent message from a source, search
through the directory of collected logs. This may be a simple exercise
if the directory is organized by event source, but if you’re using
syslog-ng, you’ll have to slog through the mass of
data to find the recent messages.
Let’s say it’s August 9 at 2:59 p.m., and you want to check for
a message from the webserver-1 server within the
past hour. Using egrep (extended
grep) on a Unix system, you can construct this search to find
something within the hour of 14:00, across all logfiles in the current
directory:
egrep "Aug 9 14:.*webserver-1" /apps/logs/all-*
The egrep command tells the
Unix server to run a regular expression match against the files. The
.* between the date and the server
name is a regular expression telling egrep to ignore everything between the date
format and the server name. Even a single message within the past hour
is an indicator that the server is running and sending events to the
collector, as we expect.
Note
This works only if the sending server and the event collector are time-synchronized. If they’re not, none of the monitoring in this chapter or book will work for you, as you can’t correlate events. To synchronize time on your servers, use Network Time Protocol and a common time offset (we suggest GMT).
Monitor network traffic
Watch the network interface card (NIC) for messages arriving
from the source system. The setup works as we described in Monitor Network Flow Collection. Create an
iptables configuration with an ACCEPT rule for each source server. Monitor
the accumulated packets for each rule in iptables,
flushing each time you check the table.
Audit configurations
Technically, auditing isn’t active monitoring, but the servers originating events to your collector require a configuration that will capture the correct events and relay them to the proper collector. To maintain the correct configuration on systems, deploy an auditing solution that can check its logging configuration against a reference template. Check for the following two configuration directives in the system’s log configuration:
Is the relay set to the IP address of your event collector?
Are proper event types being logged?
A simple script to access the source server and grep the syslog.conf might include a check such as
this:
$ ssh webserver-1 grep 10.83.4.102 /etc/syslog.conf
*.*                            @10.83.4.102
This checks the webserver-1 server for the presence of the 10.83.4.102 collection server in the syslog.conf file, and finds it in the response.
Maintain log retention
Just as we described in Monitor Network Flow Collection, it’s vital to make sure
your event collection doesn’t overrun the available disk space. You
can monitor this by watching available disk space (covered in “Monitor
system health”), but you’ll need to proactively rotate your collected
logs, expiring the oldest content to make room for new events. This
feature is not native to syslog-ng, so you’ll need
complementary tools to accomplish it. The most common pairing is
logrotate, a freely available Unix utility authored by Erik Troan of
Red Hat. This utility is scheduled to run as a daily cron, archiving
logfiles by rotating, compressing, and deleting them.[57]
Monitor Databases
Databases can be critical sources of security events, especially on systems that store sensitive data. To ensure that they keep a continuous flow of messages, monitor the processes that record events in the database, and monitor the storage locations for the events, to make sure new messages are showing up. This section explores techniques for monitoring database settings for auditing and logging.
Monitor Oracle
You can configure Oracle to record a wide variety of events. To make certain Oracle is properly capturing an audit trail, you must ensure that events are being logged properly and that audit settings are properly set. As an additional precaution, configure the database to capture administrative events to audit DBA activity.
Maintain Oracle systemwide audit settings
To enable event logging in Oracle (Oracle calls it “auditing”),
you must set the audit_trail
parameter in the init.ora file.
The database references this core configuration file at startup, and
specifies whether to log events to the Oracle database (audit_trail = db or audit_trail = true) or to a logfile
(audit_trail = os) on the host file
system.
As an added step, routinely check the configuration files to be
sure the Oracle database remains properly configured for logging. From
the database, you can ensure that systemwide auditing is turned on by
checking the v$parameter
table:
select NAME, VALUE from V$PARAMETER where NAME like 'audit%';

NAME                           VALUE
------------------------------
audit_trail                    DB
audit_file_dest                ?/rdbms/audit
Here you can see that the administrator has configured init.ora with audit_trail = db, and that audit data will
be written to the database’s audit area (SYS.AUD$).
Monitor Oracle audit events
Should you decide to collect events to the file system, it’s
easy to relay those logs into your event log collection server.
However, if you want Oracle to record events to the SYS.AUD$ table, you must keep watch over
that table to confirm that new events are arriving regularly. For
example, here’s a simple query to check for new events arriving every
five minutes:
select count(*) from SYS.AUD$
where (current_timestamp - aud$.timestamp#) > 5*1/24/60
If the query returns a count greater than zero, you’ve confirmed
that some events have been received within the past five minutes. To
be sure you’ve received audit events of a certain type (for a specific
table, column, user, etc.), simply add criteria to the where clause in the preceding query.
Maintain Oracle audit settings on objects
If events are captured in the SYS.AUD$ table (or the file system,
depending on how Oracle is configured), you can have confidence that
the system is configured to properly log events. However, because
configuration changes can disrupt the flow of events, it’s useful to
monitor Oracle’s audit settings to be sure you’re capturing audit
events.
When you configure auditing on a table, Oracle stores the
setting in metadata. The DBA_OBJ_AUDIT_OPTS view lists these
settings, cross-referencing all objects with audit settings for every
possible statement. You should regularly query this view to verify
that audit settings are correct. For example, to ensure that auditing
is still enabled for successful and unsuccessful queries against the
CUSTOMERS table (where Social
Security numbers are stored), issue the query:
select SEL from dba_obj_audit_opts
where object_name = 'CUSTOMERS';
If it’s properly configured for auditing, it should return:
SEL
---
A/A
This shows that auditing is enabled for both successful and
unsuccessful SELECT statements
against that table.
Monitor administrative privileges
It’s considered a best practice to ensure that event logs are
immutable so that a malicious user cannot cover her tracks by
modifying them. Because a DBA has superuser privileges, she will
always be able to modify the SYS.AUD$ table. Two simple configuration
directives will record DBA activity and provide a record of any
attempt to remove data from the auditing table.
First, set a directive to capture all changes to the SYS.AUD$ table. Connect as SYSDBA and modify the SYS.AUD$ table with this statement:[58]
audit ALL on SYS.AUD$ by access;
This will ensure that every operation against the SYS.AUD$ table—including delete and
truncate—are inserted into the SYS.AUD$ table as audit entries. If a DBA
tries to cover her tracks by deleting entries from the table, those
actions will be logged into the table itself!
You should also provide an off-database log of DBA activity. To do so, turn on file-based auditing of DBA actions by adding this configuration directive to init.ora:[59]
AUDIT_SYS_OPERATIONS = TRUE
This will configure Oracle to log all SYS operations (including SYSDBA and SYSOPER) to the operating system logfile,
which, if the system is configured correctly, is off-limits to the
DBAs.
Monitor MySQL Servers
The current version of MySQL (5.x) has limited options to enable
auditing. SQL query statements are logged in the “general query”
logfile. This is enabled if you specify the --log option when starting the database. To
ensure that messages are still being written to the general query log,
simply watch recent entries to the mysqld.log query logfile, which shows recent
events:
080228 15:27:50   1170 Connect user@host on database_name
                  1170 Query   SET NAMES "utf8"
                  1170 Query   SELECT something FROM sometable WHERE some=thing
                  1170 Quit
Watching this file allows you to verify that queries are still being written to the logfile.
Automated System Monitoring
So far, this chapter has illustrated manual techniques to monitor and maintain event feeds for NIDS, event collectors, and databases. However, automation is the key to sustaining a continuous stream of events for security monitoring. In this section, we will examine a few commercial and open source tools available for network and system monitoring, applying them to keep dependable event streams for security monitoring.
Traditional Network Monitoring and Management Systems
Network monitoring systems are types of network management systems. Monitoring is conducted by agents running on “end stations” (the systems being monitored). These end stations are observed by management entities that are programmed to respond to the agents.[61] These tools are designed to monitor system health, though new functions are constantly being introduced into such software.
Network monitoring has been around for decades, notably in the form of HP OpenView Network Node Manager (NNM), which uses SNMP (along with other technologies) to maintain visibility into system health. OpenView presents a dashboard overview of all managed devices, using varying colors to illustrate their health and event status. Competitors include IBM Tivoli Monitoring, CA Unicenter TNG, and Microsoft SMS. It’s hard to pin a name on such products because many of them handle provisioning, health monitoring, inventory, and configuration. Such tools have been used to manage host operating systems, network devices, application software, and databases. In recent years, a number of free open source products have matured to the point that they are now viable alternatives to commercial network monitoring systems, including such tools as Nagios, OpenNMS, Pandora, and Zenoss.
Note
As the systems we’ve described here offer much more than network device monitoring, it’s hard to call them “network monitoring” solutions. We couldn’t find an accepted term that describes more than that, so we’ll just call them “system monitoring” solutions for the duration of this chapter.
How system monitoring works
System monitoring solutions maintain a dashboard that allows an “at-a-glance” view of device status. They track the health and event status of each system using a variety of inputs, and contain the following elements:
Agents can run on the monitored device, such as an SNMP agent reporting to a system monitor or an installed agent. Alternatively, the central monitoring server can probe the device to evaluate output and record the health of the component. Figure 7-2 depicts a traditional network monitoring system.
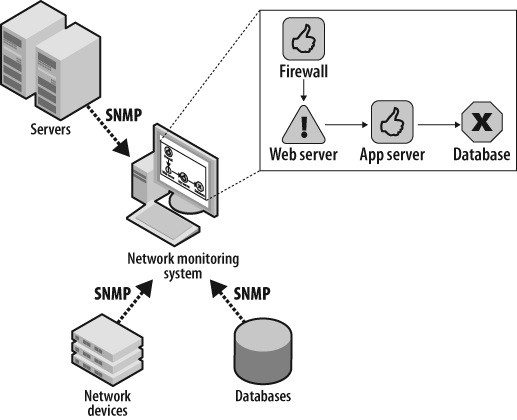
The agents that run in a system monitoring solution check the health of a component or end station. They typically run a script containing commands much like the ones we’ve described in this chapter. For example, an agent could SSH into a server and run a command, evaluating the output to determine whether the system is performing within prespecified boundaries. Alternatively, the agent may run on the monitored device itself, triggering an SNMP trap when CPU utilization crosses an upper threshold.
To leverage such a system for your targeted monitoring event sources, you should configure it to monitor the following:
System health of every device reporting events
Status of accumulating events from each sending device
Status of accumulating events on event receivers
Health of each event collector
Health of each component in detection systems
The status of each item should be represented on the network monitor dashboard, allowing you to observe “at a glance” those areas that require administrative attention.
How to Monitor the Monitors
You’ve likely seen monitoring systems displaying a dashboard on large screens in offices and data centers. What value, however, is such a display without action? Someone must be assigned responsibility to not only view the alerts, but also—and more importantly—take action to address the problems highlighted on the dashboard. Monitoring the status of security event feeds is a task best assigned to the team already conducting security monitoring. These staff members depend on event feeds from the monitored systems, and are in the best position to notice when they go offline.
Many of the system monitoring solutions provide built-in case handling and notation capabilities, allowing staff to track the status of alarms. To use these effectively, establish monitoring procedures that include attention to the system monitoring solution, with documented, assigned responsibilities. Good case handling procedures will allow staff to see the status of such alarms without mistakenly troubleshooting the same problems, duplicating their effort.
Monitoring with Nagios
Nagios, formerly known as NetSaint, is a feature-rich system monitoring package. It displays current information about system or resource status across an entire network. In addition, you can configure it to send alerts and perform remedial actions when problems are detected.[62]
Figure 7-3 is a screenshot of Nagios’s dashboard, giving an overview of the systems being monitored, along with an indication of the status for each device.
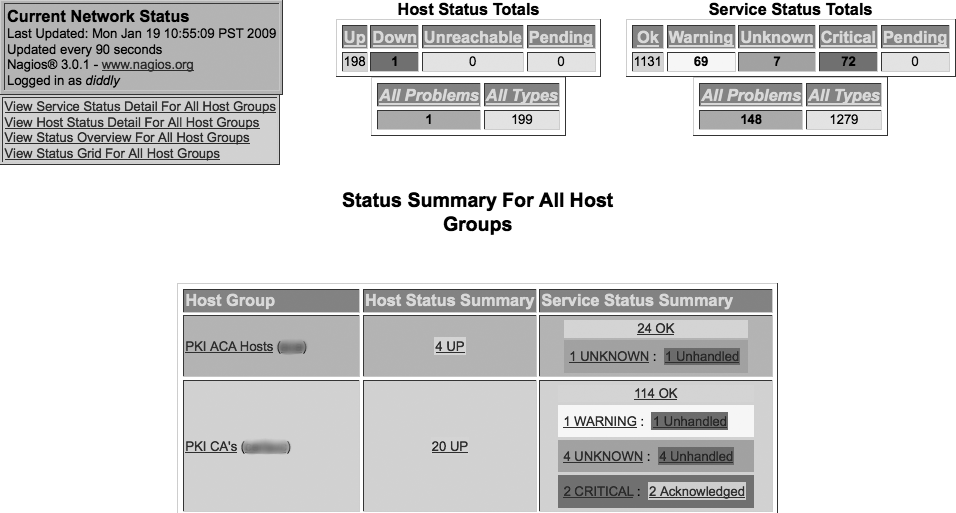
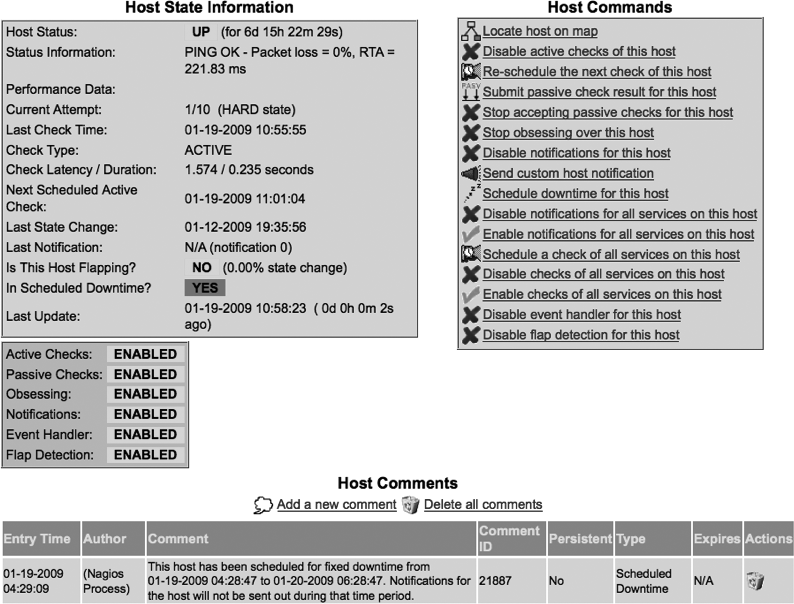
Nagios lists an overall status for hosts and services, along with a summary for each group of servers. When you click on a specific host, Nagios displays a detailed status page for the host (shown in Figure 7-4). This detailed status page specifies monitored aspects, provides a set of available commands for monitoring the host, and provides an interface to make note of issues.
Nagios normally installs scripts on the system to be monitored, allowing the central server to execute scripts via a “plug-in” framework that reports status back to the Nagios server. These scripts check the status of each monitored element within a set of “warning” and “critical” boundaries set for the element. For example, to monitor system memory, a Nagios plug-in allows the administrator to set both a warning and a critical alert, passed as parameters to the script when it starts. Here’s syntax to start a plug-in that checks memory, returning a warning if free physical memory is below 10% of available memory and raising a critical alert if it’s below 5%:
check_mem -w 10 -c 5
Most plug-ins are executed from the Nagios server via NRPE (remote procedure execution) or SSH. For cases where a system cannot be actively polled for its status, Nagios can accommodate a passive check, which allows a script on the monitored system to send its status directly to the Nagios server. In addition, on some of the systems you’ll need to monitor, you will be unable to install any plug-in. For those cases, Nagios can run Expect scripts on the monitored system, connecting via SSH from the Nagios server itself.
The next section will illustrate how you can use Nagios to automate system and network monitoring for Blanco Wireless.
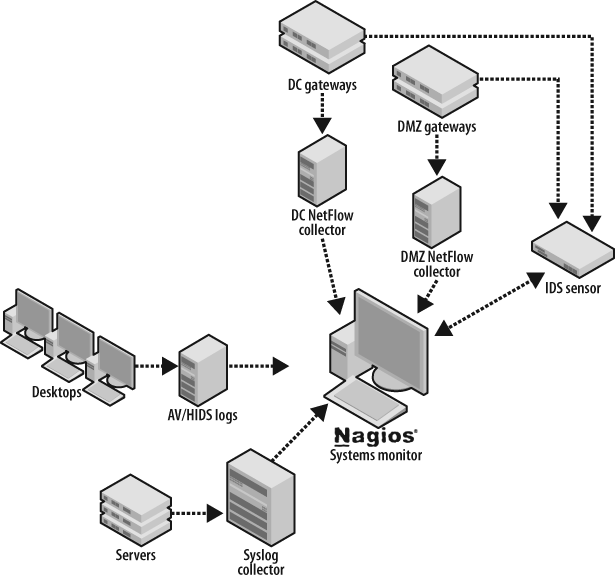
System Monitoring for Blanco Wireless
Blanco Wireless has configured targeted monitoring for its account management system. To monitor the system, Blanco is leveraging the following event sources:
NetFlow collection at the data center and DMZ gateways
Syslog collection from servers
NIDS
Database event logs from the Oracle 10g databases
Using Nagios, Blanco can automate system monitoring to ensure high availability for security monitoring (see Figure 7-5).
Note
Nagios setup and configuration is detailed on the Nagios website at http://www.nagios.org/. Plug-ins and scripts are listed at http://www.NagiosExchange.org/ and http://www.NagiosPlugins.org/.
Monitor NetFlow Collection
The NetFlow collectors for Blanco are running OSU flow-tools for collecting and querying NetFlow records. To ensure continuous flow collection from critical sources (the DC and DMZ gateway routers sending flows to the collectors), Nagios plug-ins are configured to observe the following:
Collectors are continuously receiving flows from both data center and DMZ routers.
Collectors are in good health, so they’re able to receive and store flows properly.
Collection processes are running and functioning properly.
For Nagios to monitor the collectors, Blanco has deployed the NRPE daemon to run directly on the collectors. Blanco has configured the plug-ins to monitor system health and collector processes, and to check that data is still coming from the routers configured to send flows for collection.
Monitor Collector Health
To effectively monitor collector health, Blanco has configured the following series of Nagios plug-ins.
Disk space
Check to be sure there’s adequate disk space by running the check_disk plug-in to watch the collection directory (/apps/netflow/data), warning if less than 10% is available and sending a critical alert if less than 5% is available:
check_disk -w 10 -c 5 -p /apps/netflow/data
Permissions
Ensure that the directory storing flows remains writable for incoming flows:
check_diskrw /apps/netflow/data
Load
Evaluate whether the system load is excessive. Warn if the load exceeds 5, 10, or 15, and raise a critical alert if it exceeds 20, 25, or 30:
check_load -w 15,10,5 -c 30,25,20
Monitor Collection Processes
To make sure the software is continuously collecting and storing flows, watch the file system and processes to make sure they’re doing their job. To accomplish this, watch the following.
Continuous flows
Configure the Nagios check_latestfile plug-in to watch the /apps/netflow/data collection directory. Set the script to warn if the most recent file is more than 30 minutes old. This script does not accept parameters via the command line, so you must edit the script to set the required parameters.
Processes
Ensure that the correct number of collection and relay processes
is running. First, make sure the flow-capture process is running, and that it
raises a critical alert if there isn’t at least one, or if there is
more than five running:
check_procs -c 1:5 -C flow-capture
The parameters described here specify only an upper limit
because the syntax requires us to do so. If you’re running flow-fanout, add another check_procs to watch that process.
Monitor Flows from Gateway Routers
To ensure continuous flow collection, verify that each router is
sending NetFlow to the collector as expected. Blanco could have scripted
a configuration check on each router from which NetFlow is expected.
Instead, it chose to watch the network traffic coming into the collector
to ensure that the traffic is received from each expected router. There
are no Nagios plug-ins to accomplish this, so Blanco has developed a
custom script to watch network traffic via iptables.
The script will read accumulated traffic received in an interval, drop
the results into a file, and periodically push the file to the Nagios
server via its NSCA framework.
Because Blanco is sending DMZ flows to one collector and DC flows
to another, the configurations for monitoring will be identical. Here,
Blanco has built an iptables rule script, using an
“accept” rule for each router expected to send NetFlow. It’s easy to see
the two routers and the port where they’re sending flows—UDP/2055, in
the iptables
configuration:
-A INPUT -s dc-gw-1 -p udp -m udp --dport 2055 -j ACCEPT
-A INPUT -s dc-gw-2 -p udp -m udp --dport 2055 -j ACCEPT
To determine whether traffic is coming from these gateways on the
expected ports (per the iptables configuration), look
at the accumulated packets from each rule on the line next to each
router. Compare that to the values from the last check to determine
whether more packets have arrived. Use the -nvL options on the iptables command and observe the accumulated
packets for each gateway.
root@nfc ~]# iptables -nvL INPUT
Chain INPUT (policy ACCEPT 125K packets, 180M bytes)
pkts bytes target  prot opt  in out   source  destination
21986   32M ACCEPT udp  --   *  *     dc-gw-1 0.0.0.0/0   udp dpt:2055
50059   72M ACCEPT udp  --   *  *     dc-gw-2 0.0.0.0/0   udp dpt:2055
As described earlier in “Monitor collector network configuration,” the script will zero the counters after each check to make comparison easier.
Monitor Event Log Collection
The event log collectors for Blanco are running
syslog-ng. These collectors are receiving syslog from
Unix servers, Windows servers, and the Apache web servers. Blanco must
monitor to ensure that the event logs are in good health, and that event
logs are being collected and stored. Blanco has configured monitoring
for the following:
Collectors are continuously receiving events from all expected servers.
Collectors are in good health, able to receive and store events properly.
Collection processes are running and functioning properly.
Using the NRPE plug-ins, Nagios will execute commands on the syslog collector and process the results on the central server.
Monitor collector health
Blanco will use the same techniques for monitoring collector health that it used for monitoring the NetFlow collector. This will involve watching load, memory, and disk to ensure that the system is functioning normally and can receive and store event logs. Configuration for checking load, memory, and swap will remain exactly the same, but we’ll need to monitor the specific file system directories for syslog collection on this system.
Verify disk space
Check to verify that there’s adequate disk space by running the check_disk plug-in and watching the collection directory (/apps/logs). Warn if there’s less than 20% available, and send a critical alert if there’s less than 10%:
check_disk -w 20 -c 10 -p /apps/logs
Ensure permissions
Ensure that the directory storing logs remains writable so that the events can be stored as they arrive:
check_diskrw /apps/logs
Monitor collection processes
Make sure the syslog-ng
process is running, raising a critical alert if there isn’t exactly
one process running:
check_procs -c 1:1 -C syslog-ng
Maintain continuous logs
Configure the Nagios check_latestfile plug-in to watch the /apps/logs collection directory. Set the script to warn if the most recent file is more than 30 minutes old.
Monitor collection from servers
When storing logs to the file system,
syslog-ng collates the logs from all sources into a
single file during collection. This makes it difficult to discern
whether a recently written file contains events from every source. To
monitor for events from each of Blanco’s monitored servers, Blanco
used the same approach taken with NetFlow monitoring: using
iptables to watch for traffic volume.
The iptables configuration file will look
similar to the one used to watch for NetFlow:
-A INPUT -s webserver-1 -p udp -m udp --dport 514 -j ACCEPT
-A INPUT -s webserver-2 -p udp -m udp --dport 514 -j ACCEPT
-A INPUT -s appserver-1 -p udp -m udp --dport 514 -j ACCEPT
-A INPUT -s appserver-2 -p udp -m udp --dport 514 -j ACCEPT
-A INPUT -s dbserver -p udp -m udp --dport 514 -j ACCEPT
A custom script regularly checks the accumulated data from each
server via the iptables command, subsequently zeroing
the counters in preparation for the next check.
Monitor NIDS
To ensure that Blanco receives a continuous stream of NIDS alerts, Nagios monitors NIDS device health, traffic feeds, sensor processes, and alerts from the NIDS. Because Blanco is using the Cisco NIDS, it’s not possible to run scripts directly on the sensors. All Nagios monitoring is therefore done using Expect scripts on the Nagios server, connecting to the sensors via SSH.
Warning
The sensor must explicitly permit connections from the Nagios server for this to work. This is configured via an access list on the sensor.
Monitor device health
Blanco monitors the health of its sensors using SNMP and
Expect scripts executed via SSH. To monitor the
CPU, Blanco uses a built-in Nagios plug-in called check_snmp, which queries the sensor via
SNMP, sending a warning if CPU usage is above 75%. The -H parameter specifies
the sensor name (ids-1), and the
-o parameter requires the SNMP
object identifier corresponding to a check for the CPU value of the
sensor:
check_snmp -H ids-1 -o "1.3.6.1.4.1.9.9.109.1.1.1.1.8.1" -w 75
To monitor available memory and disk space, Blanco executes an
Expect script via SSH. The script connects to the
sensor and parses the output of the show
version command:
ids-1# show version
Application Partition:

Cisco Intrusion Prevention System, Version 6.1(1)E2

-- output clipped for brevity --

Using 1901985792 out of 4100345856 bytes of available memory (46% usage)
system is using 17.7M out of 29.0M bytes of available disk space (61% usage)
boot is using 40.6M out of 69.5M bytes of available disk space (62% usage)

-- output clipped for brevity --
The script parses the output, raising a critical alert to Nagios if memory or disk space is consumed beyond 90%. In the preceding output, all values are safely below this threshold.
Monitor traffic feeds
Because Blanco’s sensors are receiving feeds directly from
gateway routers, scripts are used to periodically verify that SPANs
are properly configured. This confirms that the routers are properly
enabled to mirror traffic to the sensor. Using
Expect, Blanco scripted a regular comparison of
the show monitor session all
command with a stored baseline. This is best accomplished by storing
an MD5 hash of the command output and subsequently comparing it to the
new value upon each connect. The script raises a Nagios alert if the
hashes don’t match.
Blanco also monitors the percentage of missed packets. If the
value is higher than 10%, it can indicate that the network has grown
beyond the sensor’s capacity to monitor traffic. Using the show interface command, the script parses
the percentage of missed packets from the output:
ids-1# show interface
Interface Statistics
   Total Packets Received = 109049288548
   Total Bytes Received = 67536504907892
   Missed Packet Percentage = 2
   Current Bypass Mode = Auto_off
-- output clipped for brevity --
Note the value Missed Packet Percentage
= 2. Because this value is less than 10, the script will not
raise an alert to Nagios (recall that the script should alert only if
the percentage missed is greater than 10%).
Check sensor processes
Most critically, Blanco wants to ensure that the AnalysisEngine and MainApp processes are running on its CS-IPS
6.1 sensor. If they’re not running, the script raises a critical alert
to Nagios. Using the show version
command, the result is parsed to find an indication that these
processes are running:
ids-1# show version
Application Partition:

Cisco Intrusion Prevention System, Version 6.1(1)E2

-- output clipped for brevity --

MainApp         M-2008_APR_24_19_16  (Release) 2008-04-24T19:49:05-0500   Running
AnalysisEngine  ME-2008_JUN_05_18_26 (Release) 2008-06-05T18:55:02-0500   Running
CLI             M-2008_APR_24_19_16  (Release) 2008-04-24T19:49:05-0500
-- output clipped for brevity --
The preceding output shows the Running keyword on the line with each of the
two critical processes: MainApp and
AnalysisEngine. If the Running keyword is not present, the script
raises a critical alert in Nagios.
Monitor alert generation
Lastly, Blanco wants to monitor the sensors to ensure that they are still generating alerts. To check for recent alerts, the script checks the alert destination—the Security Information Manager (SIM), where alerts are reviewed by the monitoring staff. Blanco’s SIM uses an Oracle database to store the alerts for processing, so the company uses a script to query the pertinent table looking for alerts generated within the past five minutes. If no alerts have been logged within the past five minutes, the script raises a critical alert to Nagios via the NSCA framework.
Monitor Oracle Logging
Because Oracle is configured to send events via syslog to the log collector, there’s no need to directly monitor the databases. Rather, this information is logged via syslog directly to the event collectors.
Monitor Antivirus/HIDS Logging
Antivirus and host intrusion detection system (HIDS) logs are collected to their respective servers using the native facilities of the antivirus and HIDS software. Monitoring collection on those servers is identical to the techniques used for monitoring the syslog collection server.
Conclusion
To this point, you’ve developed the policies upon which you will base your security monitoring, and you’ve mapped your network and infrastructure. Using network metadata as a backdrop for monitoring, you’ve selected monitoring targets, chosen event sources, and fed them into your monitoring systems. This chapter aimed to professionalize your monitoring, preventing gaps that could allow an intrusion to succeed without notice. With these finishing touches in place, you’ve enabled monitoring for your systems with the confidence that events can be collected reliably.
[54] Stoll, C. 1988. “Stalking the Wily Hacker.” Communications of the ACM 31(5): p. 484.
[55] UC Santa Cruz Information Technology Services Services Agreement, 2008.
[56] Frisch, Æleen. 2002. Essential System Administration, Third Edition. Sebastopol, CA: O’Reilly Media, Inc.
[57] See http://linuxcommand.org/man_pages/logrotate8.html for more information.
[58] Loney, K., and B. Bryla. 2005. Oracle Database 10g DBA Handbook. Oracle Press.
[59] Oracle Corporation. 2002. Oracle9i Database Administrator’s Guide.
[60] National Chi Nan University. OSU flow-tools documents; http://163.22.3.90/flow-doc/ (accessed September 18, 2008).
[61] Castelli, M.J. 2001. Network Consultants Handbook. Indianapolis: Cisco Press.
[62] Frisch, Æleen. “Top Five Open Source Packages for System Administrators, Part 4.” O’Reilly ONLamp.com, December 5, 2002; http://www.onlamp.com/pub/a/onlamp/2002/12/05/essentialsysadmin.html (accessed August 25, 2008).