
Breakpoints are stop signs in code where execution is interrupted. When a breakpoint is hit, the application enters break mode. At that time, you can debug the application with a variety of Visual Studio debugger commands and windows. There are different kinds of breakpoints. A normal breakpoint appears as a red circle to the left of the target line of disassembly or source code. Breakpoints also can appear in other places, such as the call stack window.
In the code editor window, pressing F9 sets a simple breakpoint on the current disassembly or source code line. F9 is a toggle, setting or clearing a breakpoint. In addition, clicking in the leftmost (shaded) column sets or clears a breakpoint. When debugging, an application runs until a breakpoint is hit, the application is otherwise interrupted, or the debug session ends. You can continue the application by pressing F5, which functions the same as the Continue Debugging menu command. You also can choose Continue from the Debug menu. Other commands, such as Run To Cursor, also resume execution.
You can also add new breakpoints from the New Breakpoint submenu of the Debug menu. Break At Function adds a function breakpoint. New Data Breakpoint is not available for managed code.
Function breakpoints break immediately prior to the first line of a function and can be set at compile time or run time.
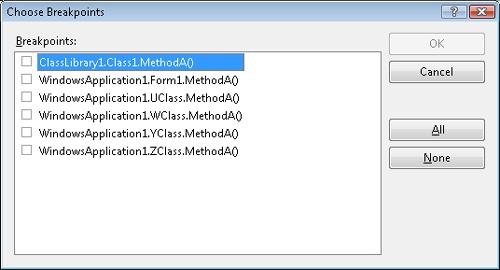
Set a function breakpoint by choosing the New Breakpoint submenu of the Debug menu, then selecting Break At Function. In the example illustrated in the following figures, a breakpoint is set on the first line of the WClass.MethodA function. As a shortcut, select the name of the target function first and then open the New Breakpoint dialog box. The function name appears automatically in the New Breakpoint dialog box, as shown in Figure 15-12. If breaking on an ambiguous or overloaded name, the Choose Breakpoints dialog box opens. In the sample code, MethodA is ambiguous because there are several instances of MethodA in the application, as shown in Figure 15-13. To avoid ambiguity, you can enter the class and method name (Classname.Methodname) or the complete method signature.
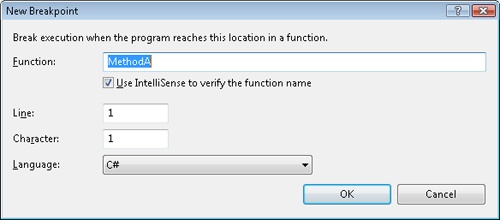
The Use IntelliSense To Verify The Function Name option of the New Breakpoint dialog box displays the Choose Breakpoint dialog box whenever a user enters an ambiguous or overloaded function name. With this option, users also are notified of invalid function names. With the option disabled, an ambiguous function name sets a breakpoint on all functions in the set. In addition, there is no notification of an invalid function name, and the New Breakpoint dialog box simply closes without setting the breakpoint.
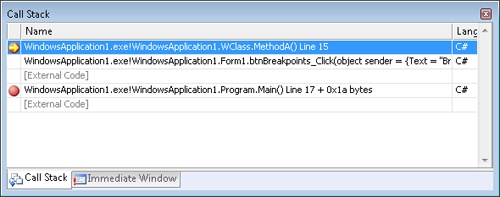
You also can set breakpoints in the Call Stack window, which is available on the Debug menu within the Windows submenu. A function breakpoint on the call stack breaks upon re-entering that method as the stack unwinds. For example, MethodA calls MethodB. MethodB then calls MethodC. A breakpoint then is set on MethodA in the Call Stack window. When MethodB returns and the related stack frame is removed, the application is interrupted on re-entering MethodA. The Call Stack window is available in break mode. Set a breakpoint for a specific method in the Call Stack window using the context menu or the F9 keyboard shortcut. A breakpoint set on MethodA in the call stack is shown in Figure 15-14.
You can manage breakpoints in the Breakpoints window (opened from the Debug menu and the Windows submenu). Figure 15-15 shows the Breakpoints window.
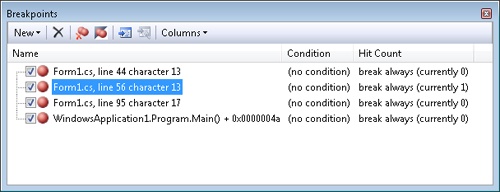
In the Breakpoints window, breakpoints are shown on separate rows. The first column of each row is the enabled/disabled options box. If a breakpoint is enabled, the option box is checked. Clear the option box to disable the breakpoint. The next column is the description and location of the breakpoint. The Condition column shows any conditions set on the breakpoint. The final column shows the hit count. In that column, Break Always indicates that every time the breakpoint is hit, the application is interrupted.
The context menu for an individual breakpoint has several valuable options that affect the selected breakpoint. The Delete command removes the breakpoint. The Go To Source Code command opens the source code where the breakpoint is set. The Go To Disassembly menu command opens the disassembly at the breakpoint. The remaining commands customize the selected breakpoint and are explained in the following sections.
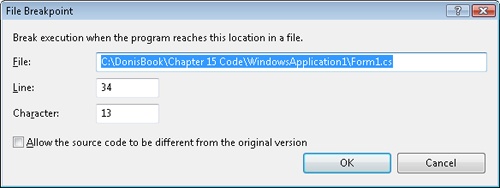
This command changes the location of a breakpoint. You are presented with the Address Breakpoint, File Breakpoint, or Function Breakpoint dialog box, depending on the type of breakpoint. For example, the Function Breakpoint dialog box is displayed when a function breakpoint is selected in the Breakpoints window. The File Breakpoint dialog box, shown in Figure 15-16, is displayed for line breakpoints in source code. A Function Breakpoint dialog box was shown earlier in the chapter (in Figure 15-12).
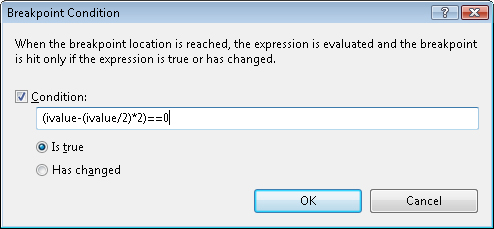
This command sets additional criteria for a breakpoint. There are two ways to set a conditional breakpoint. First, the condition can be a Boolean expression. If the expression is true, the breakpoint is honored. Otherwise, the breakpoint is ignored. Second, the condition can be based on changes to a value. If the value is changed, the breakpoint becomes active.
Look at the following sample code. A breakpoint is set on the single statement in the foreach block. You would like the breakpoint to interrupt only when ivalue contains an even value:
int[] numbers = { 1,2,3,4,5,6,7,8,9,10,
    11,12,13,14,15,165,17,18,18,20 };
int total = 0;
foreach (int ivalue in numbers)
{
    total += ivalue;
}
The Breakpoint Condition dialog box, shown in Figure 15-17, sets the condition to break on even values.
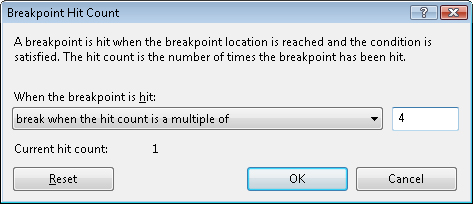
This command sets a breakpoint based on the hit count. Table 15-3 lists the hit count options. The breakpoint count is the number of times the breakpoint has passed, whether honored or not.
Table 15-3. Hit count options
Option | Description |
|---|---|
Break Always | This option means the breakpoint is always active. |
Break When The Hit Count Is Equal To | This option honors the breakpoint when the breakpoint hit count equals the stated value. |
Break When The Hit Count Is A Multiple Of | This option honors the breakpoint when the breakpoint hit count is a multiple of the stated value. For example, a count of four interrupts on every four occasions of the breakpoint: the 4th, 8th, 12th, and so on. |
Break When The Hit Count Is Greater Than Or Equal To | This option honors the breakpoint when the breakpoint count is equal to or greater than the stated value; for example, it honors the breakpoint at counts greater than three. |
The Breakpoint Hit Count dialog box, shown in Figure 15-18, honors the breakpoint at increments of four.
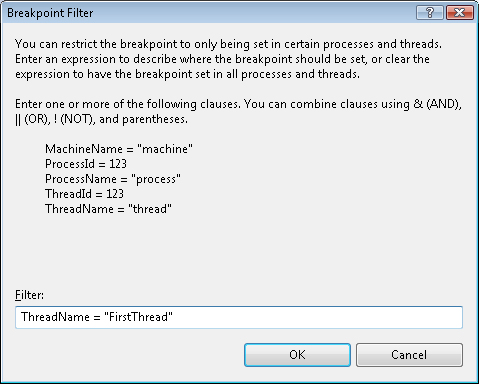
This command sets the affinity of a breakpoint to a machine, thread, or process. The breakpoint interrupts only in the context of the stated filter. Table 15-4 lists the available contexts.
Table 15-4. Filter contexts
Context | Description |
|---|---|
MachineName | The named machine. The break point is honored if the process is running on that machine. |
ProcessId | The process identified by the process identifier. The break point is honored if code is executing in the specified process. |
ProcessName | Any instance of the process name. |
ThreadId | A thread as identified by a thread identifier. The break point is honored if code is executing on the specified thread. |
ThreadName | Any thread with the specified thread name. |
The following code creates two threads that asynchronously execute the same method (MethodA). The threads are named FirstThread and SecondThread. A breakpoint is set on the Thread.Sleep statement in MethodA. As an unfiltered breakpoint, both threads are interrupted—probably alternating between the threads:
private void btnFilter_Click(object sender, EventArgs e)
{
    Thread t1 = new Thread(new
        ThreadStart(MethodA));
    t1.Name = "FirstThread";
    t1.IsBackground = false;
    Thread t2 = new Thread(new
        ThreadStart(MethodA));
    t2.Name = "SecondThread";
    t2.IsBackground = false;
    t1.Start();
    t2.Start();
}

public void MethodA()
{
    while (true)
    {
        Thread.Sleep(3000);
    }
}
To break on the first thread alone, open the Breakpoint Filter dialog box, shown in Figure 15-19. Specify FirstThread as the thread name. Continue the application. Future instances of the breakpoint interrupt on the first thread, but not the second thread.
This command creates a trace point (discussed in the next section).
The Breakpoints window toolbar, shown in Figure 15-20, offers several shortcuts. The buttons on the toolbar are New, Delete, Delete All Breakpoints, Disable All Breakpoints, Go To Source Code, Go To Disassembly, and Columns. The New drop-down list inserts a new function or data breakpoint. As mentioned, data breakpoints are not available in managed code. The Columns button customizes the Breakpoints window, where the developer can choose which columns to display in the window. The rest of the buttons are self-explanatory.
Trace points can print a message (a trace), assign a macro to a breakpoint, or both. There are two methods for setting a trace point. You can set a trace point on an individual line in a code editor window or a disassembly window. Right-click the line of code, select the Breakpoint submenu, and then select the When Hit command. Or right-click the target breakpoint in the Breakpoints window and choose the When Hit command. Either approach opens the When Breakpoint Is Hit dialog box (shown in Figure 15-21), where a trace point is described.
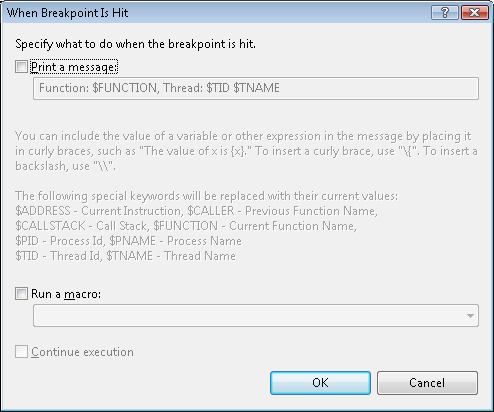
In the Print A Message text box, enter a display string, which is converted and displayed in the Output window. Expressions can be entered within curly braces: {expression}. Special keywords can be used, such as $ADDRESS, $TID, and $FUNCTION, which display the current address, thread identifier, and function name, respectively. There are other options, too. In the Run A Macro edit box, enter the name of a macro. IntelliSense works for macro names. There are predefined macros for most Visual Studio commands. The macro runs when the breakpoint is hit. The Continue Execution option sets a soft breakpoint. When the breakpoint is hit, soft breakpoints do not interrupt the application. However, the message is displayed and the specified macro is run. With the Continue Execution option enabled, the breakpoint appears as a diamond rather than as a red circle.
The statement in the When Breakpoint Is Hit dialog box shown in Figure 15-22 adds two local variables and displays the results in the Output window.
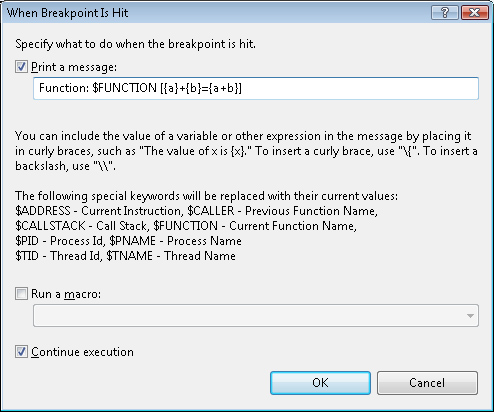
From the trace point shown in Figure 15-22, the following code is displayed in the Output window:
Function: WindowsApplication1.WClass.MethodA() [5 + 10 = 15]
Table 15-5 lists the special keywords that can be used in the Print A Message text box.
Table 15-5. Trace point keywords
Keyword | Description |
|---|---|
$ADDRESS | Returns the address of the current instruction |
$CALLER | Returns the name of the previous function on the call stack, which is the caller |
$CALLSTACK | Returns the call stack |
$FUNCTION | Returns the name of the current function |
$PID | Returns the process identifier of the current process |
$PNAME | Returns the name of the current process |
$TID | Returns the thread identifier of the current thread |
$TNAME | Returns the name of the current thread |
Breakpoints are annotated with icons. The shape of the icon indicates the state of the breakpoint, as described in Table 15-6.
Table 15-6. Breakpoint symbols
Description | |
|---|---|
Filled circle | Signifies an enabled breakpoint, such as a function or location breakpoint. |
Diamond | Signifies a trace point that has the Continue execution option enabled. |
Filled circle with a plus sign (+) | Signifies a filter breakpoint. Filter breakpoints include the Condition, Hit Count, and Filter breakpoints. |
Hollow circle | Signifies a disabled breakpoint. |