
Chapter 12. Performance and Health Monitoring of Virtual Desktop Infrastructure
Virtual Desktop Infrastructure (VDI) performance and health monitoring is a critical part of managing VDI to meet user performance expectations and avoid outages. The Windows Server 2012 R2 operating system includes tools that you can use for troubleshooting performance issues. If you need active monitoring, you can use System Center 2012 R2 Operations Manager. There are unique performance counters that you should monitor for different parts of a VDI deployment. For example, you should monitor different performance counters on a Remote Desktop Session Host (RD Session Host) server than on a Remote Desktop Virtualization Host (RD Virtualization Host) server. In this chapter, you will learn how to monitor VDI performance and health.
Monitoring desktop and application virtualization
Windows Server 2012 R2 includes a number of tools that you can use to view performance information. Event Viewer and Server Manager help you monitor service health. Task Manager, Resource Monitor, and Performance Monitor provide detailed information about the resources that applications and services use, which you can use when troubleshooting. You also can download tools, such as Process Monitor, from Windows Sysinternals that provide even more detailed performance information.
Understanding monitoring for desktop and application virtualization
Most organizations don’t actively monitor standard desktop computers because performance issues are rare and affect only one user. If a single computer, and consequently a single user, has a performance problem, that user calls the help desk for assistance. Computer issues for a single user generally don’t result in significant costs for an organization.
The infrastructure for desktop and application virtualization supports many users. Consequently, a single performance problem or service outage for desktop or application virtualization infrastructure affects many users and might have a large impact on your organization’s productivity. If you monitor your desktop and application virtualization infrastructure, you quickly can identify when performance issues or outages are occurring and resolve them. This minimizes performance issues and outages that affect user productivity.
Desktop and application virtualization infrastructure that you should monitor includes the following:
• Microsoft Application Virtualization (App-V) servers You should monitor App-V publishing servers to ensure that they are available for application distribution. In addition, you should ensure that resources such as the network and disk aren’t becoming bottlenecks in application distribution.
• RD Session Host servers You should monitor RD Session Host servers to ensure that users can access Remote Desktop Services (RDS) session-based desktop deployments. You also can use monitoring to ensure that RD Session Host server performance is adequate. For example, you can monitor resource utilization on a server to ensure that there are no bottlenecks.
• RD Virtualization Host servers You should monitor RD Virtualization Host servers to ensure that users can access personal and pooled virtual desktops. You should use monitoring to ensure that no resource bottlenecks affect the performance of personal and pooled virtual desktops.
• Other RDS roles You also should monitor the availability and performance of other RDS server roles such as Remote Desktop Gateway (RD Gateway), Remote Desktop Connection Broker (RD Connection Broker), and Remote Desktop Licensing (RD Licensing). If any of these server roles is unavailable or suffering from performance issues, it can affect users.
Event monitoring for desktop and application virtualization
You can use event logs in Windows Server 2012 R2 to identify errors that affect application and desktop virtualization. You can use Server Manager in Windows Server 2012 R2 to view the health of server roles. In the Server Manager dashboard, you can see the health of server roles, including RDS. If you click on Events in the RDS area, a window opens that allows you to view Warning and Error events.
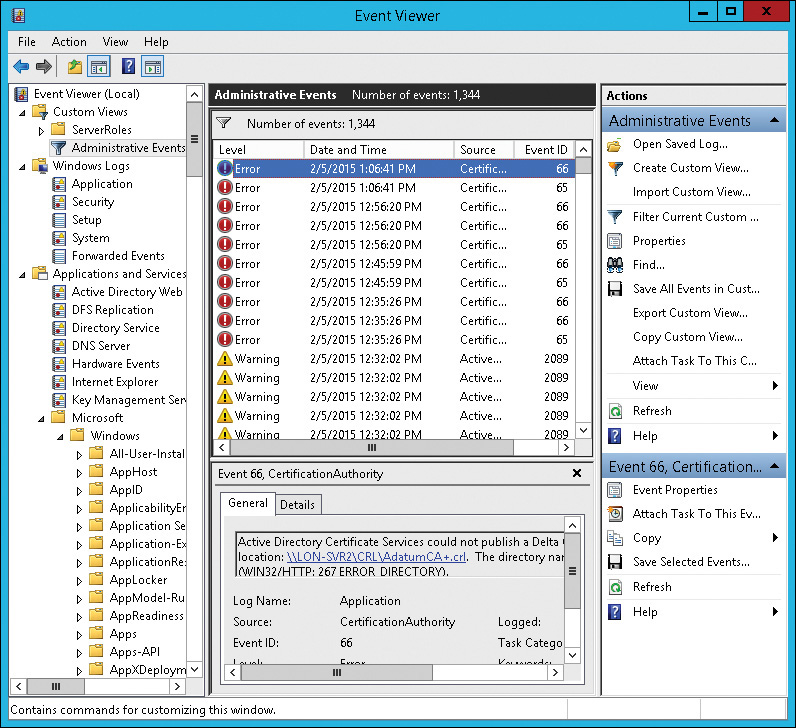
Event Viewer, shown in Figure 12-1, is the most commonly used tool for viewing event logs on a specific server. For basic event log monitoring, you can browse each event log individually. There also is an Administrative Events custom view that you can use to review Error and Warning events quickly. The Administrative Events custom view filters all of the event logs on a local computer and shows all Error and Warning events. You also can create your own custom views to simplify monitoring specific event logs or event sources.
Although it’s most common to use Event Viewer to view event logs on a local computer, you can use Event Viewer from a desktop to view event logs on remote servers. In many cases, this is faster than using a Remote Desktop session to open Event Viewer on a remote computer.
To simplify monitoring event logs on multiple servers, you can configure event log subscriptions. You can use an event log subscription to gather specific events from multiple servers to an event log on a single central server. Then, instead of connecting to multiple servers, you can view and filter events in a single event log on a central server.
Note
Very few organizations use event log subscriptions. Organizations that need to perform event log monitoring across many servers typically use a different tool.
As part of monitoring, you should monitor the System and Application event logs on all servers. The System event log shows generic server-level events such as services starting and stopping and networking configuration. The Application event log has application-specific events from many services. You are more likely to find application-specific events that are useful for troubleshooting in the Application event log.
Windows Server 2012 R2 uses event logs for specific services and server roles. You should include the appropriate event logs for specific services in your infrastructure monitoring for application and desktop virtualization. Some of the service-specific event logs to monitor include the following:
• App-V The most useful troubleshooting information for App-V client connectivity is located in the Applications and Services LogsMicrosoftAppVClientAdmin event log, which is located on the App-V clients. Additional logs that you can use for troubleshooting are on the App-V Management Server:
![]() MicrosoftApp-VServer-ManagementAdmin
MicrosoftApp-VServer-ManagementAdmin
![]() MicrosoftApp-VServer-PublishingAdmin
MicrosoftApp-VServer-PublishingAdmin
![]() MicrosoftApp-VServer-PublishingOperational
MicrosoftApp-VServer-PublishingOperational
• RDS There are several service-specific event logs for RDS. These event logs include logs for RD Licensing, RD Connection Broker, RD Virtualization Host, and other RDS server roles. The names of some event logs are as follows:
![]() Remote-Desktop-Management-Service
Remote-Desktop-Management-Service
![]() RemoteApp and Desktop Connection Management
RemoteApp and Desktop Connection Management
![]() RemoteApp and Desktop Connections
RemoteApp and Desktop Connections
![]() RemoteDesktopServices-RdpCoreTS
RemoteDesktopServices-RdpCoreTS
![]() RemoteDesktopServices-SessionServices
RemoteDesktopServices-SessionServices
![]() TerminalServices-SessionBroker
TerminalServices-SessionBroker
![]() TerminalServices-TSV-VmHostAgent
TerminalServices-TSV-VmHostAgent
• Hyper-V Several event logs that are specific to Hyper-V can be useful when monitoring Microsoft virtual machine (VM)–based desktop deployments of VDI. The Hyper-V event logs include the following:
![]() Hyper-V-Hypervisor
Hyper-V-Hypervisor
![]() Hyper-V-VMMS
Hyper-V-VMMS
![]() Hyper-V-Worker
Hyper-V-Worker
Performance monitoring tools for desktop and application virtualization
Windows Server 2012 R2 includes several tools that you can use to monitor server infrastructure performance for application and desktop virtualization. These tools provide information that can be useful when identifying performance issues. The main drawback of these tools is the lack of centralized monitoring. The tools included in Windows Server 2012 R2 primarily focus on monitoring a local server.
You are most likely to use Task Manager, shown in Figure 12-2, when you need to troubleshoot a performance issue quickly. In Task Manager, you can view which processes run on a server and identify the resources those processes use. When there is a performance issue, you can use this information to identify a process that uses a high level of resources, which might cause the performance issue.
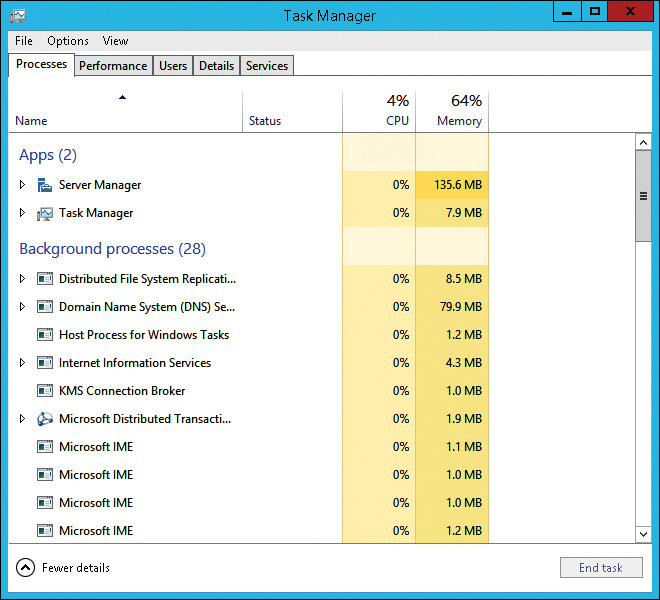
You also can use Task Manager to identify quickly all of the users who are signed in to an RD Session Host server. You can identify the processes that each of these users started. You also can see a summary of the processing and memory resources that each user and each of the user’s processes use. You can monitor additional resources on the Details tab by right-clicking the column headers and selecting additional columns.
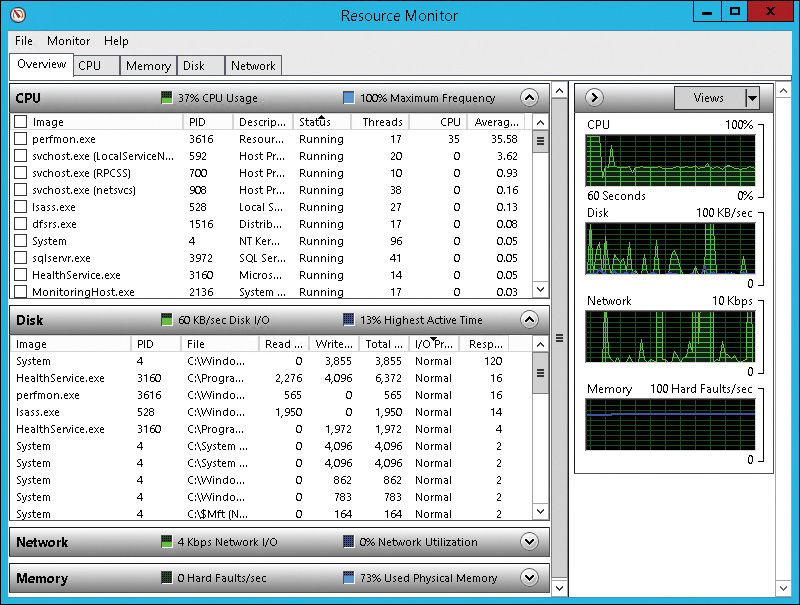
You can use Resource Monitor, shown in Figure 12-3, to view more detailed information than Task Manager provides about processor, memory, disk, and network utilization. For example, you can view disk utilization and identify whether disk I/O is a bottleneck. If disk I/O is a bottleneck, you can identify which processes and files are causing the large amount of disk activity that is slowing down the system. Like Task Manager, you can use Resource Monitor to troubleshoot performance problems when they occur.
You can use Performance Monitor, shown in Figure 12-4, to record and view performance counter values in Windows Server 2012 R2. Many detailed performance counters that you can monitor are available. The performance counters that are available for monitoring vary depending on the server roles that are installed. Some applications also include performance counters as part of application installations. Some commonly used counters relate to central processing unit (CPU) utilization, memory utilization, disk I/O, and network utilization.
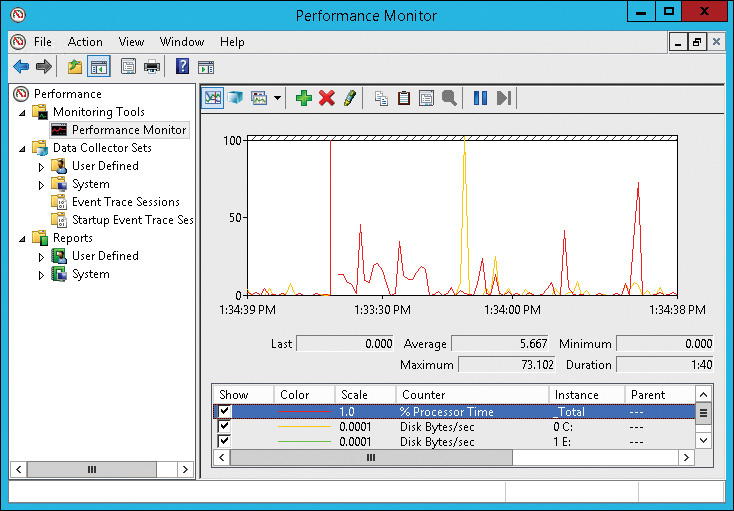
You can view current performance counter values to troubleshoot current issues. For intermittent issues, you can create data collector sets in Performance Monitor. When you create a data collector set, you can define which performance counters are recorded, when performance counter recordings start, the interval for sampling the performance counter, and when performance counter recordings end. After you have recorded data with a data collector set, you can view the data and try to correlate anomalies in the data with performance issues.
Using Process Monitor to identify application issues
Windows Sysinternals is a set of free tools that is available from Microsoft to perform low-level monitoring and troubleshooting of Windows clients and servers. Sysinternals tools are available to monitor and view process activity, disk activity, and security settings. One utility that is useful for identifying compatibility issues with RD Session Host servers is Process Monitor.
Process Monitor is a utility that monitors and logs the activity of processes on a computer system. The activity that you can monitor includes access to the following:
• Registry keys
• Files
• Network
After you capture application activity by using Process Monitor, you can filter it in a number of ways. You can use toolbar buttons to display registry, file, network, and thread activity. If you are investigating a specific application, you can filter activity to show actions that a specific process performs.
When an application isn’t running properly, you can use Process Monitor to identify which action is failing. For example, you might use Process Monitor to identify that an older application modifies information in the HKEY_LOCAL_MACHINE hive of the registry. Standard users don’t have permissions to modify registry keys in this hive. Only administrators typically have access to modify registry keys in HKEY_LOCAL_MACHINE. This means that standard users on an RD Session Host server are unable to run the application.
In this situation, there are several possible solutions:
• Update the application to support standard user permissions Ideally, you can update an application to a more recent version that does not require users to access restricted portions of the registry. But in many cases, this problem occurs in older applications for which there are no replacements.
• Give standard users additional permissions in the registry In some cases, you might be able to update permissions on the registry keys that an application accesses to allow standard users to modify the registry keys. This solution often works on traditional desktop computers, pooled virtual desktops, and personal desktops. However, on an RD Session Host server, you might be allowing multiple users to overwrite information at the same time, which might cause problems for the application.
• Implement the application by using personal desktops On personal virtual desktops, you can give users local administrator permissions to resolve registry permissions issues. You also could use RemoteApp applications on personal desktops instead of providing access to entire personal virtual desktops.
• Implement the application by using App-V App-V virtualizes an application’s registry activity. This functionality isolates application activity from the local operating system and can allow the application to be used on an RD Session Host server.
![]() To download Process Monitor from the Windows Sysinternals, go to https://technet.microsoft.com/en-us/sysinternals/bb896645.
To download Process Monitor from the Windows Sysinternals, go to https://technet.microsoft.com/en-us/sysinternals/bb896645.
Using Operations Manager for monitoring
Most of the monitoring tools included with Windows Server 2012 R2 primarily are used to react when users notify you of performance issues. Operations Manager is part of System Center 2012 R2, and it can monitor servers actively. Active monitoring raises alerts so that you can address problems immediately. You also can monitor resource utilization trends to predict when upgrades are required before performance affects users.
Operations Manager is a monitoring solution for network infrastructure, servers, and applications. You can use it to gather essential monitoring information into a single central console that you can use to track anomalies, such as failed services, and to record their resolution. Actively monitoring your infrastructure minimizes downtime because you can identify potential problems before they affect users. When a problem does occur, you are notified quickly and are given information about the problem almost immediately.
The following are the main functions of Operations Manager:
• Collecting data To support data collection from servers and clients, you need to install the Operations Manager agent. This agent monitors a local system and sends data back to a management server that stores the collected data in a database. The data to be collected is defined based on rules that you can create and modify.
• Generating alerts In Operations Manager, you can define acceptable values for the data that the Operations Manager agent collects. Management servers send the rules to the agents. If monitored values fall outside defined parameters, the agent notifies the management server and an alert is generated. The alert appears in the Operations console, where administrators can view information about the alert and begin to resolve the issue.
• Sending notifications Most likely, an administrator does not use the Operations console constantly to monitor whether alerts have been generated. Therefore, Operations Manager can send notifications to administrators to indicate when an alert is generated. You can implement rules to identify which administrators should be notified by specific systems in your organization. The notifications can be sent by email, SMS, or instant messaging.
Parts of an Operations Manager implementation
Operations Manager includes several parts that work together to provide monitoring, alerts, and notifications. You should understand each of the Operations Manager parts to understand its overall capabilities. In addition, understanding the communication process among parts aids you when troubleshooting is required. Figure 12-5 shows the communication process.
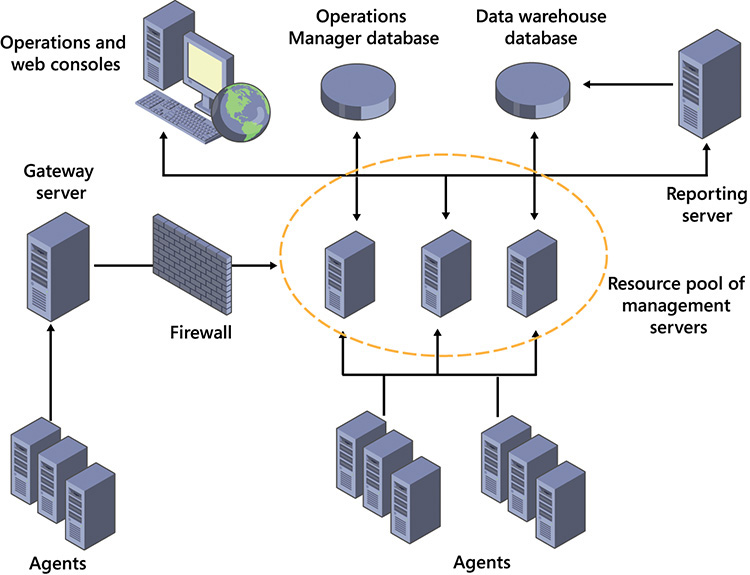
Operations Manager has the following parts:
• Agents In most cases, you install agents on computers that Operations Manager monitors. Agents can be installed on Windows-based, UNIX-based, and Linux-based systems. It’s also possible to perform monitoring without an installed agent, but this isn’t very efficient and has limited functionality. You typically use agentless monitoring on systems on which an agent can’t be deployed, such as secure systems with restricted access.
• Management servers Agents report status information to management servers. One management server is required, but for high availability or additional capacity, you can have multiple management servers in a single resource pool.
• Operations Manager database Management servers store information collected by agents in an Operations Manager database. This database is used for short-term storage of information that relates to current status and alerts.
• Data warehouse database Management servers also store information collected by agents in the data warehouse database. This database is used for long-term data storage and for reporting.
• Reporting server The reporting server is a server that runs Microsoft SQL Server Reporting Services (SSRS). This server generates reports that typically are viewed by using the Operations console.
• Operations console The Operations console is the primary interface for managing and working with Operations Manager. You can use the Operations console to view status, manage alerts, and view reports. The web console provides many of the same functions as the Operations console, but through a web-based interface.
• Gateway server You can use a gateway server to support environments where Kerberos authentication isn’t possible between agents and management servers. Agents report to a gateway server, which reports information to management servers. Authentication between a gateway server and management servers is performed by using certificates. It’s also possible to configure agents to use certificate-based authentication, but when there are more than a few agents, it’s easier to use a gateway server.
Inside OUT: Understanding the Operations console
• Monitoring This workspace contains various views for monitoring systems. Views import as part of management packs, but you also can create your own customized views. The most common views show alerts and system state.
• Authoring You use this workspace to configure customized monitoring of applications and servers.
• Administration You use this workspace to configure various aspects of Operations Manager. The most common actions that you perform here are discovering computers for agent deployment and importing management packs.
• My Workspace You can customize this workspace to contain the views that you use most often.
Before you can monitor servers providing application and desktop virtualization, you need to install the Operations Manager agent. You can install the agent manually from the Operations Manager installation media, but it’s more common to deploy it by using the Operations console. The process for selecting the computers for deployment is referred to as discovery.
To install the Operations Manager agent on a server, perform the following steps:
1. On the taskbar, click Operations Console.
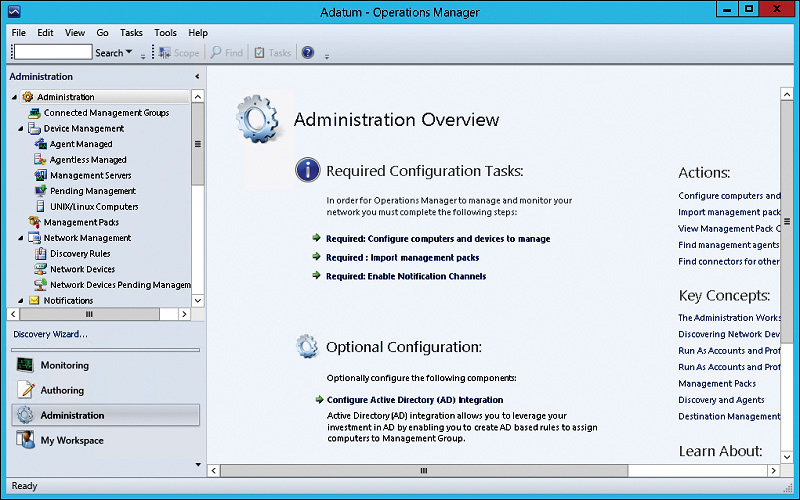
2. In the Operations console, click the Administration workspace.
3. In the Administration workspace, on the Administration Overview page, shown in Figure 12-7, click Required: Configure Computers And Devices To Manage.
4. In the Computer And Device Management Wizard, click Windows Computers and click Next. You also can select UNIX/Linux computers and network devices for monitoring.
5. On the Auto Or Advanced page, select Automatic Computer Discovery and click Next. This option queries Active Directory Domain Services (AD DS) for all computer objects. If you choose Advanced Discovery, you can limit the results to Servers Only or Clients Only or specify specific computer accounts.
6. On the Administrator Account page, select Use Selected Management Server Action Account and click Discover. This page defines an account that has administrator rights on the computers on which you are installing the agent. The Management Server Action Account defined in Operations Manager has local administrator permissions in most cases, but you can specify an alternate account if you prefer.
7. On the Select Objects To Manage page, shown in Figure 12-8, select the servers on which you want to install the agent and then click Next. In most cases, you want to use the default Management Mode of Agent.
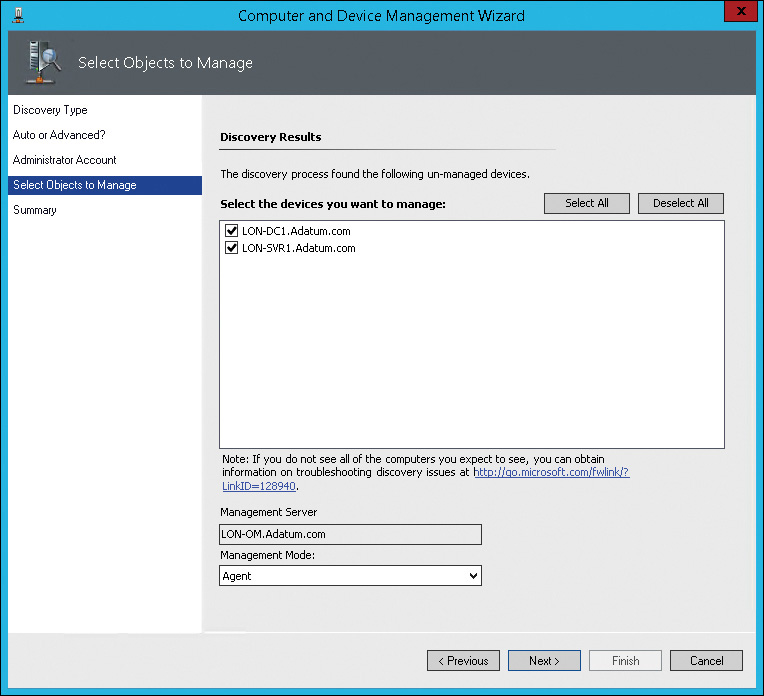
8. On the Summary page, shown in Figure 12-9, click Finish to begin deployment. On this page, you can change the installation directory and credentials used to run the agent service on managed computers, but this is done rarely.
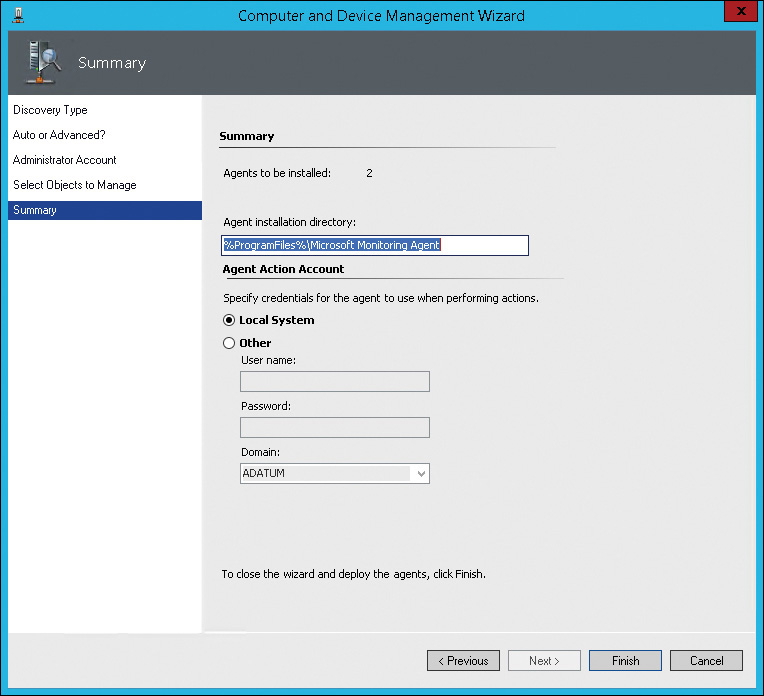
9. In the Agent Management Task Status window, click Close. You can close this window at any time. Agent installation completes as a background task.
Note
After installing the agent on a computer, it can take 10 to 15 minutes for the status to appear in the Operations console.
Understanding management packs and overrides
In Operations Manager, the rules for data collection and raising alerts are stored in management packs. At the simplest level, a management pack is a file that contains information about how to perform monitoring and how to display that monitoring information.
Although creating your own management packs is possible, downloading predefined management packs is more common. Many management packs are available that include rules that reflect a recommended starting point for monitoring systems. For example, management packs are readily available to monitor common applications such as Microsoft SQL Server and Microsoft Exchange Server, in addition to infrastructure such as Windows Server 2012 R2.
Management packs can include the following parts:
• Monitors A monitor identifies the status of a particular item. In general, monitors are used to identify whether an application or service is healthy or unhealthy.
• Rules The rules in a management pack are instructions for the agents that are running on monitored computers. An agent is responsible for collecting data, generating alerts, gathering events, and discovering objects to monitor.
• Object discoveries An object discovery defines how to identify a particular object that can be monitored. For example, an object discovery could define a registry key and value to identify whether an application is installed.
• Knowledge The knowledge in a management pack is information that administrators can use for troubleshooting. For example, when an alert is generated, the knowledge can define a known method for resolving the issue.
• Views The views in a management pack define how to display information about an application or service. In most cases, a management pack has separate views for state and alerts. In some cases, a view that shows performance data also is included.
• Reports Some management packs include reports that provide detailed information about the monitored application or service. These reports are generated from long-term data that is stored in the data warehouse database. Reports generally are used to identify long-term trends rather than for short-term troubleshooting.
• Tasks A task is a script or executable code that runs on a managed computer. Tasks can be triggered automatically in response to an alert or manually. You create tasks to perform common actions that might be required to resolve problems.
• Run As profiles A Run As profile contains a set of credentials that are used to run tasks on monitored systems. Using Run As profiles allows Operations Manager users to run tasks even if they don’t have permission to perform an action directly. For example, a task could use a Run As profile with local administrator permissions on a computer to restart a service. This is possible even if the user who triggers the task does not have permission to restart the service. The credentials from the Run As profile are used to restart the server when the task runs.
In addition to the monitoring that downloadable management packs provide, you can create customized monitoring to meet your organization’s needs. For example, you can create alerts that are triggered based on performance counters that fall outside a specific range. You also can create alerts based on particular events in an event log.
When an application, such as a web-based application that stores information in a database, is composed of multiple parts, you can configure distributed applications that monitor all of the parts. Then you can receive an alert that informs you which part of the application failed.
Management packs for monitoring application and desktop virtualization
Every environment that uses Operations Manager to monitor a Windows Server–based infrastructure should use management packs for monitoring. To do this, you download a management pack for each version of Windows Server that you are using, and then you import it into Operations Manager. After you have imported management packs for the Windows-based servers, you can tune them.
Management packs for Windows-based servers provide basic operating system monitoring that you can use to ensure the general health of a Windows-based server. For example, an alert will be generated when volumes on a server are low on free space.
Management packs that are useful for monitoring desktop and application virtualization include the following:
• System Center Management Pack for Microsoft Application Virtualization Server 5.0
• Microsoft Remote Desktop Services 2012 Management Pack for System Center 2012
• System Center Management Pack for Windows Server 2012 R2 Hyper-V
The System Center Management Pack for Microsoft Application Virtualization Server 5.0 is used to monitor App-V 5.0 servers. It monitors the health of the management server, publishing service, and reporting service. Most monitoring occurs by monitoring events in event logs. When specific events are generated on an App-V 5.0 server, the agent reports an alert to the management server.
![]() For more information about the System Center Management Pack for Microsoft Application Virtualization Server 5.0, go to the Microsoft Download Center at http://go.microsoft.com/fwlink/?LinkID=510068&clcid=0x409.
For more information about the System Center Management Pack for Microsoft Application Virtualization Server 5.0, go to the Microsoft Download Center at http://go.microsoft.com/fwlink/?LinkID=510068&clcid=0x409.
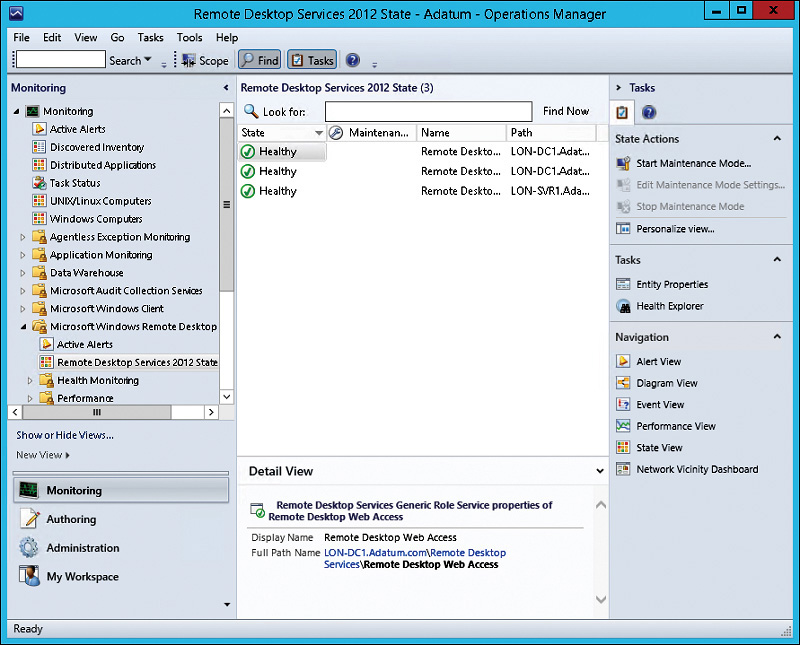
The Microsoft Remote Desktop Services 2012 Management Pack for System Center 2012 provides monitoring for the RDS server role and all RDS role services. Even if RDS role services are installed on different servers, overall RDS health is monitored as a single unit.
The following information is monitored:
• RD Session Host server performance For RD Session Host server performance, the management pack monitors active sessions, inactive sessions, and total processor time per session. You are alerted when the number of active sessions reaches the performance limit of the server, when there are too many inactive sessions, and when sessions consume more than 80 percent of the processing capacity for 15 minutes or more.
• RD Session Host server monitoring For RD Session Host server monitoring, the management pack verifies that the RDS service is running. It also verifies connectivity to required role services such as the RD Licensing server and RD Connection Broker.
• RD Licensing server monitoring For RD Licensing server monitoring, the management pack verifies that the RD Licensing role service is running. The management pack also verifies that client access licenses (CALs) are available.
• RD Gateway server monitoring For RD Gateway server monitoring, the management pack verifies that the RD Gateway role service is running. It also verifies connectivity to RD Session Host servers and monitors the number of current connections.
• RD Connection Broker server monitoring For RD Connection Broker server monitoring, the management pack verifies that the RD Connection Broker role service is running. It also monitors connectivity to Remote Desktop Web Access (RD Web Access).
• RD Web Access server monitoring For RD Web Access server monitoring, the management pack verifies that the RD Web Access role service is running. It also monitors connectivity to the RD Connection Broker server.
• RD Virtualization Host server monitoring For RD Virtualization Host server monitoring, the management pack verifies that the RD Virtualization Host agent service is running. It also monitors RD Virtualization Host server performance.
![]() For more information about the Microsoft Remote Desktop Services 2012 Management Pack for System Center 2012, go to the Microsoft Download Center at http://go.microsoft.com/fwlink/?LinkID=510070&clcid=0x409.
For more information about the Microsoft Remote Desktop Services 2012 Management Pack for System Center 2012, go to the Microsoft Download Center at http://go.microsoft.com/fwlink/?LinkID=510070&clcid=0x409.
The System Center Management Pack for Windows Server 2012 R2 Hyper-V monitors the things on a Hyper-V host that are specific to Hyper-V. On an RD Virtualization Host server, you might have sufficient information about the RD Virtualization Host server from the RDS management pack, but this management pack provides more information that is specific to Hyper-V.
The following are some of the things that the Hyper-V management pack monitors:
• Hyper-V services, to ensure that they are running
• Free disk space on VMs
• Microsoft RemoteFX configuration
![]() For more information about the System Center Management Pack for Windows Server 2012 R2 Hyper-V, go to the Microsoft Download Center at http://go.microsoft.com/fwlink/?LinkID=510071&clcid=0x409.
For more information about the System Center Management Pack for Windows Server 2012 R2 Hyper-V, go to the Microsoft Download Center at http://go.microsoft.com/fwlink/?LinkID=510071&clcid=0x409.
Installing management packs
Management packs that you download from Microsoft are distributed as an MSI file that performs an installation process. The installation process for management packs extracts the management files to a folder in C:Program Files (x86)System Center Management Packs. After the files are extracted, they need to be imported by using the Operations console.
To import a management pack, perform the following steps:
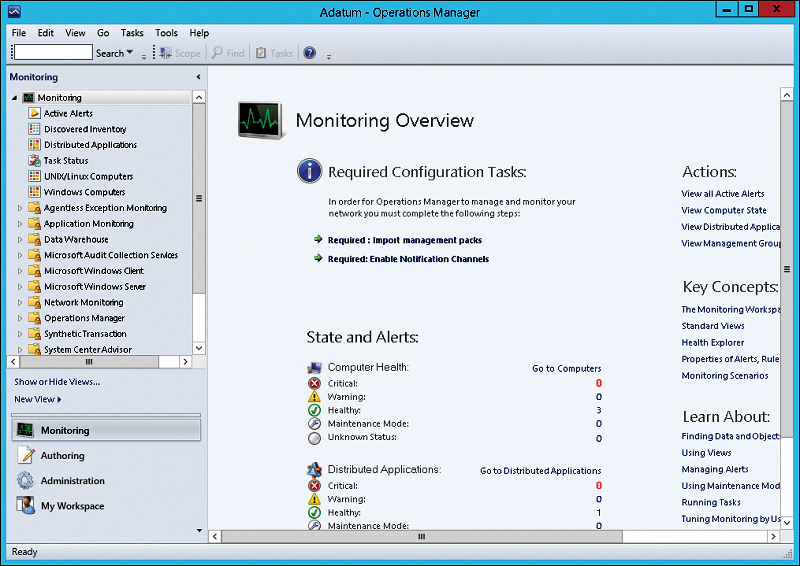
1. In the Operations console, in the Monitoring workspace, on the Monitoring Overview page, shown in Figure 12-10, click Required: Import Management Packs.
2. In the Import Management Packs window, click Add and click Add From Disk.
3. In the Online Catalog Connection window, click Yes. Some management packs are dependent on other management packs. Using this option automatically downloads any management pack dependencies.
4. In the Select Management Packs To Import window, browse to the location of the .mp files for the management packs you want to import, select the files, and click Open.
5. In the Import Management Packs window, shown in Figure 12-11, click Install.
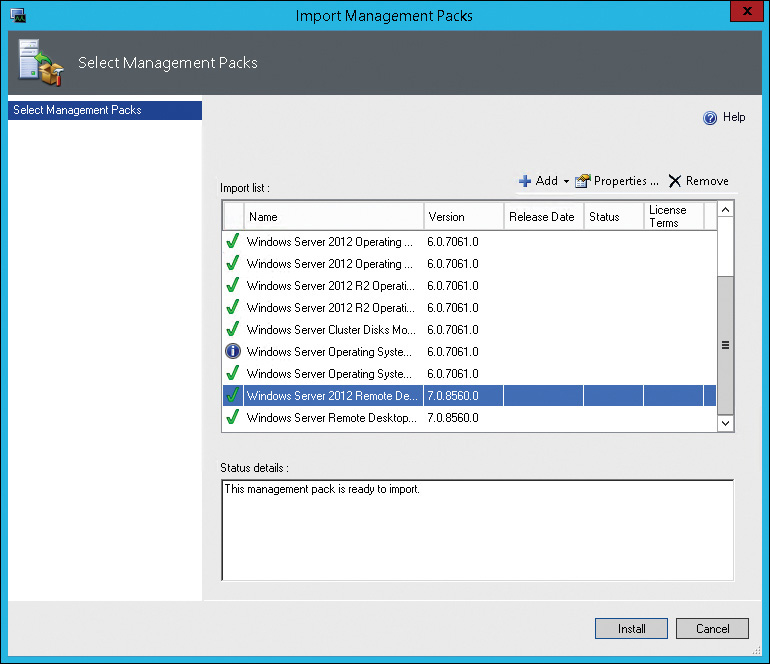
6. When the import is complete, click Close.
Monitoring desktop virtualization infrastructure
When you monitor desktop virtualization infrastructure, you need to consider that multiple users share the infrastructure at the same time. The actions of one user can affect performance of other users. Monitoring is particularly difficult for VM-based desktop deployments because the performance counters within a VM aren’t an accurate indicator of the overall performance of an RD Virtualization Host server. You also need to be aware of specific counters that you should monitor for RD Virtualization Host servers and RD Session Host servers.
Understanding resource bottlenecks
Monitoring any computer’s performance generally means identifying and reducing performance bottlenecks on a computer that runs the Windows 8 or Windows Server 2012 R2 operating system. The most common performance bottlenecks occur with four main resources: CPU utilization, memory utilization, disk I/O, and network utilization. If any of these four resources are consumed fully, a bottleneck occurs.
You can use counters in Performance Monitor to identify when resources are fully utilized. Each resource has unique counters that you can use:
• CPU A CPU is utilized fully when the Processor Information\%Processor Time counter in Performance Monitor has a value of 100 percent. Anything less indicates that the processor has additional unused capacity. However, with modern multicore processors, this counter can be misleading. Some applications aren’t written to allow the use of all processor cores. As a result, when such an application uses the full capacity of a single processor core, application performance peaks. In this case, a four-core processor could show 25 percent utilization, but the application would have reached a bottleneck.
• Disk The most common measure of disk performance is Physical DiskCurrent Disk Queue Length. This counter describes how many disk operations are queued and waiting to be processed. If this counter registers a value greater than two for a sustained period, it’s considered a performance concern because the disk isn’t keeping up with requests for disk activity. In cases in which you use Redundant Array of Independent Disks (RAID), you should evaluate disk queue length based on two per physical disk in the RAID array.
• Memory A computer that runs Windows Server 2012 R2 is capable of using disk space for a paging file to support applications that require memory beyond the physical memory in the computer. When the paging file is used as virtual memory, it creates a high level of disk utilization. As a best practice, you should ensure that computers have sufficient memory to limit use of the paging file. The MemoryPages/sec counter indicates information that reads and writes to the paging file. A sustained high level of pages in the counter typically indicates a shortage of physical memory. You also can monitor the MemoryAvailable MBytes counter to identify available physical memory.
• Network On a modern computer network that uses switches, network utilization can reach approximately 80 percent before performance concerns appear. You can use the Network InterfaceBytes Total/sec counter for a specific network interface to monitor throughput of a network virtual adapter. You can compare this to link speed to identify overall network utilization.
Considerations for monitoring desktop virtualization
When you monitor a single computer, you are monitoring a single operating system and a single user or application. This direct relationship among computers, operating systems, and users makes it easy to identify the source of performance issues. When you monitor VDI implementations, there is no direct relationship among computers, operating systems, and users.
A VDI implementation that uses virtual desktops that are hosted on an RD Virtualization Host server has multiple operating systems that are hosted on a single physical computer. Monitoring performance is more complex because monitoring each virtual desktop computer’s performance characteristics does not provide you with a complete performance picture. For example, when you monitor CPU utilization on a virtual desktop, high CPU utilization does not indicate that the physical processor on the RD Virtualization Host server also has high utilization. When you monitor virtual desktops, you need to monitor the RD Virtualization Host server in addition to the virtual desktops.
Monitoring a session-based desktop deployment of VDI that uses RD Session Host servers to provide virtual desktops is more complex than monitoring desktop computers. When you monitor an RD Session Host server, you need to consider the relationships among all of the users who access the RD Session Host server. Because all users share resources on an RD Session Host server, you need to consider whether an application that is used by one user is affecting the performance of another user.
In general, because an RD Virtualization Host server or RD Session Host server has multiple users, you need to consider the resource utilization of all users on that host. When you design the RD Virtualization Host server or RD Session Host server, you need to ensure that there is sufficient capacity in the following:
• CPU
• Memory
• Disk I/O and free space
• Network
Monitoring RD Session Host server performance
Because an RD Session Host server is accessed by multiple users at the same time, there are unique requirements for monitoring performance. Unlike RD Virtualization Host servers, the resources that individual users consume aren’t isolated. On an RD Virtualization Host server, you can control the resources assigned to a VM and thereby limit the resources consumed by a user of that VM. On an RD Session Host server, all users have access to a single pool of resources.
RD Session Host servers are more prone to spikes in processor utilization that most servers. Spikes in processor utilization typically are driven by a few highly active threads. Each thread can fully consume the processing capacity on a single processor core. On single-user systems with fewer applications running, spikes occur less frequently. An RD Session Host server’s best performance occurs when there are many processor cores. This way, when a thread monopolizes a processor core, the remaining processor cores can service other threads. When you monitor processor utilization, you need to be aware of utilization on individual processor cores, not just overall utilization.
An RD Session Host server requires much less memory than an RD Virtualization Host server because an RD Session Host server avoids loading the same content into memory multiple times. For example, an application loads into memory once, and then each user has dedicated memory for the application while it’s working.
The total memory required for an RD Session Host server is the memory that is required for the operating system and for each user session. The amount of memory that each session requires varies depending on the work that each user performs. The only way to optimize the amount of physical memory is to measure system performance under load.
To optimize memory in an RD Session Host server, you should monitor the MemoryAvailable MBytes and ProcessWorking Set counters. The point at which both of these counters reach a steady state is the optimal point for memory configuration. Past this point, performance degradation can occur.
Each user connected to an RD Session Host server generates additional disk I/O. In addition to disk activity that user applications generate, disk activity is generated by reading and writing to user profiles. In general, you should place user profiles on a separate physical disk to increase disk performance.
The RD Session Host server role might have higher page file utilization than other server roles due to the high number of processes running. To accommodate this, you can place the page file on a separate physical disk.
High rates of disk activity can indicate that an RD Session Host server does not have sufficient physical memory. You can verify this by monitoring the MemoryPages/sec counter. If this counter is a consistently high value, the RD Session Host server requires additional memory.
The network activity that users generate is composed of the Remote Desktop Protocol (RDP) communication between clients and the RD Session Host server and network activity generated by the applications that users are running. For example, an application might query a database on another server. Network activity is specific to each implementation because it depends on the applications that are being used.
Optimizing RD Session Host server performance
When Windows Server 2012 R2 is configured as an RD Session Host server to support hosting applications, a common concern is resource contention among multiple users of the RD Session Host server. Resource contention happens when a single user runs applications that use a high percentage of resources, such as processor, network, disk I/O, and memory. To control resource utilization, you can use Fair Share.
A Windows Server 2012 R2 RD Session Host server includes Dynamic Network Fair Share, Dynamic Disk Fair Share, and Dynamic CPU Fair Share. These features control the allocation of network bandwidth, disk I/O, and processor capacity, respectively. Each Fair Share feature distributes resources across user sessions to prevent one user’s resource utilization from affecting the performance of other users. For example, if one user runs an application on an RD Session Host server that attempts to use 100 percent of the CPU capacity, Dynamic CPU Fair Share ensures that other users still can access processing capacity by limiting the first user’s CPU utilization.
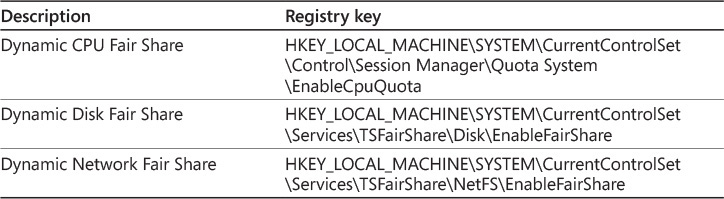
Fair Share is enabled by default for the CPU, disks, and the network. You can use Group Policy to disable CPU Fair Share by enabling the Turn Off Fair Share CPU Scheduling policy setting in Computer ConfigurationPoliciesAdministrative TemplatesWindows ComponentsRemote Desktop ServicesRemote Desktop Session HostConnections. You can’t disable Dynamic Network Fair Share and Dynamic Disk Fair Share by using Group Policy. Table 12-1 shows the registry keys that you can use to disable Fair Share.
Use the following guidelines to increase RD Session Host server performance:
• Eliminate unnecessary per-user processes Identify and remove unnecessary processes that run at user sign-in. These applications might be found in the Run key in the registry or as scheduled tasks. Because many users sign in to a single RD Session Host server, eliminating unnecessary user processes can affect performance significantly.
• Remove unnecessary desktop notification icons Some notification icons consume significant resources when refreshing. If a desktop notification icon is required, it might be possible to reduce the refresh frequency to reduce resource utilization.
• Reduce application synchronization frequency If there are applications that synchronize data, reduce the synchronization frequency as much as you can without affecting application functionality. For many applications, you should disable synchronization to the virtual desktop. For example, if you are using Microsoft Outlook 2013 on a virtual desktop, you should not use cached mode.
• Disable device redirection to reduce network utilization Device redirection such as redirected printers and other local resources can consume significant network resources, but the primary concern is whether the functionality is required.
![]() For more information about Autoruns, see http://go.microsoft.com/fwlink/?LinkID=510072.
For more information about Autoruns, see http://go.microsoft.com/fwlink/?LinkID=510072.