

Using IBM FlashSystem 900
This chapter shows how to operate IBM FlashSystem 900 in your business environment. Both the graphical user interface (GUI) and the command-line interface (CLI) are used to demonstrate how to monitor the system and work with volumes, hosts, and user security.
This chapter covers the following topics:
6.1 Overview of IBM FlashSystem 900 management tools
The FlashSystem 900 can be managed from either the built-in GUI, which is a web-based management tool, or from the CLI.
The web-based GUI is designed to simplify storage management and to provide a fast and more efficient management tool. It is based on the IBM System Storage XIV software and has a similar look and behavior.
To use the GUI to manage the FlashSystem 900, be sure to have a supported web browser. For a list of supported web browsers, see “Supported web browsers” on page 86.
|
JavaScript: You might need to enable JavaScript in your browser. Additionally, if you are using Firefox, under Advanced JavaScript Settings, click Disable or replace context menus and allow cookies.
|
6.1.1 Access to the graphical user interface
To log on to the GUI, point your web browser to the management IP address that was set during the initial setup of the FlashSystem 900. The default credentials are as follows:
•User name: superuser
•Password: passw0rd (with a zero in place of the letter “O”)
Figure 6-1 shows the login window.

Figure 6-1 Login window
After logging in, the Monitoring > System home window opens (Figure 6-2).

Figure 6-2 System overview window
6.1.2 Graphical user interface (GUI) layout
The GUI has three main sections for navigating through the management tool (Figure 6-3 on page 164):
•Function icons (left side), also referred to as menu selection icons
•Status bars (bottom)
•Actions menu (upper left or right-click in the home window)
At the left side of the window are five function icons. The five function icons represent these areas:
•Monitoring menu
•Volumes menu
•Hosts menu
•Access menu
•Settings menu
Also in the window are these controls:
•Actions menu (upper left or right-click in the home window): For the list of actions on this menu, see Figure 6-4 on page 165.
•Current menu indicators: Shows the path where the menu is located (as shown in Figure 6-3 on page 164, IBM FlashSystem 900 > Monitoring > System).
•User security: This key is for managing the security of the user that is currently logging in.
•The Help icon (question mark (?)): Provides information about licenses and gives access to the IBM FlashSystem 900 web page at the IBM Knowledge Center.
•Menu selector icons: These are also referred to as function icons.
•Capacity indicators: Figure 6-3 shows 5.20 TiB of physical Flash module space and 2.98 TiB of allocated space. The bottom left shows capacity with 3,048 used GiB of 5,325 GiB installed capacity, with 57% used.
•Performance: This is also referred to as Performance pod; it displays bandwidth (MBps), I/O per second (IOPS), and latency (ms).
•Health Indicator: Shows the health of the system. Figure 6-3 indicates that the system is healthy (green).
•Component status indicators: These show the status of the components of the FlashSystem 900. See Figure 6-4 on page 165 for more details.
•Rotate for rear side view: Rotates the FlashSystem 900 to see a rear view of the components.

Figure 6-3 Home window: Main areas
6.1.3 Navigation
Navigating the management tool is simple. You can hover the cursor over one of the five function icons on the left side of the window, which highlights the function icon and opens a list of options. Figure 6-4 shows a list of the FlashSystem 900 software function icons and the associated menu options.

Figure 6-4 FlashSystem 900: Menu options
The following sections describe the five function icons and their associated menu options.
Figure 6-5 shows the home window with a rear view of the FlashSystem 900. To see this view click the Rotate icon located at the right side of the image.

Figure 6-5 FlashSystem 900: Menu options Rear view
6.1.4 Selecting multiple items
With the FlashSystem 900 management tool, you can select multiple items by using a combination of the Shift keys or Ctrl keys. To select multiple items in a display, click the first item, press and hold the Shift key, and click the last item in the list that you require. All the items in between those two items are selected. For example, Figure 6-6 illustrates multiple selections from the Volumes → Volumes menu.

Figure 6-6 Multiple selections by using the Shift key
This function is useful if you want to expand multiple volumes at the same time.
If you want to select multiple items that are not in sequential order, click the first item, press and hold the Ctrl key, and click the other items that you require (Figure 6-7).

Figure 6-7 Multiple selections by using the Ctrl key
6.1.5 Status indicators
Other useful tools are the Status indicators that appear at the bottom of the window (Figure 6-8). These indicators provide information about capacity usage, throughput in megabytes per second and I/O per second (IOPS), and the health status of the system. The status indicators are visible from all windows in the FlashSystem 900 GUI.

Figure 6-8 Status indicators at the bottom of the GUI window
The status indicators show the following information:
•Capacity:
– Used gigabytes
– Installed gigabytes
– Percentage used
•Performance:
– Bandwidth (MBps)
– I/O per second (IOPS)
– Latency
•Health; one of these options:
– Healthy (green)
– Warning (yellow) and a link to Monitoring → Events is provided
– Error (red) and a link to Monitoring → Events is provided
– Upgrade status percentage
6.2 Monitoring menu
The Monitoring → System menu is the default menu and home page for the FlashSystem 900 GUI. It has three options as shown in Figure 6-4 on page 165:
•System
•Events
•Performance
Part of the default window or home page is also the Actions menu where the system can be managed and information about the system can be obtained.
6.2.1 Monitoring System menu
In the home window of the FlashSystem 900 GUI, you can select Actions in the upper-left corner. Actions can also be activated by right-clicking anywhere in the GUI.
Actions menu
The following information can be retrieved in the Properties window by selecting Actions → Properties (Figure 6-9 on page 169):
•System name
•System state
•Hardware type
•Firmware version
•Serial number
•Model and type number
•Worldwide name
•Storage capacity
•Power on days

Figure 6-9 Monitoring System menu with actions displayed
The Properties window opens and shows the system’s properties (Figure 6-10).

Figure 6-10 Properties for the system cluster
Rename system
If you want to change the system name, click Actions → Rename to open the Rename System dialog (Figure 6-11). Enter a new name and click Rename.

Figure 6-11 Rename the system
When the system is renamed, the task window (Modify System Properties) opens (Figure 6-12). It shows the CLI command that the system uses to make the change.

Figure 6-12 CLI command displays
The CLI commands that are displayed can also be executed by the user from within an open CLI window by using PuTTY or a similar terminal emulation tool. For more information about how to use the CLI, see 6.5.3, “Accessing CLI by using PuTTY” on page 223.
Rename system using CLI
When system properties and settings are changed from the GUI, commands are executed on the system. In the preceding example, you renamed the system host name by using the GUI, and the Modify System Properties window opened (Figure 6-12). In that window, the CLI commands that the system uses to change system properties are displayed.
Example 6-1 shows the use of the CLI command to change system properties. The output is shortened for clarity.
Example 6-1 Change the system name using the CLI
IBM_FlashSystem:Cluster_9.xx.xx.xx:superuser>svctask chsystem -name IBM_FlashSystem_900
IBM_FlashSystem:Cluster_9.xx.xx.xx:superuser>svcinfo lssystem
id 0000020063622910
name IBM_FlashSystem_900
In the example, the prompt shows the new system name at the next CLI login.
Identify LED
Another function of the Actions menu is the Identify function. When the Identify function is enabled, the Identify LED on the front side of the IBM FlashSystem 900 and both controller canisters turn on their blue Identify LED. The canisters are mounted from the rear side of the FlashSystem 900; the canister Identify LEDs are shown from the rear side of the unit.
Figure 6-13 shows the Identify LED when it is on.

Figure 6-13 Identify LED is turned on
Also, each canister can be identified through the IBM FlashSystem 900 Service Assistant Tool. The Service Assistant Tool is described in 7.2, “Service Assistant Tool” on page 276.
Power off
The IBM FlashSystem 900 can be turned off through the Actions menu. Many reasons exist to turn off the unit. One reason might be that you need to relocate the system to another site or shut it down for scheduled power maintenance. The power off function ensures that the system is turned off securely so that data is preserved.
When you click Actions → Power Off, a warning message displays. Figure 6-14 on page 172 shows that the Power Off window requires the administrator to type a confirmation code to prevent an accidental power-off cycle of the device.

Figure 6-14 Power off entire system or a single canister
Individual controller canisters can be rebooted or placed into service state from the Service Assistant Tool under guidance from IBM Support. One reason for placing a controller into service state might be if the system is to be reinitialized or if a controller is to be replaced.
For more information about the Service Assistant Tool, see 7.2, “Service Assistant Tool” on page 276.
Modify capacity reservation
You can modify the amount of flash storage capacity that is reserved for system management tasks, which may improve system performance.
Out of the usable flash storage capacity that is available, the system sets aside a certain amount of that capacity for system management tasks, which reduces the overall usable capacity that is available for volumes.
Select Reserve capacity for performance and click Modify to allocate a portion of the usable capacity to enhance system performance as shown in Figure 6-15.

Figure 6-15 Modify capacity reservation
The amount of usable capacity that is available for volumes will be reduced and used to enhance performance.
Fibre Channel ports
To view the Fibre Channel ports of the IBM FlashSystem 900 interface cards, select Actions → Fibre Channel Ports. The Fibre Channel Ports window opens.
Fibre Channel and FCoE
In this example, eight 16 Gbps Fibre Channel (FC) ports are displayed, each showing the following information:
•Depiction of port location
•State
•Port: Fibre Channel (FC) or Fibre Channel over Ethernet (FCoE)
•Port speed: Auto, 16 Gbps, 8 Gbps, 4 Gbps, or 2 Gbps
•WWPN/GUID: Worldwide port name (WWPN) and globally unique identifier (GUID)
•Topology: Fibre Channel Arbitrated Loop (FC-AL) or Fibre Channel-Peer to Peer (FC-P2P)
Topology and speed for the ports are automatically detected for FlashSystem 900.
Figure 6-16 shows the Fibre Channel I/O ports in the system.

Figure 6-16 The status of the I/O ports
Any FC or FCoE port that is not connected and online has an Inactive status. The FC-P2P (point-to-point) topology is used in situations where two FC ports connect directly to each other. FC-P2P is the default for a host that is directly connected to the FlashSystem 900, and FC-P2P is also used for a FlashSystem 900 FC port that is connected to a Fibre Channel switch.
The FC-AL (arbitrated loop) topology is also used to attach a host directly to the FlashSystem 900 in cases where the host only supports FC-AL, for example, when connecting a VMware ESX server directly to the FlashSystem 900.
|
Note: FC-AL is not supported for ports that are connected at 16 Gbps.
|
Figure 6-17 shows the logical numbering of the FC ports.

Figure 6-17 I/O port logical numbering
For a description of the physical numbering of the ports of the interface cards, see Chapter 4, “Installation and configuration” on page 67.
|
Note: The physical numbering and the logical numbering of the ports are not the same. The physical numbering of the ports of the interface cards starts from the left with P1 and P4 to the right, depending on the configuration. Logical numbering depends on the node name and these node names can swap, so the port names depicted in Figure 6-17 are the default names, but they might change.
For more details, see 7.2, “Service Assistant Tool” on page 276.
|
iSCSI
In the FlashSystem 900 GUI home window, click Actions → iSCSI Ports. Sixteen iSCSI ports are displayed, each indicating the following information:
•Depiction of port location
•State
•IP address
•Subnet mask
•Gateway
The result is shown in Figure 6-18.

Figure 6-18 Display iSCSI I/O ports
To display the IP address of individual iSCSI ports, first rotate the depiction of the FlashSystem 900 by clicking the Rotate icon. Then, hover the mouse cursor over the preferred iSCSI port, right-click, and select Properties (Figure 6-19).

Figure 6-19 Display properties of an iSCSI port
The Properties window of the selected iSCSI port opens and you can review the network address (Figure 6-20).

Figure 6-20 Review iSCSI IP address of a single port
To modify an IP address of the selected port instead, right-click and select Modify IP Settings. The Modify IP Settings window opens (Figure 6-21). Modify the information you want and click Modify.

Figure 6-21 Modify iSCSI IP address
The changes are committed. The selected iSCSI port now has the selected IP address.
Flash module properties

Figure 6-22 Flash Module Properties display
Flash modules within an initialized FlashSystem 900 must always be online, except when a flash module is in the failed state.
The Use column (parameter) can have these values:
•Candidate (ready to be a RAID 5 member or spare)
•Member
•Spare
RAID 5 provides redundancy for failed flash modules and keeps one flash module as a spare. The only situation in which a flash module can be a candidate is when there is no RAID configuration on the flash module. Including a candidate flash module into the RAID configuration requires the reinitialization of the array, which is a data destructive action. For instructions of how to reinitialize the RAID configuration, see 4.4, “RAID storage modes” on page 98.
|
Note: The only situation in which a flash module can be a candidate is when there is no RAID configuration on the flash modules.
|
To view properties of the individual flash modules, from the home window, hover the mouse over the FlashSystem 900 depiction, right-click a flash module, and select properties. The flash module properties are displayed (Figure 6-23).

Figure 6-23 Flash Module 0 properties
Part numbers
To review a list of part numbers for customer-replaceable units (CRUs) and field-replaceable units (FRUs), select Actions → Part Numbers. CRUs can be replaced by IBM clients; FRUs are replaced by either IBM Support or an IBM Service Partner.
Figure 6-24 shows the part numbers that are available for the IBM FlashSystem 900.

Figure 6-24 List of part numbers
6.2.2 Monitoring events
The IBM FlashSystem 900 might show the Health Status indicator as these colors:
•Green (healthy)
•Yellow (degraded or warning)
•Red (critical)
Events on the IBM FlashSystem 900 storage system are logged in the event log of the Monitoring → Events menu.
Navigating to events
To navigate to the event log, hover the cursor over the Monitoring icon and then click Events (Figure 6-25).

Figure 6-25 Monitoring events
You can also click the attention (!) triangle icon on the left side of the Health Status indicator to get to the Monitoring > Events window as shown in Figure 6-25. A yellow Health Status indicator indicates a warning state.
Figure 6-26 shows the Monitoring > Events window with the Show All mode selected. In the Show All mode, all events, including messages, warnings, and errors are displayed. To get to the Show All mode, first click a recommended action and then select Show All.

Figure 6-26 The Events window
In the example, a controller node is held in service state, which causes the health status to enter a warning state. Resolving issues is demonstrated in “Directed maintenance procedures (DMP)” on page 185.
The Monitoring → Events menu can be manipulated in several ways by using the function tabs that are displayed over the list of events.
Check Log LED off
One function of the FlashSystem 900 is its Check Log LED. This LED illuminates amber for a problem that is not isolated. An error condition results in a call home of the problem. There is also a service action; a warning condition results in a service action that the user is expected to fix. Note that there is no correlation between the notification type of “error/warning” and the Check Log LED.
The leftmost function key of the Events menu is the Check Log Off. With Check Log Off, you turn off the Check Log LED on the front of the IBM FlashSystem 900, and only new events turn it on again.
From the Monitoring > Events window, click Check Log Off. The window shown in Figure 6-27 opens. To turn off the Check Log LED, click Yes.

Figure 6-27 Events error LED off
Change the Events view
You might want more or less information from the Monitoring > Events window. You can change the default view by right-clicking the menu bar or by clicking the check mark icon in the upper-right corner of the Monitoring > Events window, as shown in Figure 6-28.

Figure 6-28 Events: Customize columns
From the Actions menu, you can do the following actions:
•Run fix procedure on error events
•Mark informational events as fixed
•Clear the event log
•Filter displayed events on date
•Show only events from the last minutes, hours, or days
•Show the properties of an event
Figure 6-29 shows that only events that are newer than five hours are selected to view.

Figure 6-29 Events: Show entries within five hours
Recommended actions
In the Monitoring > Events window, messages and alerts are displayed. If any unresolved issues exist, the Recommended Actions section opens. You can click Run Fix to initiate the fix procedure; the IBM FlashSystem 900 checks whether the problem still exists and fixes the issue, if possible. The fix procedure might bring the system out of a Degraded state and into a Healthy state.
In a normal situation during the daily administration of the FlashSystem 900, you are unlikely to see error events. There might however be a continuing flow of informational messages. The typical Events display is therefore to show only recommended actions.
To show only recommended actions, click Show All and select Recommended Actions as shown in Figure 6-30.

Figure 6-30 Events: Show all or only recommended actions
Figure 6-31 shows the resulting error codes. It indicates that a problem in the system needs attention and fixing.

Figure 6-31 Events: Only showing recommended actions
An example of the window that displays the details that are associated with the specific event IDs is in Figure 6-35 on page 187.
Directed maintenance procedures (DMP)
There are different ways to discover that your system needs attention in a warning or error situation. If the call home feature is configured on your system, which is advised, IBM Support is notified directly from the system and the system administrators are contacted by IBM for corrective actions.
The system administrator might also be in the list of email recipients and therefore is notified directly and immediately from the system as soon as an alert is sent.
For more information about how to configure call home, see Chapter 4, “Installation and configuration” on page 67 and “Email” on page 233.
Another way of getting alert notifications is through Simple Network Management Protocol (SNMP) alerts.
For more information about how to configure SNMP alerts, see “SNMP” on page 241.
When the system administrator logs on to the GUI of the FlashSystem 900, the Status Alerts message is displayed in the lower-right corner. Hovering over the Status Alerts “X” icon shows the unresolved alerts (Figure 6-32).

Figure 6-32 Status alerts are displayed
Status Alerts messages are also visible on the picture of the FlashSystem 900 storage in the home window (the Status Alerts is indicated by an X at the right side of the system).
Figure 6-33 shows an X in a red circle where enclosure 1 has an error condition.

Figure 6-33 Status Alerts view displays on the FlashSystem 900 graphic
The Status Alerts in the lower-right corner of the home window is similar to the Status Alerts X icon in the lower-right corner of the IBM FlashSystem 900 depiction. Hovering over the alerts X icon on the graphic of the system shows any unresolved alerts (Figure 6-33).
The situation that was demonstrated can be corrected from only the Service Assistant Tool, which is indicated if you run the Run Fix procedure from the Recommended Actions indicator.
An event that can be fixed from the Recommended Actions indicator is an error situation where the ambient temperature was detected as too high. This is demonstrated next.
Fixing the event
Clicking any of the Status Alerts displayed takes you to the Monitoring > Events menu where details about the events can be reviewed. The Recommended Actions box displays and indicates that unresolved errors are in the log and need your attention. This method to fix errors is also referred to as the directed maintenance procedures (DMP).
To view the details of a specific event, highlight the event and click Properties (Figure 6-34).

Figure 6-34 Event Properties
The Properties window opens (Figure 6-35) and you can review the details of the error.

Figure 6-35 Properties for an event
Figure 6-36 shows an error. Before starting the fix procedure, filter events to the Recommended Actions so that only errors that require attention are displayed here. Click Run Fix to initiate the DMP procedure.
Figure 6-36 Events: Run Fix
The Run Fix procedure guides you through resolving the error event. The error message in this example is caused by a room temperature that is too high, which might cause the system to overheat and eventually shut down if the error situation is not corrected.
Figure 6-37 shows the first step of the DMP procedure. The system reports that drive 2 (flash module 2) in slot 5 is measuring a temperature that is too high. The display also indicates that all four fans in both canisters are operational and online.

Figure 6-37 DMP procedure step 1
The next step in the DMP procedure is for the administrator to measure the room temperature and to make sure that the ambient temperature is within the specifications for the system. The instructions for this step are shown in Figure 6-38.

Figure 6-38 DMP procedure step 2
In the third step of the DMP procedure, suggestions about potential causes of overheating are provided. Overheating might be caused by blocked air vents, incorrectly mounted blank carriers in a flash module slot, or a room temperature that is too high. Instructions are displayed as shown in Figure 6-39.

Figure 6-39 DMP procedure step 3
In this step, the DMP procedure checks whether the error condition is resolved, and all events of the same type are marked as fixed, if possible. The final step is shown in Figure 6-40.

Figure 6-40 DMP procedure step 4
The events indicating an error condition relating to temperature are now gone and the system is back in a healthy state as shown in Figure 6-41.

Figure 6-41 Error condition is now resolved
For more information about operational specifications for the IBM FlashSystem 900, see the following web page:
6.2.3 Monitoring performance menu
The IBM FlashSystem 900 Performance menu gives you a good overview of how the system is performing. In the latest firmware release, the performance monitor changed for enhanced functionality. With previous firmware releases, the performance graphs represented five minutes of data. With THE current firmware release, the default performance monitor represents 10 minutes of captured data and the view can expand for showing up to 300 days.
Performance menu overview
To open the FlashSystem 900 performance monitor, select Monitoring → Performance. The first time the browser window opens, system latency is displayed (Figure 6-42).

Figure 6-42 Performance monitoring default window
The horizontal part of the graph displays the time line. You can slide the time line to view the past. You can also adjust the granularity of the time line by selecting one hour, one day, one week, one month or all. All displays the year to date.
Five performance charts can be reviewed from the graphs menu. You can save graphs and they are displayed as follows:
•System I/O
The System I/O graph displays the average number of read, write, and total I/O requests per second (IOPS) over the sample period. Each request type (read, write, and total) is represented by a different color line.
•System Latency
The System Latency graph displays the average amount of time in milliseconds (ms) each read and write I/O request takes over the sampling period. Each request type (read and write) is represented by a different color line.
•System Bandwidth
The System Bandwidth graph displays the average number of megabytes per second (MBps) of read, write, total, and rebuild bandwidth over the sample period. Each bandwidth type (read, write, total, and rebuild) is represented by a different color line. There is one line graph for each system that is selected.
•Interface Port Total IOPS
The Total Port IOPS graph displays average number of read, write, and total I/O requests per second (IOPS) over the sample period. There is one line on the graph for each port in each host adapter in each canister. Each adapter has a different color, and all four ports on an adapter have the same color.
•Fibre Channel Port Total Queue Depth
The Total Port Queue Depth graph displays the average number of operations of that type over the sample period. There is one line on the graph for each port in each host adapter in each canister. Each adapter has a different color, and all four ports on an adapter have the same color.
Graphs menu
The Graphs menu has five default graphs defined. By clicking the icon of the graphs menu, you can select the graphs, as shown in Figure 6-43.

Figure 6-43 Graphs menu default window
By default the performance monitor shows System Latency. Graphs can be customized and added to the menu as described in “Customize graphs menu” on page 195.
The graphs menu lists different resources for the ports, depending on the FlashSystem 900 model (InfiniBand, iSCSI, or Fibre Channel) as shown in Figure 6-44 on page 193.

Figure 6-44 Graphs menu of three different models of FlashSystem 900
In the following example, select System I/O from the graphs menu. The performance monitor now displays 10 minutes of IOPS (Figure 6-45). Any time of interest can be selected by moving the time slider.

Figure 6-45 Performance graphs showing IOPS at a specific time View two charts
As a storage administrator, you might want to know if there were long response times from storage (latency) at a given time. To compare two metrics, for example IOPS and latency, use the Click to view two charts icon at the right side of the graphs window (Figure 6-46).

Figure 6-46 Click to view two charts
Then, select the second graph from the graphs menu. You can point to either graph (the upper one or the lower one, whichever you prefer).
Figure 6-47 shows two graphs, IOPS and latency, in the Performance window.

Figure 6-47 Two graphs are displayed
Customize graphs menu
To customize a graph, click the Customize Resources and Metrics bar at the left side of the window. Then, select resources from the upper part of the window and metrics from the lower part of the window (Figure 6-48).

Figure 6-48 Customize graphs
When all resources and metrics are selected, click the blue arrow at the lower right corner; the resulting graphs are displayed (Figure 6-49).

Figure 6-49 Customized graphs are displayed
By clicking the Add to favorites icon (Figure 6-50), the two graphs are now listed as favorites on the graphs menu.

Figure 6-50 Graphs added to favorites
The graphs from the graphs menu can also be pinned to the toolbar where they appear as icons. The customized graphs can also be selected as the default graphs (Set as Default) for the FlashSystem 900 performance monitor (Figure 6-51).

Figure 6-51 Graphs pinned to toolbar
Host port adapter numbering
Figure 6-52 shows the numbering and naming of the IBM FlashSystem 900 I/O interface ports as they correspond to the performance monitor charts for Interface Queue Depth.

Figure 6-52 Rear-side numbering of interface cards
IBM data management and storage management
If you need additional performance monitoring, the optimal tool is IBM data management and storage management, which is provided by IBM Spectrum Control. You can manage performance and connectivity from the host file system to the physical disk, including in-depth performance monitoring and analysis of the storage area network (SAN) fabric.
|
Name change: Prior to version 5.2.8, IBM Spectrum Control was known as IBM Tivoli Storage Productivity Center.
|
IBM data management and storage management solutions deliver the functions of IBM Spectrum Control, a member of the IBM Spectrum Storage family.
For more information about IBM Spectrum Control, see the product details at this web page:
|
Notes:
•For initial and current releases of the IBM FlashSystem 900, IBM Spectrum Control does not support the product directly. The exception is if the FlashSystem 900 functions as an MDisk for the IBM SAN Volume Controller, in which case, IBM Spectrum Control supports the product through the SAN Volume Controller.
•SAN Volume Controller delivers the functions of IBM Spectrum Virtualize, part of the IBM Spectrum Storage family.
|
6.3 Volumes menu
This topic provides information about managing volumes.
You can use the FlashSystem 900 GUI or CLI svctask mkvdisk command to create a volume. After volumes are created, they can be mapped to a host by using the mkvdiskhostmap command.
The volumes are built from extents in the RAID 5 or RAID 0 flash module arrays, and the volumes are presented to hosts as logical units that the host sees as external disks.
The Volumes menu has two options:
•Volumes
•Volumes by Host
6.3.1 Navigating to the Volumes menu
When you hover the cursor over the Volumes function icon, the Volumes menu opens (Figure 6-53).

Figure 6-53 Navigate to the Volumes menu
6.3.2 Volumes menu
In the Volumes menu, click Volumes; the Volumes window opens (Figure 6-54). You can perform tasks on the volumes, such as create, expand, rename, and delete, or you can review the properties of the volume.

Figure 6-54 Volumes window that shows all volumes
Creating a volume by using the GUI
To create a volume using the GUI from the Volumes menu, click Create Volumes (shown in Figure 6-54 on page 200).
The Create Volumes window opens (Figure 6-55).

Figure 6-55 Create Volumes window
In this example, use volume name of SVC, a quantity of 4 volumes, and the requested capacity of 80 GB. Then, click OK; the task window opens (Figure 6-56).

Figure 6-56 Create Volumes task window
The Create Volume wizard now creates four volumes of 80 GB each. You can review the resulting volumes in the Volumes window (Figure 6-57).

Figure 6-57 Four SAN Volume Controller volumes created
The newly created volumes have no host mappings at the time of their creation. Host mapping can be performed from the Volumes > Volumes by Host window. For the instructions to map volumes to a host, see “Mapping volumes” on page 207.
Creating a volume by using the CLI
Example 6-2 shows the CLI process for creating a volume. More or fewer parameters can be applied to the mkvdisk command. Example 6-2 specifies the minimum required.
Example 6-2 Create a volume by using the CLI
IBM_Flashsystem:FlashSystem_900:superuser>mkvdisk -size 15 -unit gb -name SVC_4
Virtual Disk, id [7], successfully created
IBM_Flashsystem:FlashSystem_900:superuser>lsvdisk
id name IO_group_name status capacity vdisk_UID
0 WIN2008_1 io_grp0 online 40.00GB 0020c24000000000
1 WIN2008_2 io_grp0 online 50.00GB 0020c24001000000
2 WIN2008_3 io_grp0 online 50.00GB 0020c24002000000
3 WIN2008_4 io_grp0 online 39.99GB 0020c24003000000
4 SVC_1 io_grp0 online 15.00GB 0020c24004000000
5 SVC_2 io_grp0 online 15.00GB 0020c24005000000
6 SVC_3 io_grp0 online 15.00GB 0020c24006000000
7 SVC_4 io_grp0 online 15.00GB 0020c24007000000
IBM_Flashsystem:FlashSystem_900:superuser>
Performing actions on volumes
From the Volumes window, you can perform various actions on the volumes. Click Actions to access these operations (Figure 6-58), or you can right-click the volume name, which opens a list of operations you can do to the volume.

Figure 6-58 Actions of a single volume
Figure 6-59 shows the properties of a volume that indicate the volume name, its capacity, and its sector size. Each volume has a unique ID (UID), which can be discovered from the host side as a property of the logical unit. The volume is currently not mapped to a host.

Figure 6-59 Properties of a volume
A volume can be expanded while it is online, therefore maintaining full functionality to the connected hosts. Not all operating systems, however, allow concurrent expansion of their disks so precaution must be taken that the operating system supports it. An alternative to expanding the disk is to create and map a new disk for the host.
Expanding a volume that is mapped to an AIX host
When more than one volume is selected, the number of enabled actions for the volumes is reduced to only Expand and Delete (The Delete option is shown as disabled in Figure 6-60).

Figure 6-60 Expand four volumes
Figure 6-61 shows that each of the volumes should be expanded to a size of 120 GB.

Figure 6-61 Expand to 120 GB
The resulting Volumes window displays the new capacity (Figure 6-62).

Figure 6-62 Four volumes expanded
The IBM FlashSystem 900 supports the ability to dynamically expand the size of a volume if the AIX host is using AIX version 5.2 or later.
Use the AIX chvg command options to expand the size of a physical volume that the Logical Volume Manager (LVM) uses without interruptions to the use or availability of the system. For more information, see AIX 7.1 Operating System and Device Management at the following web page; at this web page, search for operating system and device management:
Expanding a volume that is mapped to a Microsoft Windows host
You can use the GUI and the CLI to dynamically expand the size of a volume that is mapped to a Microsoft Windows host.
After expanding the volume, using the same procedure as shown in the previous examples (Figure 6-60 on page 204 and Figure 6-61 on page 204) for Windows, start the Computer Management application and open the Disk Management window under the Storage branch.
If the Computer Management application was open before you expanded the volume, use the Computer Management application to issue a rescan command. You will see the volume that you expanded now has unallocated space at the right side of the disk.
If the disk is a Windows basic disk, you can create a new primary or extended partition from the unallocated space.
If the disk is a Windows dynamic disk, you can use the unallocated space to create a new volume (simple, striped, or mirrored) or add it to an existing volume.
Shrinking a volume
The shrink volume option is only provided through the CLI and cannot be performed by using the GUI. Volumes can be reduced in size, if necessary. However, if the volume contains data, do not shrink the size of the disk, because shrinking a volume will destroy the data.
When shrinking a volume, be aware of the following considerations:
•Shrinking a volume removes capacity from the end of the volume’s address space. If the volume was used by an operating system or file system, predicting what space was used might be difficult. The file system or OS might be dependent on the space that is removed, even if it is reporting a large amount of free capacity.
•If the volume contains data that is used, do not attempt under any circumstances to shrink a volume without first backing up your data.
You can use the shrinkvdisksize CLI command to shrink the physical capacity that is allocated to the particular volume by the specified amount.
The shrinkvdisksize command uses this syntax:
shrinkvdisksize -size capacitytoshrinkby -unit unitsforreduction vdiskname/ID
|
Attention: Shrinking a volume is a data-destructive action. Only shrink volumes that are not in use and that do not contain data.
|
Shrinking a volume is shown in Example 6-3. A volume is called a vdisk in the CLI.
Example 6-3 Shrink a volume (vdisk)
IBM_Flashsystem:Cluster_9.xx.xx.242:superuser>lsvdisk
id name IO_group_name status capacity vdisk_UID
0 WIN2008_1 io_grp0 online 50.00GB 0020c24000000000
1 WIN2008_2 io_grp0 online 50.00GB 0020c24001000000
2 WIN2008_3 io_grp0 online 50.00GB 0020c24002000000
3 WIN2008_4 io_grp0 online 50.00GB 0020c24003000000
IBM_Flashsystem:Cluster_9.xx.xx.242:superuser>shrinkvdisksize -size 10 -unit gb WIN2008_1
IBM_Flashsystem:Cluster_9.xx.xx.242:superuser>lsvdisk
id name IO_group_name status capacity vdisk_UID
0 WIN2008_1 io_grp0 online 40.00GB 0020c24000000000
1 WIN2008_2 io_grp0 online 50.00GB 0020c24001000000
2 WIN2008_3 io_grp0 online 50.00GB 0020c24002000000
3 WIN2008_4 io_grp0 online 50.00GB 0020c24003000000
IBM_Flashsystem:Cluster_9.xx.xx.242:superuser>
6.3.3 Volumes by Host
Clicking the Volumes → Volumes by Host option opens the window where unmapped and mapped volumes are listed. This window shows which hosts are created on the system and which volumes exist. If the volumes are currently unmapped, they appear as Unmapped Volumes and a plus sign (+) is visible to the left (Figure 6-63).

Figure 6-63 Volumes by Host window
Mapping volumes
When you click the plus sign (+) to expand the Unmapped Volumes window, a list of unmapped volumes is provided. This example has four volumes named SVC_1, SVC_2, SVC_3, and SVC_4. To map them to the host SAN Volume Controller (SVC), highlight all four Volumes and click Actions → Map to Host (or right-click) as shown in Figure 6-64.

Figure 6-64 Map Volumes to Host

Figure 6-65 Map Volumes: Select the host SVC
Figure 6-66 shows the Modify Mappings window where the CLI commands for mapping the volumes are run.

Figure 6-66 Map Volumes: CLI commands display
The Volumes by Host window now shows that the four SVC volumes are mapped and online (Figure 6-67).

Figure 6-67 Volumes mapped to host SVC
Figure 6-67 also shows that a modified menu bar to include the LUN ID and Volume Unique Identifier as described in “Change the Events view” on page 182.
Mapping a volume by using the CLI
A useful way for administrators to perform this task might be to use the CLI. Volumes can be mapped by using the svctask mkvdiskhostmap command.
Example 6-4 shows how a volume is mapped to a host by using the CLI.
Example 6-4 Map volume by using the CLI
IBM_Flashsystem:FlashSystem_900:superuser>svctask mkvdiskhostmap -force -host 0 4
Virtual Disk to Host map, id [4], successfully created
IBM_Flashsystem:FlashSystem_900:superuser>lsvdiskhostmap 4
id name SCSI_id host_id host_name vdisk_UID IO_group_id IO_group_name
4 SVC_5 4 0 SVC 0020c24004000000 0 io_grp0
IBM_Flashsystem:FlashSystem_900:superuser>
In the CLI process for mapping volumes, this example uses the logical number for the host and the logical number for the volume. These logical numbers can be discovered by using the following commands:
•lshost: Shows defined hosts and their status
•lsvdisk: Shows defined volumes and their preferences
Unmapping volumes
When you delete a volume mapping, you are not deleting the volume, but you are deleting only the connection from the host to the volume. If you mapped a volume to a host by mistake or if you simply want to reassign the volume to another host, click Volumes → Volumes by Host. Highlight the volume or volumes that you want to unmap, right-click, and click Unmap from Host (Figure 6-68).

Figure 6-68 Unmap volumes from host
The Unmap 2 Volumes from Host window opens, indicating that the selected volumes will be unmapped (Figure 6-69).

Figure 6-69 Unmapping volumes final step
By unmapping the volumes as shown in these windows, the volumes are made unavailable to the host. If data on the volumes is to be preserved, the host must unmount the disk before the volume is unmapped so that the connection to the disk is closed correctly by the host.
|
Note: Before unmapping a volume from a host, the host must unmount the connection to the disk or I/O errors appear.
|
After a volume is unmapped, it is listed in under Unmapped Volumes (Figure 6-70) of the FlashSystem 900 GUI. The volumes can now be deleted or can be mapped to another host.

Figure 6-70 Unmapped volumes section
6.4 Hosts menu
Use the Hosts menu to manage hosts.
You can use the FlashSystem 900 GUI or the CLI mkhost command to create a logical host object. Creating a host object associates one or more worldwide port names (WWPNs) or InfiniBand IDs, of host bus adapters, with a logical host object.
You can then use the created host to map volumes (also called virtual disks or VDisks) to hosts by using the GUI or CLI mkvdiskhostmap command.
The Hosts menu has two options:
•Hosts
•Volumes by Host
6.4.1 Navigating to the Hosts menu
The GUI Hosts menu and its options are described. When you hover the cursor over the Hosts function icon, the Hosts menu opens (Figure 6-71).

Figure 6-71 Navigate to the Hosts menu
Adding a host
The process of creating a host object includes specifying the host name and selecting ports for the host.
The FlashSystem 900 models are either InfiniBand, Fibre Channel (FC), Fibre Channel over Ethernet (FCoE), or iSCSI capable. However, interface cards cannot be mixed, and a single system must contain only a single type of interface card.
The FlashSystem 900 detects which type of interface cards are installed, and the Add Host wizard automatically adjusts to request the host port type for the actual model. For example, this can be the FC worldwide port name (WWPN), or the iSCSI initiator name or iSCSI qualified name (IQN).
Figure 6-72 shows the Hosts window where the defined hosts display.

Figure 6-72 Hosts window showing already configured hosts
The Figure 6-72 example shows the Degraded state for the Linux host and other hosts. Each connected host initiator port must be zoned and connected to both canisters in the IBM FlashSystem 900. If not, the host reports a Degraded state. The risk of having a host with degraded paths is that the host might loose access to storage in case of canister failure or reboot, which then might cause unplanned downtime.
The FlashSystem 900 uses redundant controller canisters. These might reboot because of system failure. Canister reboot also happens multiple times during firmware update.
Hosts in a FlashSystem 900 configured with FC interface cards
To create a host object, click Add Host in the upper-left corner of the Hosts window. The Add Host window opens. Type the name Exchange01 for the new host and click the arrow at the right side of Host port (WWPN) entry field to select the WWPNs for your Exchange server. Any WWPNs that are zoned to the system, but not already in use by a configured host, appear as shown in Figure 6-73.

Figure 6-73 Add ports to the new host (the refresh icon is highlighted)
If no WWPNs are listed, the following message is displayed:
No candidate HBA ports were found
In that case, either the WWPN is already used for another host object or the host was not zoned correctly to the FlashSystem 900.
|
Tip: To refresh the list, click the refresh icon, which is highlighted in Figure 6-73.
|
Up to four WWPNs for each host can be selected. This example uses only two configured WWPNs for the Exchange server; click Add (Figure 6-74).

Figure 6-74 Add new host
The newly created Exchange01 host is now online and has two ports (Figure 6-75).

Figure 6-75 Host Exchange01 is now created and online
All WWPNs in a host object are mapped to the virtual disks.
Click Actions at the Hosts window to see the options for managing and examining the newly created host (Figure 6-76):
•Rename: rename the host
•Manage Host Ports: add or remove WWPNs
•Remove host: this is possibly only when no host mappings exist
•Host Ports: view status of host ports
•Properties: view properties of the host

Figure 6-76 View status of host ports
To view the properties and status of the host ports, click Host Ports. This example has two ports for the host Exchange01. The WWPNs are displayed and the status for each port is displayed as shown in Figure 6-77.

Figure 6-77 Host ports for the Exchange01 host
A correctly zoned and configured host port displays as active. Right-click in the blue row at the top of the WWPN column so you can customize columns, to select what you want to see or clear what you do not want to see.

Figure 6-78 Manage Host Ports
In this example, you want to remove host ports, so select one of the Exchange01 host ports and click Actions → Unassign Host Port (Figure 6-79).

Figure 6-79 Manage host ports for host Exchange01 to remove ports
After unassigning the host port, click Close to return to the Hosts view (Figure 6-80) which shows that the Exchange01 host is Online and only a single port is active.

Figure 6-80 Host now only has a single WWPN port configured
Under normal conditions, any configured host should have at least two configured host ports for redundancy. However, you might have reasons for unassigning a host port as demonstrated in this example. One reason might be that if a host bus adapter (HBA) for a host is replaced, SAN zoning and storage systems must be reconfigured for the new host WWPN.
Creating a host by using the CLI
To create a host through the CLI, use the svctask mkhost and svctask addhostport commands, as demonstrated in Example 6-5.
Example 6-5 Create host and add one more port
IBM_Flashsystem:Cluster_9.xx.xx.xxx:superuser>svctask mkhost -fcwwpn 5005076801300004 -force -name SVC
Host, id [1], successfully created
IBM_Flashsystem:Cluster_9.xx.xx.xxx:superuser>svctask addhostport -fcwwpn 50050768013A0004 -force SVC
IBM_Flashsystem:Cluster_9.xx.xx.xxx:superuser>lshost
id name port_count iogrp_count status
0 test 1 1 offline
1 SVC 2 1 offline
IBM_Flashsystem:Cluster_9.xx.xx.xxx:superuser>lshost SVC
id 1
name SVC
port_count 2
type generic
mask 1111111111111111111111111111111111111111111111111111111111111111
iogrp_count 1
status offline
WWPN 50050768013A0004
node_logged_in_count 0
state offline
WWPN 5005076801300004
node_logged_in_count 0
state offline
IBM_Flashsystem:Cluster_9.xx.xx.xxx:superuser>
The svctask addhostport command must be run one time for every host port that you want to define for your host object.
Hosts in a FlashSystem 900 configured with iSCSI interface cards
To check which iSCSI hosts exist, navigate to the Hosts > Hosts window (Figure 6-81). To create a new host click Add Host in the upper left corner of the Hosts window.

Figure 6-81 Review iSCSI hosts from the Hosts menu
The Add Host window opens (Figure 6-82). Type the host name and the iSCSI IQN name obtained from the iSCSI hosts iSCSI initiator software at the host to be connected. Click Add to create the host.

Figure 6-82 Create iSCSI host
Figure 6-83 shows the hosts, including the newly created Win2008_File_SRV host that you just created.

Figure 6-83 New iSCSI host created
The new host does not yet have any host mappings. Host mappings for iSCSI hosts can be created in the same way as host mappings for FC and FCoE systems, which was demonstrated in “Mapping volumes” on page 207.
As discussed in “Creating a host by using the CLI” on page 216, any single host initiator port must be able to communicate with both FlashSystem 900 controllers called the target ports. If not, hosts are not able to perform path failover in case of FlashSystem 900 canister reboot, which can cause unplanned downtime, because the iSCSI host loses access to storage.
That means that an iSCSI-attached host must have its iSCSI initiator software configured so that each of its iSCSI initiators connects to at least one iSCSI target port on each FlashSystem 900 canister.
A FlashSystem 900 configured for iSCSI has four interface cards, each with four iSCSI ports. To provide enough bandwidth for failover purposes and redundancy, a more suitable configuration is that each iSCSI initiator is configured to connect to one target port on each FlashSystem 900 interface card for a total of four connections.
For more information about how to configure host connectivity, see Chapter 5, “IBM FlashSystem 900 client host attachment and implementation” on page 101.
6.4.2 Volumes by Host
The Volumes by Host option on the Hosts menu is functionally identical to the Volumes by Host option on the Volumes menu (see 6.3.3, “Volumes by Host” on page 206).
6.5 Access menu
Various levels of user access to the FlashSystem 900 system are managed through the Access menu. The access levels are divided into groups. Each group has a different level of access and authority. If you want, multiple users can be defined and their access assigned to suit the tasks that they perform.
The Access menu has the following options:
•Users
•User Groups
•Audit Log
6.5.1 Navigating to the Access menu
Hover the cursor over the Access function icon, and a menu opens (Figure 6-84).

Figure 6-84 Navigate to the Access menu
The Access menu allows user management and audit log review.
User management includes the creation of new users and the maintenance of roles and passwords for existing users. Also, part of user management is the configuration of Secure Shell (SSH) keys to provide secure access to the CLI for users.
The audit log provides a list of all commands executed on the system and also contains information about which user ran the command.
6.5.2 Users window
Figure 6-85 shows the Users window. From this window you can create and delete users, change and remove passwords, and add and remove SSH keys.

Figure 6-85 Users window
Click Create User to open the Create User window (Figure 6-86). You can enter the name of the user and the password, and load the SSH key (if the SSH key was generated). You can choose either to use SSH or a password for CLI authentication.
|
Note: You must have superuser authority to perform this action.
|

Figure 6-86 Create user
Figure 6-86 shows that a local user nick is created and a password is created for that user to authenticate to the system. When user nick opens his SSH client and points it to the IP address of the system to which he is granted access, he is prompted for the user name and password.
If the user is required to authenticate by using an SSH key pair, you instead enter the path for the public key in the SSH Public Key field in the Create User window, as shown in Figure 6-87 on page 221.
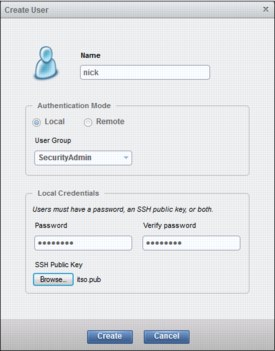
Figure 6-87 Create user as SSH key enabled
The Password and Verify password fields are used for GUI access. If a password is not configured, the user is not able to log in to the GUI.
When the SSH key is generated by using PuTTYgen, you have the choice of configuring a passphrase or not. If the SSH key pair was generated without a passphrase, the user nick is not prompted for a password when he opens his SSH client. He is then authenticated with the private key that matches the uploaded public key. If a passphrase was configured when the SSH key pair was created, the user nick also needs to type the passphrase password when opening the CLI to access the system.
For information about how to create SSH keys by using PuTTYgen, see “Generating an SSH key pair by using PuTTY” on page 223.
Now, the new user is listed (Figure 6-88) and an SSH key is enabled for that user.

Figure 6-88 User is now created and SSH key enabled
Configuring CLI access, including how to configure SSH keys for secure access only, is described in 6.5.3, “Accessing CLI by using PuTTY” on page 223.
Click Actions to see list of options for managing users (Figure 6-89).

Figure 6-89 Manage user actions
To test whether the new user can log in to the GUI, log out as user superuser and log in as user nick. The login window is shown in Figure 6-90.

Figure 6-90 Log in as user nick
The user area of the GUI in the upper-right corner now shows that user nick is the current user, as shown in Figure 6-91.

Figure 6-91 User nick logged in
6.5.3 Accessing CLI by using PuTTY
PuTTY is a no-charge implementation of Telnet and SSH for Windows and UNIX platforms. PuTTY can be downloaded from the following website:
The CLI commands for the IBM FlashSystem 900 use the SSH connection between the SSH client software on the host system and the SSH server on the system.
You must create a system before you can use the CLI.
To use the CLI from a client system, follow these steps:
1. Install and set up the SSH client software on each system that you plan to use to access the CLI.
2. Authenticate to the system using a password.
3. If you require command-line access without entering a password, use an SSH public key. Then, store the SSH public key for each SSH client on the system.
Generating an SSH key pair by using PuTTY
To use the CLI with SSH keys enabled, you must generate an SSH key pair. SSH keys can be generated from a Windows host using the PuTTY key generator, PuTTYgen, by completing the following steps:
1. Run puttygen.exe.
2. Click SSH-2 RSA as the type of key to generate.
Keep the number of bits in a generated key value at 1024.
3. Click Generate and then move the cursor around the blank area of the Key section to generate the random characters that create a unique key. When the key is completely generated, the information about the new key is displayed in the Key section.
4. Optional: Enter a passphrase in the Key passphrase and Confirm passphrase fields. The passphrase encrypts the key on the disk; therefore, it is not possible to use the key without first entering the passphrase.
5. Save the public key by following these steps:
a. Click Save public key. You are prompted for the name and location of the public key.
b. Type icat.pub as the name of the public key and specify the location where you want to save the public key. On your computer for example, you can create a directory called keys to store both the public and private keys.
c. Click Save.
6. Save the private key by following these steps:
a. Click Save private key. The PuTTYgen Warning panel is displayed.
b. Click Yes to save the private key without a passphrase.
c. Type icat as the name of the private key, and specify the location where you want to save the private key. For example, you can create a directory on your computer called keys to store both the public and private keys. We suggest that you save your public and private keys in the same location.
d. Click Save.
7. Close the PuTTY Key Generator window.
Figure 6-92 shows the folder where you saved the public and private keys that were generated using PuTTYgen.

Figure 6-92 SSH keys created using PuTTYgen
Accessing the CLI with SSH keys enabled
To access the FlashSystem 900 CLI using PuTTY as the SSH client, a several configurations must be performed with PuTTY:
1. Type the IP address or name of the FlashSystem 900. The name can be used if the name resolution, Domain Name System (DNS), is configured. Ensure that SSH is selected and that port 22 is used for the connection, as shown in Figure 6-93.

Figure 6-93 Configure PuTTY (step 1 of 3)
2. For configuring the SSH client session with the correct private key for user dennis, complete the following steps.
a. Expand Connection → SSH and click Auth.
b. In the Private key file for authentication field, type the path for the SSH private key that matches the public key loaded on the FlashSystem 900 for the user dennis.
Figure 6-94 shows to load the private key for the user dennis.

Figure 6-94 Configure PuTTY step 2 of 3
3. To save the connection, type a name and click Save. Now, the connection settings are saved for the next time that you use them. Click Open to start the CLI session.
Figure 6-95 shows that the configured session is saved.

Figure 6-95 Configure PuTTY step 3 of 3
Example 6-6 shows that user dennis logs in to the CLI. He is prompted for a passphrase (password), which was configured when the SSH key pair was generated.
Example 6-6 User dennis logs in to the CLI by using PuTTY
login as: dennis
Authenticating with public key "rsa-key-20131022"
Passphrase for key "rsa-key-20131022":********
Last login: Tue Oct 22 08:46:27 2013 from 9.xxx.xxx.xx
IBM_Flashsystem:FlashSystem_900:dennis>
Details about setting up CLI access and generating SSH keys are at the FlashSystem 900 web page in the IBM Knowledge Center:
6.5.4 User groups
Administrators can create role-based user groups where any users who are added to the group adopt the role that is assigned to that group. Roles apply to both local and remote users on the system and are based on the user group to which the user belongs. A local user can belong to only a single group; therefore, the role of a local user is defined by the single group to which that user belongs. Users with the Security Administrator role can organize users of the system by role through user groups.
You can assign the user roles to users of the system, as shown in Table 6-1.
Table 6-1 User groups available on the IBM FlashSystem 900
|
Name
|
Role
|
|||
|
SecurityAdmin
|
Users with this role can access all functions on the system, including managing users, user groups, and user authentication.
|
|||
|
Administrator
|
Users with this role can access all functions on the system, except those functions that deal with managing users, user groups, and authentication.
|
|||
|
Monitor
|
Users with this role can view objects and system configuration but they cannot configure, modify, or manage the system or its resources.
|
|||
|
Service
|
Users with this role have monitor-role privileges and can view the system information, begin the disk-discovery process, and include disks that are excluded. This role is used by service personnel.
|
|||
All users must be a member of a predefined user group.
Creating a user group
To create a new user group, navigate to Access → User Groups and click Create New user Group.
Figure 6-96 on page 227 shows the User Groups window, which lists the default local user groups and one remote user group.

Figure 6-96 User Groups window
For more information about configuring remote authentication, see 7.1.3, “Security menu” on page 243.
The Create User Group window opens. Provide a Group Name and select a Role for the new user. If the group that is created is for remote authentication, select Enable LDAP for this group (available only for LDAP authentication; not required for the Operations group).
In this example, you create a new group named Operations and provide the role Monitor for this new group (Figure 6-97). The new group is a local group, and does not require Lightweight Directory Access Protocol (LDAP) authentication.

Figure 6-97 Create a user group called Operations
Click Create in the Create User Group window; the new group is created. To view the new group, click Access → User Groups.
The User Groups window opens (Figure 6-98).

Figure 6-98 User group named Operations was created
After creating a new user group, add users to that group. Navigate to Access → Users and click Create User. The Create User window opens. Type the name of the new user and select the User Group Operations (Figure 6-99). A password must be typed and confirmed or the user is not able to log in to the GUI.

Figure 6-99 Create the user james and add it to a user group
After clicking Create, user james is now created and added to the Operations user group. User james can now log in to the GUI and CLI by using the provided password. This user will have the privileges from the user group Operations, which has the role Monitor.
|
Note: If remote authentication is not enabled in the Settings → Security menu, the Create User Group window does not give you the option to create the group for remote authentication and LDAP (Figure 6-97 on page 227).
|
6.5.5 Audit log menu
An audit log tracks action commands that are issued through an SSH session or through the management GUI.
The audit log entries provide the following information:
•Identity of the user who issued the action command
•Name of the actionable command
•Time stamp of when the actionable command was issued on the configuration node
•Parameters that were issued with the actionable command
The following commands are not documented in the audit log:
•dumpconfig
•cpdumps
•cleardumps
•finderr
•dumperrlog
•dumpinternallog
•svcservicetask dumperrlog
•svcservicetask finderr
The following items are also not documented in the audit log:
•Commands that fail are not logged.
•A result code of 0 (success) or 1 (success in progress) is not logged.
•The result object ID of the node type (for the addnode command) is not logged.
•Views are not logged.
Reviewing the audit log
To review the audit log, select Access → Audit Log. The Audit Log window opens (Figure 6-100 on page 230).

Figure 6-100 Audit Log window
The audit log can be filtered to display only selected users or within a specific time frame. The audit log can also be filtered to show from which IP address a specific command was run.
Figure 6-101 shows filtering options where you add the IP address of the logged in user.

Figure 6-101 Viewing the Audit Log menu by customizing columns
Also, you can export the audit log to a comma-separated file.
..................Content has been hidden....................
You can't read the all page of ebook, please click here login for view all page.