
System administrators use scripts every day. Quite a lot of this activity involves using scripts to verify that systems continue to run properly, as well as to gather performance information.
MRTG, short for the Multi Router Traffic Grapher, was originally designed to monitor the network traffic from one or more routers. MRTG takes a very useful approach to network monitoring: It outputs web pages showing the network traffic data. The actual graphs are image files in PNG format. Thus, you need no special software to view the network statistics. In addition, you can view the data remotely if you have a web server running on the system on which MRTG runs.
One of the most useful aspects of MRTG is that the package can monitor just about anything. In addition, anything it can monitor, it can graph. Furthermore, MRTG uses a fixed amount of disk space for storing its statistics. (Older data get replaced by averages.) This means MRTG won't fill your hard disks with data files over time.
MRTG proves useful for all of the following purposes:
Monitoring network throughput, the purpose for which MRTG was originally designed
Monitoring CPU usage
Tracking disk usage
Watching for spikes in allocated memory
Ensuring that applications such as web servers, database managers, and network firewalls remain functioning
This chapter covers using MRTG to graph system, network, and application data. Using MRTG is fun, as you can get immediate visual feedback about your scripts. As you'll see, however, this chapter covers far more than just MRTG. Along the way, you'll learn how to use scripts to monitor your system's CPU, disk, memory, networks, and applications. These techniques are useful even if you never run MRTG.
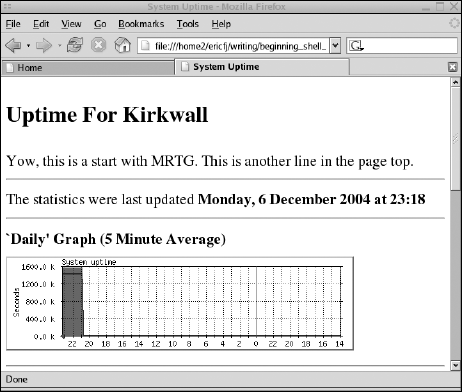
MRTG is an application that, when run, checks a configuration file. MRTG then monitors all of the items defined in the configuration file, called targets. A target is a system or network router to monitor or, more important, a script to run. You configure which targets MRTG should graph by editing a text file. MRTG then runs the configured script for each target. MRTG stores the data in special MRTG data files. At the end of its run, MRTG generates graphs for all of the configured items. By default, MRTG generates daily, weekly, monthly, and yearly graphs of the monitored data. Figure 12-1 shows an example web page created by MRTG.
To graph data over time, you need to run MRTG periodically. By default, you should run MRTG every five minutes. On Unix and Linux systems, use a utility called cron to run MRTG every five minutes. On Windows, you can set up MRTG as a scheduled task.
For example, MRTG includes code to monitor the traffic going through network routers. Running MRTG every five minutes enables you to see the network throughput in terms of input and output packets, over time. You can use MRTG's graphs to identify times of the day when your servers face the heaviest load and also help to track down network problems.
cron enables you to run applications or scripts in the background at scheduled intervals. For example, you may want to run a backup every night.
MRTG uses SNMP, the Simple Network Management Protocol, to monitor network routers. If your routers support SNMP, you can use MRTG out of the box to monitor the router traffic. If you run SNMP on other systems, you can configure MRTG to monitor any values provided by SNMP.
Note
SNMP includes a network protocol for gathering data from remote network devices. Most routers support SNMP to report statistics on packets sent and received, errors encountered, and so on. With SNMP client software, included in MRTG, you can query the remote device for whatever data it provides. (The remote device may be protected by security to prevent unwanted access.)
Because so many routers support SNMP, MRTG is enabled to read data via SNMP.
Many server systems also provide information via SNMP. If this is the case, you can use SNMP to query for available disk space, memory usage, and a full listing of every running process. SNMP-enabled printers can even report when they run out of paper. You can configure MRTG to monitor any of this data.
MRTG works by polling for values during every specified time period—that is, every time you run MRTG. By default, MRTG expects to poll for data every five minutes. The data MRTG acquires every five minutes is merely two values per item, or target, MRTG monitors. In addition, because MRTG only needs two values (numbers) per target it monitors, you can set up all sorts of interesting monitoring scripts.
In addition to supporting SNMP-accessible data, MRTG can graph literally anything that can provide two values over time. It is this factor that makes MRTG so interesting. See the section Writing Scripts for MRTG, later in this chapter, for more on this topic.
MRTG is written in Perl, another scripting language, with performance-intensive parts written in C. The C parts must be compiled for each platform. This means you need to either build MRTG from the source code or download MRTG prebuilt for your system.
Download MRTG from the MRTG home page at
http://people.ee.ethz.ch/∼oetiker/webtools/mrtg/. MRTG is free under an open-source license.
For Linux systems, you can download an RPM package file of MRTG. Or you can use a tool such as apt, yum, or up2date, shown in the following example, to download and install MRTG:
# up2date mrtgIn this example, the up2date command will download the package named mrtg and then install the package, if there are no conflicts with existing packages.
See Red Hat RPM Guide (Wiley, 2002) for more on RPM package management on Linux and other operating systems.
Note
Part of MRTG's success is due to its use of a fixed amount of disk space to store its statistics. By compressing past data to averages, MRTG dramatically cuts the amount of space it requires. In addition, by sticking to a fixed amount of space, you don't have to worry about MRTG filling your hard disk over time. The last thing you want from a monitoring tool is the tool itself crashing your system.
The fixed-size database of statistics is available separately from MRTG. It's called RRD, for round-robin database, and you can download this package from http://people.ee.ethz.ch/∼oetiker/webtools/rrdtool/.
You can script the rrdtool program to store statistics and later retrieve them. You can also use rrdtool to generate images on the fly, creating graphs of the data on demand.
Each time you run the mrtg command, MRTG either uses SNMP to gather data or executes a script or program for each configured target.
MRTG runs a script or program that MRTG expects to output four values. Each value should appear on a separate line. MRTG then collects the data. Each run of the script provides one data point. The format required is listed in the following table.
Line | Holds |
|---|---|
Line 1 | Value of the first variable |
Line 2 | Value of the second variable |
Line 3 | Uptime of the system, as a human-readable text string |
Line 4 | Name of the system or target |
In normal usage, the first variable holds the count of incoming bytes or packets. The second variable holds the count of outgoing bytes or packets.
You can set the third line to either the output of the uptime command or to dummy text (such as dummy). This value is only used in the HTML web output. If you remove that section from the output, you can output dummy text. Otherwise, you want to output text that states how long the system has been up, or running, since its last shutdown or crash.
The fourth name should be the system or target name. This name, again, is just used for the display. In practice, it usually works well to pass this name on the command line to your script. This approach enables your script to monitor several targets. For example, a script that tracks disk usage could be applied to monitor any system at your organization. By passing the hostname of the system, you can make a more generic script.
For a script to work with MRTG, you must mark the script with execute permission, and you must insert the magic first-line comment that specifies the shell that should run the script. The following first-line comment, for example, specifies that the Bourne shell should run the script:
#!/bin/sh
See Chapter 4 for more information about the magic first-line comment.
You can test this out by writing a script to read from the Linux /proc file system, as in the following example. The Linux /proc file system holds special pseudo-files that contain system information. Your scripts can read directly from these pseudo-files as if they were real files. The files in /proc contain information on memory usage, disk consumption, and network statistics, along with detailed information on each running process.
Note
It is vitally important that you test your scripts prior to running them from MRTG. Because MRTG runs in the background, you may never know something has gone wrong until you have lost a lot of valuable data.
Note
Remember to test your scripts before you try to use MRTG to run them. Luckily, because your scripts are supposed to output four lines, you can easily test these scripts to determine whether they work properly. Chapter 11 has more on the whys and wherefores of testing.
Once you have a script and you've tested it, you're ready to start working on MRTG.
The most difficult aspect of using MRTG is writing the configuration file. Once you've done this, though, you can simply copy a configuration file and edit just a few values. Furthermore, if you have an example configuration file from which to work, configuring MRTG will be a lot easier.
On Linux, the default MRTG configuration file is located at /etc/mrtg/mrtg.cfg. Because you pass the name of the configuration file to the mrtg command, you can store this file anywhere. If you use MRTG to monitor routers or other SNMP devices, store the configuration file in a secure directory that other users cannot read, because the MRTG configuration file will hold SNMP community names and passwords.
MRTG comes with good documentation, but expect to attempt to run MRTG a few times before everything works to your satisfaction. You'll usually need to edit the MRTG configuration file, run the mrtg command, and then view the output a few times before everything works right. Expect to repeat this cycle until it all works. The following sections show you how to configure MRTG and create the configuration file needed by this program.
Each time you run MRTG, the mrtg command loads in its configuration file. This file defines which targets to monitor. The configuration file also defines output options for customized HTML and other aspects of a single MRTG run.
To configure MRTG, you need to do the following:
Configure the
mrtgcommand to run your scripts by editing the MRTG configuration file.Customize the output, again by editing the MRTG configuration file.
The first step in configuring MRTG is to define the directories it should work in and use to store data.
To run MRTG, you first need to name a number of directories. You need to define output directories in which MRTG finds images used in HTML files and where MRTG should store the HTML files it produces. Normally, MRTG should create one HTML file per target you define.
For example, to define the output directories, you can use the following:
HtmlDir: /var/www/mrtg
ImageDir: /var/www/mrtg
You also need to define at least two directories in which MRTG will log data and alert you if data crosses thresholds, as shown here:
LogDir: /var/lib/mrtg
ThreshDir: /var/lib/mrtg
You can define several threshold settings. See the MRTG documentation for more information.
You can also set the WorkDir directory to define one top-level directory, as shown in the following example:
WorkDir: /opt/mrtg
All other directories will then be located underneath the work directory. In many cases, you need to separate the HTML output to a set of directories that can be accessed by your web server (such as Apache). Thus, the output directories need to be in a more public location. The internal working files used by MRTG, and the logs and alerts it generates, should reside in a less public directory. Because of this, all the examples define the HtmlDir, ImageDir, LogDir, and ThreshDir separately. None of the examples use the WorkDir setting.
After you set up the MRTG directory settings, you can optionally tell MRTG to run forever in daemon mode. (A daemon is a process that runs in the background as a server. The term is essentially equivalent to a Windows service.)
If you run MRTG in daemon mode, then the mrtg command will run forever (until killed). The mrtg command will handle all scheduling tasks, such as gathering data every five minutes. If you tell MRTG to run as a daemon, you should also define the data-gathering interval, such as five minutes:
RunAsDaemon: Yes
 Interval:    5
Note
Even if you plan to run MRTG in daemon mode, don't set this up yet. You'll want to run the mrtg command repeatedly as you wring out all the configuration and script issues. Only when everything works fine should you set up daemon mode or run MRTG under cron or another scheduler.
When you have verified that MRTG works properly with your configuration, you can define MRTG either as a daemon or to run from cron. If you define MRTG as a daemon, you need to edit your system startup scripts to launch MRTG each time your system reboots.
After filling in the global values, the next step is to configure MRTG to run your scripts.
You need to configure MRTG to call your scripts. Do this by setting up a target for each script you want MRTG to run.
You must define at least two parameters per target: the target itself, which defines the script to run, and the maximum number of bytes. The syntax follows:
Target[target_name]: `script_to_run` MaxBytes[target_name]:value
Replace the target_name with the name of your target. You must be consistent with the name over all the settings for that target. For example, if the target name is uptime, you could define a target as follows:
Target[uptime]: `/usr/local/bin/up2mrtg kirkwall`
MaxBytes[uptime]: 10001010
Be sure to place the script to run, with all its needed parameters, inside the backticks. (This is similar to how you define command substitution in a shell script.) Note how the example passes the command-line argument kirkwall to the script. In addition, note how you need to include the full path to your script. You may want to copy your scripts to a common system directory, such as /usr/local/bin, as used in this example.
Set the MaxBytes to some large setting (this is most useful for SNMP-related targets).
You can define additional targets, all of which require the Target and MaxBytes settings. These two settings are all you really need to define a shell script as a target.
After defining the basics for a target, you most likely will want to customize the HTML output, along with the graphs. If you don't, you'll see graph legends appropriate for router traffic, which is probably not what you want. The next two sections elaborate on how you can customize the HTML produced by MRTG, along with the graphs, which are generated as image files.
The Title option sets the title of the generated HTML document:
Title[uptime]: System Uptime
As shown previously, you must use a consistent name for the target, here referenced as uptime. You can define HTML codes for the top of the output page using the PageTop option, as shown here:
PageTop[uptime]: <H2>Uptime For Kirkwall</H2>
  Yow, this is a start with MRTG.
  This is another line in the page top.
This shows an example of a multi-line value. With MRTG, you must indent each following line by a few spaces. If you don't, MRTG won't know that you want a longer value.
You can also define several HTML configuration options, as shown in the following table.
Option | Holds |
|---|---|
PageTop | HTML codes added to the beginning of the document body. |
PageFoot | HTML codes added to the end of the document body. |
AddHead | Adds text between the end of the title tag and prior to the end of the head tag. This is mostly useful for linking to external Cascading Style Sheets (CSS files). |
BodyTag | Defines the HTML document body tag. You can define a background image, margins, and so on. |
By default, MRTG generates a graph for the current day, as well as averages over the last week, month, and year. You can turn off, or suppress, any of these graphs. For example, if the average over the last year isn't helpful, you can suppress the output of the graph, as shown in the following example:
Suppress[uptime]: y
Generating images files is one of the more expensive operations performed by MRTG. Suppressing one or more images for a target can help reduce the burden of monitoring.
In addition to customizing the HTML output, you can customize the graphs.
To be as portable as possible, and to enable you to view the data in normal web browsers, such as Firefox, Safari, or Internet Explorer, MRTG outputs graphs as image files in PNG format. This is really one of the cleverest features of MRTG. You can view these images in web pages as well as in other applications that can display images.
You can define several configuration options to control how the graph images are made.
The PNGTitle option defines the text to appear immediately above the graph (still within the generated image). You likely don't want a router-based title. Change the title by setting the following option:
PNGTitle[uptime]: System uptime
The YLegend similarly controls the text displayed with the y axis, as shown here:
YLegend[uptime]: Seconds
You want to ensure that you do not define a lot of text for this option, as the text is drawn vertically.
MRTG normally draws a legend at the bottom of the HTML output that shows what the colors on each graph depict. The default text is not appropriate for uptime measurements. You can turn this off by setting the LegendI and LegendO (oh) options to empty text, as shown in the following example:
LegendI[uptime]:
# Legend-"Oh" not zero
LegendO[uptime]:
The Options option provides the most complicated setting. You can define a comma-delimited list of options to set for the graphs for the given target:
Options[uptime]: noinfo, gauge, nopercent, transparent
This example sets the noinfo, gauge, nopercent, and transparent options. The noinfo option suppresses the text near the start of the HTML document that lists the system name and uptime. If you suppress this, you do not have to output the system uptime from your scripts, enabling the MRTG task to use less system resources.
The gauge option tells MRTG that each reading holds the current status of the device or system. For example, when monitoring disk usage, the current reading is the value of disk space used. MRTG should not add this value to previous readings. In other words, the gauge option tells MRTG that this target is not a counter. (Many network routers act as counters.)
The nopercent option tells MRTG not to print usage percentages. Again, when monitoring something other than a network router, you probably want to turn off the percentages.
The transparent option tells MRTG to make the PNG images have a transparent background color. This enables the images to appear better against a variety of background colors.
The following complete example in the Try It Out section enables you to work with MRTG yourself.
You can add blank lines in your configuration file to make the file easier to understand. In addition, as with shell scripts, # indicates a comment.
If you have a typo in your configuration file, you may see output like the following:
$ env LANG=C /usr/bin/mrtg --check mrtg_uptime.cfg
WARNING: "MaxBytes[uptime]" not specified
ERROR: Please fix the error(s) in your config file
If you see this type of output, you need to fix an error in your configuration file.
The basic syntax for running the mrtg command is as follows:
mrtg /full/path/to/config/fileYou may also need to prepend an environment setting, as shown here:
env LANG=C /usr/bin/mrtg /full/path/to/config/fileThe HTML output created by this first example should look something like what is shown in Figure 12-2.
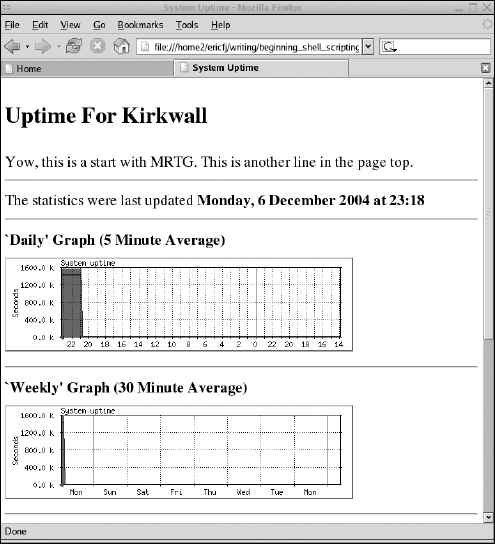
Note that at the beginning, you won't see a lot of data. You have to run mrtg a number of times until it gathers enough data to create meaningful graphs.
Now you should have mrtg ready to run whenever you want. You can then set up cron or some other program to run the mrtg command every five minutes or so. Alternatively, you can run the mrtg command in daemon mode.
cron enables you to run applications or scripts in the background at scheduled intervals. In most cases, you'll want to run MRTG every five minutes.
Note
Don't set up cron to run MRTG until you have fully configured and tested your MRTG setup.
To set up a periodic task with cron, you need to create a crontab file. A crontab file tells cron when to run your task, as well as the command to run. The crontab file defines one task to run periodically per line. Each line has six fields, as shown in the following table.
Field | Holds |
|---|---|
1 | Minutes after the hour |
2 | Hour, in 24-hour format |
3 | Day of the month |
4 | Month |
5 | Day of the week |
6 | Command to run |
The first five fields specify the times to run the command. The last field defines the actual command to run.
Note
Remember to include the full paths in your commands. The pseudo-user running the cron scheduler will probably not have as extensive a path setting as you do.
You can use an asterisk, *, to indicate that the command should be run for every value for that field. That is, run the command for the range of the first possible value of the field to the last. For example, if you place an asterisk for the month field, this tells cron to run your command every month, at the times specified by the other fields. Similarly, an asterisk in the day of the week field tells cron to run your command every day. Most crontab entries, therefore, have several asterisks.
The day of the week starts at 0, for Sunday. Minutes range from 0 to 59, and hours of the day from 0 to 23. You can use ranges, such as 10-15, or a comma-delimited list of times, such as 5,10,15,20.
A special asterisk syntax of fractions enables you to define running a task every two hours, or every five minutes. (The latter time is most useful for MRTG.) Use */2 for the hours field to specify every two hours and */5 in the minutes field to specify every five minutes.
For example, to run the mrtg command every five minutes, you would create a crontab entry like the following:
*/5 * * * * env LANG=C /usr/bin/mrtg /path/to/mrtg_uptime.cfg
See the online documentation on the crontab file format, the crontab command, and the cron scheduler for more information about setting up cron to run mrtg.
Performance is a big consideration when using MRTG. Normally, you'd think that a process that runs every five minutes should not take up too much processing resources. However, if you monitor several systems, MRTG can start to slow your system. Some steps you can take to improve the performance of MRTG include the following:
Reduce the use of
awk. Awkwas designed to create reports, and if you useawkto generate just four lines of data, this tends to be overkill. Often, the smallercutprogram will suffice for generating data for MRTG.Simplify your data-gathering scripts. Every command in your scripts is one more thing that must be run every time MRTG gathers data.
Reduce the number of graphs generated. Do you really need to see the averages over the last year? In many cases, a monthly average is sufficient.
Increase the interval time. Can you run MRTG every ten minutes instead of every five?
Try running the
mrtgcommand in daemon mode instead of runningmrtgwithcron. In this mode, you remove the time required to start the Perl interpreter with eachmrtgrun.Use
rrdtoolto store the MRTG data. Often, users integraterrdtoolalong with generating images only on demand. Normally, MRTG generates images for each target each time MRTG is run. Withrrdtool, however, you can generate images only when a user (typically an administrator) wants to see the data. This avoids a huge amount of work normally done by MRTG. See the MRTG documentation for more information about this.
Now you should be able to set up and run MRTG to graph any sort of data you desire. The following sections show you how to write scripts to monitor your computer, your network, and your applications with MRTG, with a special emphasis on writing MRTG scripts.
Unix and Linux systems support several commands that your scripts can call to monitor aspects of the computer and its resources. In all cases, though, the steps are essentially the same:
You may need to repeat some of the steps as you tweak how your script or MRTG should run.
The following sections show examples for monitoring the memory, CPU, and disk usage on a given system.
Memory usage provides one of the most important measurements for enterprise systems, especially for application servers, which are often bound by memory more than anything else. (Java applications tend to use a lot of memory.)
The first step is to determine a command that reports the needed data. Surprisingly, this can be hard to come by, at least in a convenient format.
The vmstat program reports on the usage of virtual memory. With the -s option, it provides a rather long listing, as shown in the following example:
$ vmstat -s
      1003428  total memory
       994764  used memory
       541292  active memory
       357064  inactive memory
         8664  free memory
       219024  buffer memory
       445344  swap cache
      4096564  total swap
          132  used swap
      4096432  free swap
      7454093 non-nice user cpu ticks
         9889 nice user cpu ticks
       334778 system cpu ticks
     89245397 idle cpu ticks
       187902 IO-wait cpu ticks
       175440 IRQ cpu ticks
            0 softirq cpu ticks
      9668006 pages paged in
     12105535 pages paged out
           14 pages swapped in
           45 pages swapped out
    996496185 interrupts
    167392215 CPU context switches
   1100813430 boot time
       114917 forks
All the values you want are here, but the output covers more than one line, which can prove harder to create a script to monitor.
The command is vm_stat on Mac OS X.
In addition, the vmstat command-line options differ on Solaris, Linux, and other systems. Therefore, you need to determine which options are available on your system and then test the most promising ones to see how the data appears.
Without any options, the vmstat command provides a briefer report:
$ vmstat
procs -----------memory---------- ---swap-- -----io---- --system-- ----cpu----
 r  b   swpd   free   buff  cache   si   so    bi    bo   in    cs us sy id wa
 2  0    132  12056 220112 441864    0    0    10    12    9    40  8  1 92  0
An even better report uses the -a option, to show active memory:
$ vmstat -a
procs -----------memory---------- ---swap-- -----io---- --system-- ----cpu----
 r  b   swpd   free  inact active   si   so    bi    bo   in    cs us sy id wa
 2  0    464  11048 235860 568736    0    0     9    11   15     3  9  0 90  0
You can refine the output to filter out the header information by using the tail command. By default, the tail command prints the last ten lines of a file. With the −1 (one) option, however, you can ask tail to print the last line. Combine tail with vmstat, and you have output that's easier to parse, as shown here:
$ vmstat -a | tail −1
 1  0    464   8880 237840 568908    0    0     9    11   15     3  9  0 90  0
This is the command that the example script uses, but you may want to explore other interesting commands. As before, the commands may not be available on all systems; and the options may differ, too, even where the commands are available.
The free command lists the amount of free memory, as shown in the following example:
$ free
             total       used       free     shared    buffers     cached
Mem:       1003428     994984       8444          0     219072     446128
-/+ buffers/cache:     329784     673644
Swap:      4096564        132    4096432
You can also access the Linux pseudo-file, /proc/meminfo:
$ more meminfo
MemTotal:      1003428 kB
MemFree:         15640 kB
Buffers:        219988 kB
Cached:         439816 kB
There are many more lines of output. The first two lines, though, are enough to track memory usage. As you can see, a wealth of information is available.
Using the vmstat -a command, you can create an MRTG monitoring script, as shown in the following example. You can actually create a monitoring script from any of these commands.
After you have created the script to monitor memory usage, you need to configure MRTG to run your script, as well as define the output options for the graph. The following Try It Out example shows how to set this up.
Try It Out: Configuring MRTG to Monitor Memory Usage
You can define an MRTG configuration for this target as follows:
# Memory usage.
Target[kirkwall.memory.usage]: `/usr/local/bin/mem2mrtg`
MaxBytes[kirkwall.memory.usage]: 10001010

# HTML output settings.
Title[kirkwall.memory.usage]: Kirkwall Memory Usage
PageTop[kirkwall.memory.usage]: <H2>Memory Usage For Kirkwall</H2>

Suppress[kirkwall.memory.usage]: ym

# Graph output settings.
Options[kirkwall.memory.usage]: gauge, nopercent, transparent, growright

PNGTitle[kirkwall.memory.usage]: kirkwall vm

YLegend[kirkwall.memory.usage]: Memory
ShortLegend[kirkwall.memory.usage]:b
kMG[kirkwall.memory.usage]: k,m
Legend1[kirkwall.memory.usage]: Active Memory
Legend2[kirkwall.memory.usage]: Free Memory
Legend3[kirkwall.memory.usage]: Max Active Memory
Legend4[kirkwall.memory.usage]: Max Free Memory
LegendI[kirkwall.memory.usage]:  Active:
LegendO[kirkwall.memory.usage]:  Free:
Note that this example holds just the part of the MRTG configuration file that works with the memory target. Place this example into your MRTG configuration file. You may want to change the target name, shown here as kirkwall.memory.usage.
How It Works
This configuration example defines an MRTG target named kirkwall.memory.usage (for a system with a hostname of kirkwall). The target tells MRTG to run the mem2mrtg script, located in /usr/local/bin.
Remember to copy the script to the proper directory location.
The Options setting introduces the growright option, which tells MRTG to generate a graph going to the right, instead of to the left. This changes where the history appears on the graph.
The ShortLegend defines the units, here listed as b for bytes. The oddly named kMG setting sets the prefix to m, short for mega, as in megabytes, and k, short for kilo.
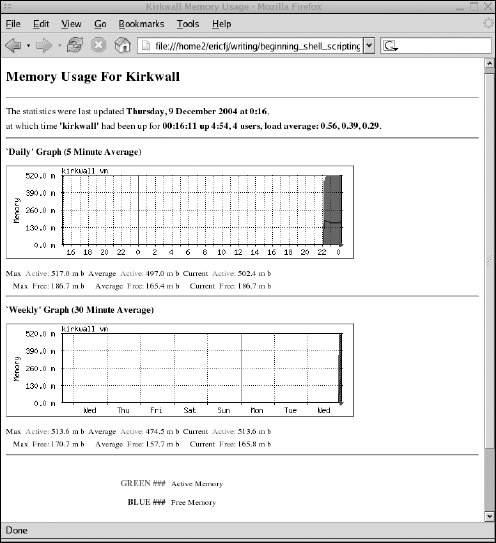
The best way to get the hang of these types of settings is to play around with different values, run mrtg, and see what results you get. The MRTG documentation describes each option, but the effect of changes is not readily apparent until you can see the resulting HTML page and graphs. In addition, remember that you won't have much of a graph until about 20 minutes have elapsed.
The legend settings define the graph's legend and are shown here for an example from which to work.
When you use this configuration, you'll see output similar to that in Figure 12-3.
The up2mrtg script, shown previously, provides an example for monitoring CPU usage. This script, however, works on Linux only, as the /proc file system is available only on Linux. A more general approach can be achieved with the uptime command, which includes a system load average, along with the number of active users.
The number of active users is often wrong. A single user may appear to the system to be many users when the user is running a graphical desktop.
The basic format provided by the uptime command follows:
$ uptime
 22:07:29 up 11 days,  6:36,  5 users,  load average: 0.03, 0.15, 0.27
Two useful values from this output include the number of users and the load average. The uptime command outputs the load average for the last minute, the last 5 minutes, and the last 15 minutes. Because MRTG already averages, the best value to use is the number from the last minute.
Note how this follows the first step listed previously. You need to first try the command or commands you think will provide the necessary data.
Try It Out: Configuring MRTG to Monitor CPU Usage
Enter the following configuration to your MRTG configuration file:
Target[kirkwall.cpu.load]: `/usr/local/bin/load2mrtg`
MaxBytes[kirkwall.cpu.load]: 10001010

# HTML output settings.
Title[kirkwall.cpu.load]: Kirkwall CPU Load
PageTop[kirkwall.cpu.load]: <H2>CPU Load For Kirkwall</H2>

Suppress[kirkwall.cpu.load]: ym


# Graph output settings.
Options[kirkwall.cpu.load]: gauge, nopercent, transparent, growright

PNGTitle[kirkwall.cpu.load]: kirkwall CPU

YLegend[kirkwall.cpu.load]: Load avg.
ShortLegend[kirkwall.cpu.load]: avg.
Legend1[kirkwall.cpu.load]: Average CPU load
Legend2[kirkwall.cpu.load]: Number of users
Legend3[kirkwall.cpu.load]: Max CPU load
Legend4[kirkwall.cpu.load]: Max users
LegendI[kirkwall.cpu.load]:  Load:
LegendO[kirkwall.cpu.load]:  Users:
How It Works
This configuration example defines an MRTG target named kirkwall.cpu.load (again for a system with a hostname of kirkwall). The target tells MRTG to run the load2mrtg script, located in /usr/local/bin. You need to add this example to your MRTG configuration file.
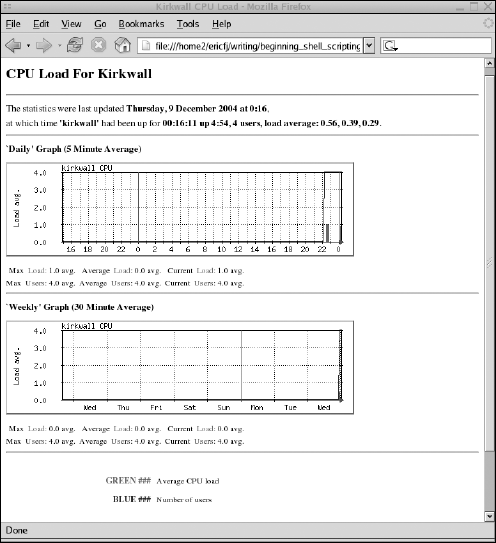
The options are the same as for the previous configuration. When you use this configuration, you'll see output similar to what is shown in Figure 12-4.
The df command, short for disk free, displays the amount of free disk space, along with used and total space. Without any command-line arguments or options, df generates output on all mounted file systems, as shown in the following example:
$ df
Filesystem           1K-blocks      Used Available Use% Mounted on
/dev/hda2             24193540   3908604  19055964  18% /
/dev/hda1               101086      8384     87483   9% /boot
none                    501712         0    501712   0% /dev/shm
/dev/hda5             48592392  24888852  21235156  54% /home2
/dev/sda1               499968    373056    126912  75% /media/CRUZER
Due to boneheaded defaults on Unix, you should pass the -k option to the df command. The -k option tells the df command to output values in kilobytes, rather than 512-byte blocks (or half-kilobytes). On Linux, as shown in this example, the default output of df is in kilobytes. However, for many Unix systems this is not true, so you should always pass the -k option to df.
HP-UX was historically particularly annoying in this regard.
If you pass a file system, or its mount point, the df command will output data for only that file system, as shown in the following example:
$ df -k /media/CRUZER/
Filesystem           1K-blocks      Used Available Use% Mounted on
/dev/sda1               499968    373056    126912  75% /media/CRUZER
This example shows the disk usage of a 512 MB USB flash, or thumb, drive on a Linux system.
With this example, you can see that you're close to extracting the data to be monitored. If you pipe the output of the df command to the tail command, as shown in the mem2mrtg script, then you will eliminate the clutter and have one line of output, as shown in this example:
$ df -k /media/CRUZER/ | tail −1
/dev/sda1               499968    373056    126912  75% /media/CRUZER
With this, you should have enough information to create a script.
Once you've established a means to monitor a system, you can expand it to monitor other systems. The next step is to monitor the connections, especially network connections, between systems.
Probably the simplest command to start with is ping. Named after the echoing sound made by old submarine radar systems, ping sends out network packets to a remote host. On the remote side, the host should send those same packets back. The ping command then times the response or times out if there is a network problem.
Here is an example:
$ ping -c 1 stromness
PING stromness (127.0.0.1) 56(84) bytes of data.
64 bytes from stromness (127.0.0.1): icmp_seq=0 ttl=64 time=0.089 ms

--- stromness ping statistics ---
1 packets transmitted, 1 received, 0% packet loss, time 0ms
rtt min/avg/max/mdev = 0.089/0.089/0.089/0.000 ms, pipe 2
By default, the ping command runs forever. You normally need to use Ctrl-C to stop, or kill, the ping command. The -c 1 (one) option shown here tells ping to send out one block of data and then stop. You'll need to use options like this if you use ping in a script.
Unfortunately, ping suffers from two main problems:
Most firewalls block
pingrequests.Some network hardware responds to
pingrequests on its own. This means you can get a false positive result fromping, wherebypingthinks the connection is working, but the remote computer may have crashed.
Another handy command is netstat, short for network status. With the -i option, netstat returns information about all of the available network interfaces, as shown here:
$ netstat -i
Kernel Interface table
Iface    MTU Met    RX-OK RX-ERR RX-DRP RX-OVR    TX-OK TX-ERR TX-DRP TX-OVR Flg
eth0    1500   0  1564596      0      0      0   865349    664      0      0 BMRU
lo      6436   0     5800      0      0      0     5800      0      0      0 LRU
In this example, the eth0 interface is the normal Ethernet port. The lo interface is the software-only loopback interface. To filter for a particular interface, you can pipe the output of the netstat command to the grep command, as shown in the following example:
$ netstat -i | grep eth0
eth0     1500   0    65798     0     0      0    47099     28     0     0 BMRU
On a Mac OS X system, the typical name for the first (and usually only) Ethernet interface is en0. On Linux, the default name is eth0.
Also on Mac OS X, the netstat command returns more than one line per network interface. Because of this, you can pipe the results to the tail −1 (one) command, as shown in the following:
$ netstat -i | grep eth0 | tail −1
eth0     1500   0    65798     0     0      0    47099     28     0     0 BMRU
The netstat command outputs several values for each network interface. The normal values to check are the count of packets sent and received okay—TX-OK and RX-OK in the example shown previously.
Armed with the netstat command, you can create a shell script to check a network interface that can be called by MRTG, as shown in the following example.
To graph data from routers, servers, and other systems, see
http://people.ee.ethz.ch/∼oetiker/webtools/mrtg/links.html.
Up to now, you've only examined how to monitor your system-level computing infrastructure. Taking this up one level, you may need to monitor several applications.
One of the most commonly used applications, especially on Unix and Unix-like systems, is some form of web server. Many systems run the Apache web server, but it really shouldn't matter. Because web servers support a known and very simple network protocol, you can attempt to monitor a web server from any system on the network.
There are some things you cannot monitor remotely, of course, but this example focuses on the techniques needed to monitor applications remotely.
When you monitor a remote application, you may want to time how long it takes to get the data, perform some known operation and verify that you got the expected amount of data, or both. You may additionally try to verify the content of the data, but that's going far beyond the purpose for which MRTG was designed.
To test a web server, one of the commands you would likely try is the wget command, a command-line program that downloads web pages.
A good web page to download is the root document, as this should be available on just about every web server. For example, to download the root document from a book publisher's site, try a command like the following:
$ wget http://www.wiley.com/
--23:26:57--  http://www.wiley.com/
           => `index.html'
Resolving www.wiley.com...  xxx.xxx.xxx.xxx
Connecting to www.wiley.com[xxx.xxx.xxx.xxx]:80... connected.
HTTP request sent, awaiting response... 301
Location: /WileyCDA/ [following]
--23:26:57--  http://www.wiley.com/WileyCDA/
           => `index.html'
Connecting to www.wiley.com[xxx.xxx.xxx.xxx]:80... connected.
HTTP request sent, awaiting response... 200 OK
Length: unspecified [text/html]

    [  <=>                                ] 42,840       141.31K/s

23:26:58 (140.88 KB/s) - `index.html' saved [42,840]
In this example (which has the network IP address blocked out), you can see that the wget command downloaded index.html, and the file downloaded is 42,840 bytes. The file is important, as wget actually saves the file to disk. Any script for MRTG should then delete the file when done. In addition, the number of bytes has an annoying comma, which you'll want to filter out.
Furthermore, there are too many lines of output. Luckily, wget helps reduce the output. The -nv command-line option, short for not verbose, reduces the output (and the -q, or quiet, option eliminates the output). For example:
$ wget -nv http://www.wiley.com/
23:32:14 URL:http://www.wiley.com/WileyCDA/ [42,840] -> "index.html.2" [1]
Now you can see one line of output. But notice how wget creates a new file, index.html.2, to avoid overwriting the first file. Any command that will be called repeatedly, as MRTG will do with your scripts, should not fill up the system's hard disk. Therefore, you need some way to change the output options.
The -O (oh) option tells wget to output to a given file instead of outputting to names that match the remote file names. A special file name, -, tells wget to send the output to stdout. You can then cheat and redirect stdout to /dev/null, to throw away the output, as shown in the following example:
$ wget -nv -O - http://www.wiley.com/ > /dev/null
23:37:16 URL:http://www.wiley.com/WileyCDA/ [42,840] -> "-" [1]
Notice that the wget summary output remains. You can see why with the following command:
$ wget -nv -O - http://www.wiley.com/ > /dev/null 2> /dev/null
$
The summary output is sent to stderr, not stdout.
The next step is to filter out the number of bytes from the summary output. You can use the cut command for this.
For reference, the following example shows a full MRTG configuration file, named mrtg_sys.cfg:
HtmlDir: /var/www/mrtg ImageDir: /var/www/mrtg LogDir: /var/lib/mrtg ThreshDir: /var/lib/mrtg Target[kirkwall.net.eth0]: `/usr/local/bin/net2mrtg eth0` MaxBytes[kirkwall.net.eth0]: 10001010 # HTML output settings. Title[kirkwall.net.eth0]: Net Stats for eth0 PageTop[kirkwall.net.eth0]: <h2>Net Stats for eth0</h2> Suppress[kirkwall.net.eth0]: y # Graph output settings. Options[kirkwall.net.eth0]: gauge, nopercent, transparent, growright PNGTitle[kirkwall.net.eth0]: Net Throughput YLegend[kirkwall.net.eth0]: Packets Target[kirkwall.disk.slash]: `/usr/local/bin/df2mrtg /` MaxBytes[kirkwall.disk.slash]: 10001010 # HTML output settings. Title[kirkwall.disk.slash]: / Disk Usage PageTop[kirkwall.disk.slash]: <h2>Disk usage for /</h2> Suppress[kirkwall.disk.slash]: ym Options[kirkwall.disk.slash]: gauge, nopercent, transparent, growright PNGTitle[kirkwall.disk.slash]: Disk usage YLegend[kirkwall.disk.slash]: Kilobytes ShortLegend[kirkwall.disk.slash]: b Legend1[kirkwall.disk.slash]: Used space Legend2[kirkwall.disk.slash]: Available space Legend3[kirkwall.disk.slash]: Max Used Legend4[kirkwall.disk.slash]: Max Available LegendI[kirkwall.disk.slash]: Used: LegendO[kirkwall.disk.slash]: Available: # Monitor another file system. Target[kirkwall.disk.home]: `/usr/local/bin/df2mrtg /home2` MaxBytes[kirkwall.disk.home]: 10001010 # HTML output settings. Title[kirkwall.disk.home]: /home2 Disk Usage PageTop[kirkwall.disk.home]: <h2>Disk usage for /home2</h2> Suppress[kirkwall.disk.home]: ym # Graph output settings.
Options[kirkwall.disk.home]: gauge, nopercent, transparent, growright PNGTitle[kirkwall.disk.home]: Disk usage YLegend[kirkwall.disk.home]: Kilobytes ShortLegend[kirkwall.disk.home]: b Legend1[kirkwall.disk.home]: Used space Legend2[kirkwall.disk.home]: Available space Legend3[kirkwall.disk.home]: Max Used Legend4[kirkwall.disk.home]: Max Available LegendI[kirkwall.disk.home]: Used: LegendO[kirkwall.disk.home]: Available: Target[kirkwall.cpu.load]: `/usr/local/bin/load2mrtg` MaxBytes[kirkwall.cpu.load]: 10001010 # HTML output settings. Title[kirkwall.cpu.load]: Kirkwall CPU Load PageTop[kirkwall.cpu.load]: <H2>CPU Load For Kirkwall</H2> Suppress[kirkwall.cpu.load]: ym # Graph output settings. Options[kirkwall.cpu.load]: gauge, nopercent, transparent, growright PNGTitle[kirkwall.cpu.load]: kirkwall CPU YLegend[kirkwall.cpu.load]: Load avg. ShortLegend[kirkwall.cpu.load]: avg. Legend1[kirkwall.cpu.load]: Average CPU load Legend2[kirkwall.cpu.load]: Number of users Legend3[kirkwall.cpu.load]: Max CPU load Legend4[kirkwall.cpu.load]: Max users LegendI[kirkwall.cpu.load]: Load: LegendO[kirkwall.cpu.load]: Users: # Memory usage. Target[kirkwall.memory.usage]: `/usr/local/bin/mem2mrtg` MaxBytes[kirkwall.memory.usage]: 10001010 # HTML output settings. Title[kirkwall.memory.usage]: Kirkwall Memory Usage PageTop[kirkwall.memory.usage]: <H2>Memory Usage For Kirkwall</H2> Suppress[kirkwall.memory.usage]: ym # Graph output settings.
Options[kirkwall.memory.usage]: gauge, nopercent, transparent, growright
PNGTitle[kirkwall.memory.usage]: kirkwall vm
YLegend[kirkwall.memory.usage]: Memory
ShortLegend[kirkwall.memory.usage]:b
kMG[kirkwall.memory.usage]: k,m
Legend1[kirkwall.memory.usage]: Active Memory
Legend2[kirkwall.memory.usage]: Free Memory
Legend3[kirkwall.memory.usage]: Max Active Memory
Legend4[kirkwall.memory.usage]: Max Free Memory
LegendI[kirkwall.memory.usage]: Active:
LegendO[kirkwall.memory.usage]: Free:
# Application monitoring.
Target[web.download.bytes]: `/usr/local/bin/web2mrtg http://www.wiley.com/`
MaxBytes[web.download.bytes]: 10001010
# HTML output settings.
Title[web.download.bytes]: Web Page Download
PageTop[web.download.bytes]: <H2>Web Page Download</H2>
Dips in the graph indicate problems.
Suppress[web.download.bytes]: ym
# Graph output settings.
Options[web.download.bytes]: gauge, nopercent, transparent, growright, noo
PNGTitle[web.download.bytes]: Web
YLegend[web.download.bytes]: Bytes
ShortLegend[web.download.bytes]:b
Legend1[web.download.bytes]: Downloaded
Legend3[web.download.bytes]: Max Downloaded Memory
LegendI[web.download.bytes]: Downloaded:Yow. MRTG configurations can grow large, and this example monitors only a few items.
You can do a lot more with MRTG. If you have any data available via SNMP, consult the MRTG documentation for information on how to configure MRTG to monitor data via SNMP. In addition, look for the webalizer command to find a utility similar to MRTG but designed to work with web server log files.
One drawback to MRTG, however, is that you need to reconfigure MRTG each time you change a router or system.
MRTG provides a handy tool for monitoring anything on your system, which is why this tool has stood the test of time and been adopted in major corporations. You can write scripts to monitor disk and memory usage, network throughput, and so on.
This chapter doesn't cover every MRTG option. For more details, refer to the MRTG documentation. Instead, this chapter has focused on how to get started with MRTG. Armed with these techniques, you should be able to configure MRTG to suit your needs.
MRTG enables you to do all of the following:
Generate graphs that show the values output by your scripts over time.
View detailed information for the current day.
View summary information for the last week, month, and year.
Monitor systems without filling your hard disk. The fact that MRTG uses a fixed amount of disk space really helps.
The next chapter extends the discussion to using shell scripts to help administer your systems.
What are some types of things that you could monitor the same way, whether you were working on Windows, Mac OS X, Unix, or Linux?
How would you go about graphing data on a database such as Oracle, Postgres, SQL Server, or DB2?
Look up some other monitoring packages, such as mon or Big Brother. (Both are available free on the Internet.) You can also try commercial packages such as HP OpenView and CA Unicenter.