
CHAPTER 2
DATA MODELING
Before reaching database management, there is an important preliminary to cover. In order ultimately to design databases to support an organization, we must have a clear understanding of how the organization is structured and how it functions. We have to understand its components, what they do and how they relate to each other. The bottom line is that we have devise a way of recording, of diagramming, the business environment. This is the essence of data modeling.
OBJECTIVES
- Explain the concept and practical use of data modeling.
- Recognize which relationships in the business environment are unary, binary, and ternary relationships.
- Describe one-to-one, one-to-many, and many-to-many unary, binary, and ternary relationships.
- Recognize and describe intersection data.
- Model data in business environments by drawing entity-relationship diagrams that involve unary, binary, and ternary relationships.
CHAPTER OUTLINE
Introduction
Binary Relationships
- What is a Binary Relationship?
- Cardinality
- Modality
- More About Many-to-Many Relationships
Unary Relationships
- One-to-One Unary Relationship
- One-to-Many Unary Relationship
- Many-to-Many Unary Relationship
Ternary Relationships
Example: The General Hardware Company
Example: Good Reading Book Stores
Example: World Music Association
Example: Lucky Rent-A-Car
Summary
INTRODUCTION
The diagramming technique we will use is called the entity-relationship or E-R Model. It is well named, as it diagrams entities (together with their attributes) and the relationships among them. Actually, there are many variations of E-R diagrams and drawing them is as much an art as a science. We will use the E-R diagramming technique provided by Microsoft Visio with the “crow's foot” variation.
To begin, an entity is an object or event in our environment that we want to keep track of. A person is an entity. So is a building, a piece of inventory sitting on a shelf, a finished product ready for sale, and a sales meeting (an event). An attribute is a property or characteristic of an entity. Examples of attributes include an employee's employee number, the weight of an automobile, a company's address, or the date of a sales meeting. Figure 2.1, with its rectangular shape, represents a type of entity. The name of the entity type (SALESPERSON) is set in caps at the top of the box. The entity type's attributes are shown below it. The attribute label PK and the boldface type denote the one or more attributes that constitute the entity type's unique identifier. Visio uses the abbreviation PK to stand for “primary key,” which is a concept we define later in this book. For now, just consider these attributes as the entity type's unique identifier.
Entities in the real world never really stand alone. They are typically associated with one another. Parents are associated with their children, automobile parts are associated with the finished automobile in which they are installed, firefighters are associated with the fire engines to which they are assigned, and so forth. Recognizing and recording the associations among entities provides a far richer description of an environment than recording the entities alone. In order to deal intelligently and usefully with the associations or relationships among entities, we have to recognize that there are several different kinds of relationships and several different aspects of describing them. The most basic way of categorizing a relationship is by the number of entity types involved.
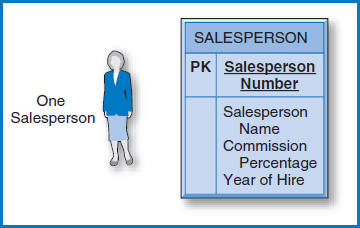
FIGURE 2.1 An E-R model entity and its attributes
BINARY RELATIONSHIPS
What is a Binary Relationship?
The simplest kind of relationship is known as a binary relationship. A binary relationship is a relationship between two entity types. Figure 2.2 shows a small E-R diagram with a binary relationship between two entity types, salespersons and products. The E-R diagram in Figure 2.2 tells us that a salesperson “sells” products. Conversely, products are “sold by” salespersons. That's good information, but we can do better than that at the price of a very small increase in effort. Just knowing that a salesperson sells products leaves open several obvious and important questions. Is a particular salesperson allowed to sell only one kind of product, or two, or three, or all of the available products? Can a particular product be sold by only a single salesperson or by all salespersons? Might we want to keep track of a new salesperson who has just joined the company but has not yet been assigned to sell any products (assuming that there is indeed a restriction on which salespersons can sell which products)?
CONCEPTS IN ACTION
2-A THE WALT DISNEY COMPANY
The Walt Disney Company is world-famous for its many entertainment ventures but it is especially identified with its theme parks. First there was Disneyland in Los Angeles, then the mammoth Walt Disney World in Orlando. These were followed by parks in Paris and Tokyo, and one now under development in Hong Kong. The Disney theme parks are so well run that they create a wonderful feeling of natural harmony with everyone and everything being in the right place at the right time. When you're there, it's too much fun to stop to think about how all this is organized and carried off with such precision. But, is it any wonder to learn that databases play a major part?
One of the Disney theme parks' interesting database applications keeps track of all of the costumes worn by the workers or “cast members” in the parks. The system is called the Garment Utilization System or GUS (which was also the name of one of the mice that helped Cinderella sew her dress!). Managing these costumes is no small task. Virtually all of the cast members, from the actors and dancers to the ride operators, wear some kind of costume. Disneyland in Los Angeles has 684,000 costume parts (each costume is typically made up of several garments), each of which is uniquely bar-coded, for its 46,000 cast members. The numbers in Orlando are three million garments and 90,000 cast members. Using bar-code scanning, GUS tracks the life cycle of every garment. This includes the points in time when a garment is in the storage facility, is checked out to a cast member, is in the laundry, or is being repaired (in house or at a vendor). In addition to managing the day-to-day movements of the costumes, the system also provides a rich data analysis capability. The industrial engineers in Disney's business planning group use the accumulated data to decide how many garments to keep in stock and how many people to have staffing the garment checkout windows based on the expected wait times. They also use the data to determine whether certain fabrics or the garments made by specific manufacturers are not holding up well through a reasonable number of uses or of launderings.
“Photo Courtesy of the Walt Disney Company”
GUS, which was inaugurated at Disneyland in Los Angeles in 1998 and then again at Walt Disney World in Orlando in 2002, replaced a manual system in which the costume data was written on index cards. It is implemented in Microsoft's SQL Server DBMS and runs on a Compaq server. It is also linked to an SAP personnel database to help maintain the status of the cast members. If GUS is ever down, the process shifts to a Palm Pilot-based backup system that can later update the database. In order to keep track of the costume parts and cast members, not surprisingly, there is a relational table for costume parts with one record for each garment and there is a table for cast members with one record for each cast member. The costume parts records include the type of garment, its size, color, and even such details as whether its use is restricted to a particular cast member and whether it requires a special laundry detergent. Correspondingly, the cast member records include the person's clothing sizes and other specific garment requirements.
Ultimately, GUS's database precision serves several purposes in addition to its fundamental managerial value. The Walt Disney Company feels that consistency in how its visitors or “guests” look at a given ride gives them an important comfort level. Clearly, GUS provides that consistency in the costuming aspect. In addition, GUS takes the worry out of an important part of each cast member's workday. One of Disney's creeds is to strive to take good care of its cast members so that they will take good care of Disney's guests. Database management is a crucial tool in making this work so well.
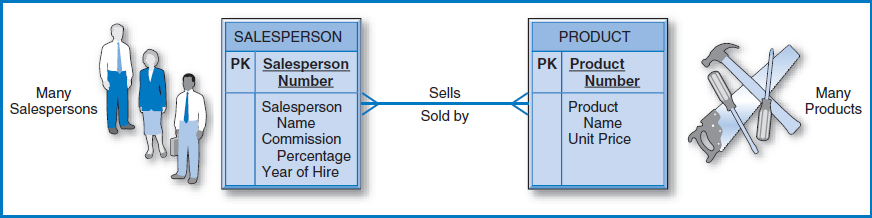
FIGURE 2.2 A binary relationship
Cardinality
One-to-One Binary Relationship Figure 2.3 shows three binary relationships of different cardinalities, representing the maximum number of entities that can be involved in a particular relationship. Figure 2.3a shows a one-to-one (1-1) binary relationship, which means that a single occurrence of one entity type can be associated with a single occurrence of the other entity type and vice versa. A particular salesperson is assigned to one office. Conversely, a particular office (in this case they are all private offices!) has just one salesperson assigned to it. Note the “bar” or “one” symbol on either end of the relationship in the diagram indicating the maximum one cardinality. The way to read these diagrams is to start at one entity, read the relationship on the connecting line, pick up the cardinality on the other side of the line near the second entity, and then finally reach the other entity. Thus, Figure 2.3a, reading from left to right, says, “A salesperson works in one (really at most one, since it is a maximum) office.” The bar or one symbol involved in this statement is the one just to the left of the office entity box. Conversely, reading from right to left, “An office is occupied by one salesperson.”
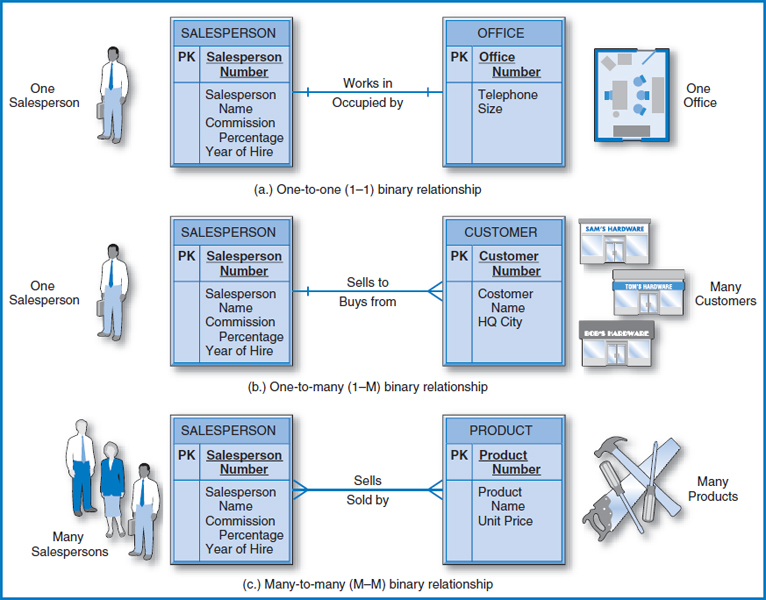
FIGURE 2.3 Binary relationships with cardinalities
One-to-Many Binary Relationship Associations can also be multiple in nature. Figure 2.3b shows a one-to-many (1-M) binary relationship between salespersons and customers. The “crowy's foot” device attached to the customer entity box represents the multiple association. Reading from left to right, the diagram indicates that a salesperson sells to many customers. (Note that “many,” as the maximum number of occurrences that can be involved, means a number that can be 1, 2, 3, …n. It also means that the number is not restricted to being exactly one, which would require the “one” or “bar” symbol instead of the crow's foot.) Reading from right to left, Figure 2.3b says that a customer buys from only one salesperson. This is reasonable, indicating that in this company each salesperson has an exclusive territory and thus each customer can be sold to by only one salesperson from the company.
Many-to-Many Binary Relationship Figure 2.3c shows a many-to-many (M-M) binary relationship among salespersons and products. A salesperson is authorized to sell many products; a product can be sold by many salespersons. By the way, in some circumstances, in either the 1-M or M-M case, “many” can be either an exact number or have a known maximum value. For example, a company rule may set a limit of a maximum of ten customers in a sales territory. Then the “many” in the 1-M relationship of Figure 2.3b can never be more than 10 (a salesperson can have many customers but not more than 10). Sometimes people include this exact number or maximum next to or even instead of the crow's foot in the E-R diagram.
Modality
Figure 2.4 shows the addition of the modality, the minimum number of entity occurrences that can be involved in a relationship. In our particular salesperson environment, every salesperson must be assigned to an office. On the other hand, a given office might be empty or it might be in use by exactly one salesperson. This situation is recorded in Figure 2.4a, where the “inner” symbol, which can be a zero or a one, represents the modality—the minimum—and the “outer” symbol, which can be a one or a crow's foot, represents the cardinality—the maximum. Reading Figure 2.4a from left to right tells us that a salesperson works in a minimum of one and a maximum of one office, which is another way of saying exactly one office. Reading from right to left, an office may be occupied by or assigned to a minimum of no salespersons (i.e. the office is empty) or a maximum of one salesperson.
Similarly, Figure 2.4b indicates that a salesperson may have no customers or many customers. How could a salesperson have no customers? (What are we paying her for?!?) Actually, this allows for the case in which we have just hired a new salesperson and have not as yet assigned her a territory or any customers. On the other hand, a customer is always assigned to exactly one salesperson. We never want customers to be without a salesperson—how would they buy anything from us when they need to? We never want to be in a position of losing sales! If a salesperson leaves the company, the company's procedures require that another salesperson or, temporarily, a sales manager be immediately assigned the departing salesperson's customers. Figure 2.4c says that each salesperson is authorized to sell at least one or many of our products and each product can be sold by at least one or many of our salespersons. This includes the extreme, but not surprising, case in which each salesperson is authorized to sell all the products and each product can be sold by all the salespersons.
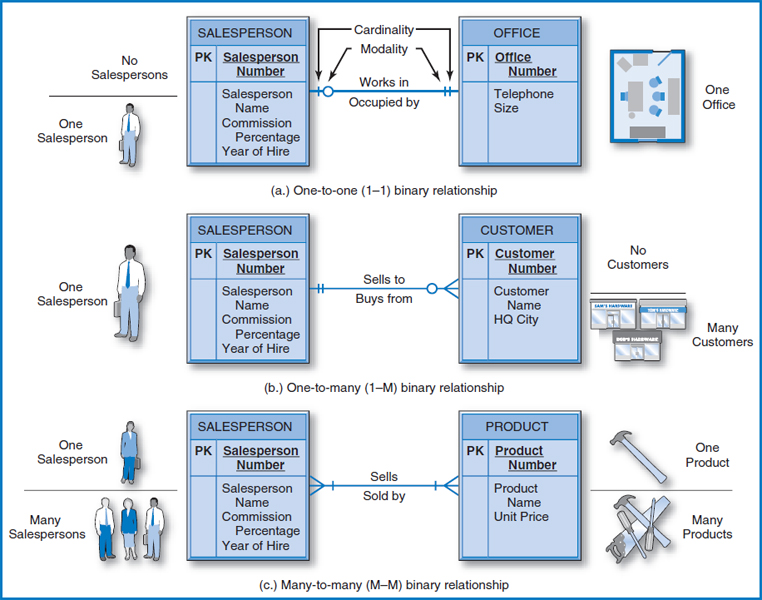
FIGURE 2.4 Binary relationships with cardinalities (maximums) and modalities (minimums)
More About Many-to-Many Relationships
Intersection Data Generally, we think of attributes as facts about entities. Each salesperson has a salesperson number, a name, a commission percentage, and a year of hire. At the entity occurrence level, for example, one of the salespersons has salesperson number 528, the name Jane Adams, a commission percentage of 15 %, and the year of hire of 2003. In an E-R diagram, these attributes are written or drawn together with the entity, as in Figure 2.1 and the succeeding figures. This certainly appears to be very natural and obvious. Are there ever any circumstances in which an attribute can describe something other than an entity?
Consider the many-to-many relationship between salespersons and products in Figure 2.4c. As usual, salespersons are described by their salesperson number, name, commission percentage, and year of hire. Products are described by their product number, name, and unit price. But, what if there is a requirement to keep track of the number of units (call it “quantity”) of a particular product that a particular salesperson has sold? Can we add the quantity attribute to the product entity box? No, because for a particular product, while there is a single product number, product name, and unit price, there would be lots of “quantities,” one for each salesperson selling the product. Can we add the quantity attribute to the salesperson entity box? No, because for a particular salesperson, while there is a single salesperson number, salesperson name, commission percentage, and year of hire, there will be lots of “quantities,” one for each product that the salesperson sells. It makes no sense to try to put the quantity attribute in either the salesperson entity box or the product entity box. While each salesperson has a single salesperson number, name, commission percentage, and year of hire, each salesperson has many “quantities,” one for each product he sells. Similarly, while each product has a single product number, product name, and unit price, each product has many “quantities,” one for each salesperson who sells that product. But an entity box in an E-R diagram is designed to list the attributes that simply and directly describe the entity, with no complications involving other entities. Putting quantity in either the salesperson entity box or the product entity box just will not work.
The quantity attribute doesn't describe either the salesperson alone or the product alone. It describes the combination of a particular salesperson and a particular product. In general, we can say that it describes the combination of a particular occurrence of one entity type and a particular occurrence of the other entity type. Let's say that since salesperson number 137 joined the company, she has sold 170 units of product number 24 013. The quantity 170 doesn't make sense as a description or characteristic of salesperson number 137 alone. She has sold many different kinds of products. To which one does the quantity 170 refer? Similarly, the quantity 170 doesn't make sense as a description or characteristic of product number 24 013 alone. It has been sold by many different salespersons.
In fact, the quantity 170 falls at the intersection of salesperson number 137 and product number 24013. It describes the combination of or the association between that particular salesperson and that particular product and it is known as intersection data. Figure 2.5 shows the many-to-many relationship between salespersons and products with the intersection data, quantity, represented in a separate box attached to the relationship line. That is the natural place to draw it. Pictorially, it looks as if it is at the intersection between the two entities, but there is more to it than that. The intersection data describes the relationship between the two entities. We know that an occurrence of the Sells relationship specifies that salesperson 137 has sold some of product 24013. The quantity 170 is an attribute of this occurrence of that relationship, further describing this occurrence of the relationship. Not only do we know that salesperson 137 sold some of product 24013 but we know how many units of that product that salesperson sold.
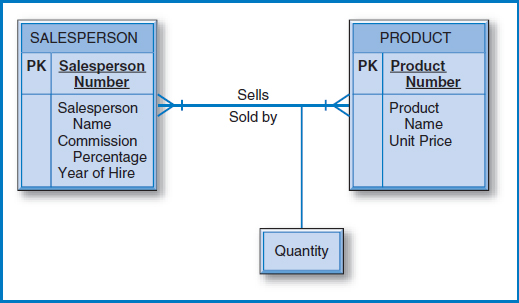
FIGURE 2.5 Many-to-many binary relationship with intersection data
Associative Entity Since we know that entities can have attributes and now we see that many-to-many relationships can have attributes, too, does that mean that entities and many-to-many relationships can in some sense be treated in the same way within E-R diagrams? Indeed they can! Figure 2.6 shows the many-to-many relationship Sells converted into the associative entity SALES. An occurrence of the SALES associative entity does exactly what the many-to-many relationship did: it indicates a relationship between a salesperson and a product, specifically the fact that a particular salesperson has been involved in selling a particular product, and includes any intersection data that describes this relationship. Note very, very carefully the reversal of the cardinalities and modalities when the many-to-many relationship is converted to an associative entity. SALES is now a kind of entity in its own right. Again, a single occurrence of the new SALES entity type records the fact that a particular salesperson has been involved in selling a particular product. A single occurrence of SALES relates to a single occurrence of SALESPERSON and to a single occurrence of PRODUCT, which is why the diagram indicates that a sales occurrence involves exactly one salesperson and exactly one product. On the other hand, since a salesperson sells many products, the diagram shows that a salesperson will tie into many sales occurrences. Similarly, since a product is sold by many salespersons, the diagram shows that a product will tie into many sales occurrences.
If the many-to-many relationship E-R diagram style of Figure 2.5 is equivalent to the associative entity style of Figure 2.6, which one should you use? This is an instance in which this type of diagramming is an art with a lot of leeway for personal taste. However, you should be aware that over time the preference has shifted towards the associative entity style of Figure 2.6, and that is what we will use from here on in this book.
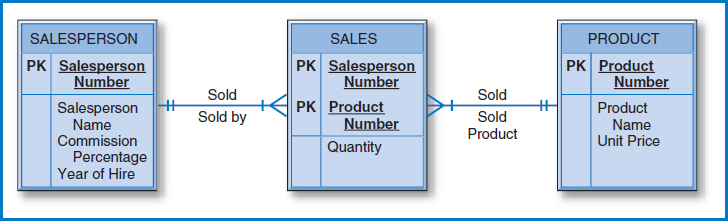
FIGURE 2.6 Associative entity with intersection data
The Unique Identifier in Many-to-Many Relationships Since, as we have just seen, a many-to-many relationship can appear to be a kind of an entity, complete with attributes, it also follows that it should have a unique identifier, like other entities. (If this seems a little strange or even unnecessary here, it will become essential later in the book when we actually design databases based on these E-R diagrams.) In its most basic form, the unique identifier of the many-to-many relationship or the associative entity is the combination of the unique identifiers of the two entities in the many-to-many relationship. So, the unique identifier of the many-to-many relationship of Figure 2.5 or, as shown in Figure 2.6, of the associative entity, is the combination of the Salesperson Number and Product Number attributes.
Sometimes, an additional attribute or attributes must be added to this combination to produce uniqueness. This often involves a time element. As currently constructed, the E-R diagram in Figure 2.6 indicates the quantity of a particular product sold by a particular salesperson since the salesperson joined the company. Thus, there can be only one occurrence of SALES combining a particular salesperson with a particular product. But if, for example, we wanted to keep track of the sales on an annual basis, we would have to include a year attribute and the unique identifier would be Salesperson Number, Product Number, and Year. Clearly, if we want to know how many units of each product were sold by each salesperson each year, the combination of Salesperson Number and Product Number would not be unique because for a particular salesperson and a particular product, the combination of those two values would be the same each year! Year must be added to produce uniqueness, not to mention to make it clear in which year a particular value of the Quantity attribute applies to a particular salesperson-product combination.
The third and last possibility occurs when the nature of the associative entity is such that it has its own unique identifier. For example, a company might specify a unique serial number for each sales record. Another example would be the many-to-many relationship between motorists and police officers who give traffic tickets for moving violations. (Hopefully it's not too many for each motorist!) The unique identifier could be the combination of police officer number and motorist driver's license number plus perhaps date and time. But, typically, each traffic ticket has a unique serial number and this would serve as the unique identifier.
UNARY RELATIONSHIPS
Unary relationships associate occurrences of an entity type with other occurrences of the same entity type. Take the entity person, for example. One person may be married to another person and vice versa. One person may be the parent of other people; conversely, a person may have another person as one of their parents.
One-to-One Unary Relationship
Figure 2.7a shows the one-to-one unary relationship called Back-Up involving the salesperson entity. The salespersons are organized in pairs as backup to each other when one is away from work. Following one of the links, say the one that extends from the right side of the salesperson entity box, we can say that salesperson number 137 backs-up salesperson number 186. Then, going in the other direction, salesperson number 186 backs-up salesperson 137. Notice that in each direction the modality of one rather than zero forbids the situation of a salesperson not having a backup.
YOUR TURN
2.1 MODELING YOUR WORLD–PART 1
Whether it's a business environment or a personal environment, the entities, attributes, and relationships around us can be modeled with E-R diagrams.
QUESTION:
How many binary relationships can you think of in your school environment? The entities might be students, professors, courses, sections, buildings, departments, textbooks, and so forth. Make a list of the binary relationships between pairs of these entities and diagram them with E-R diagrams. Do any of the many-to-many binary relationships have intersection data? Explain
One-to-Many Unary Relationship
Some of the salespersons are also sales managers, managing other salespersons. A sales manager can manage several other salespersons. Further, there can be several levels of sales managers, i.e. several low-level sales managers can be managed by a higher-level sales manager. Each salesperson (or sales manager) is managed by exactly one sales manager. This situation describes a one-to-many unary relationship. Consider Figure 2.7b and follow the downward branch out of its salesperson entity box. It says that a salesperson manages zero to many other salespersons, meaning that a salesperson may not be a sales manager (the zero modality case) or may be a sales manager with several subordinate salespersons (the many cardinality case.) Following the branch that extends from the right side of the salesperson entity box, the diagram says that a salesperson is managed by exactly one other salesperson (who must, of course, be a sales manager).
Many-to-Many Unary Relationship
Unary relationships also come in the many-to-many variety. One classic example of a many-to-many unary relationship is known as the “bill of materials” problem. Consider a complex mechanical object like an automobile, an airplane, or a large factory machine tool. Any such object is made of basic parts like nuts and bolts that are used to make other components or sub-assemblies of the object. Small sub-assemblies and basic parts go together to make bigger sub-assemblies, and so on until ultimately they form the entire object. Each basic part and each sub-assembly can be thought of as a “part” of the object. Then, the parts are in a many-to-many unary relationship to each other. Any one particular part can be made up of several other parts while at the same time itself being a component of several other parts.
In Figure 2.7c, think of the products sold in hardware and home improvement stores. Basic items like hammers and wrenches can be combined and sold as sets. Larger tool sets can be composed of smaller sets plus additional single tools. All of these, single tools and sets of all sizes can be classified as products. Thus, as shown in Figure 2.7c, a product can be part of no other products or part of several other products. Going in the reverse direction, a product can be composed of no other products or be composed of several other products.
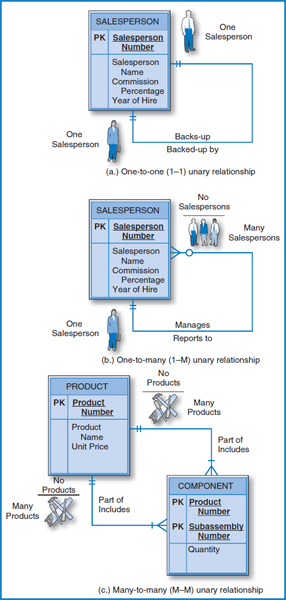
FIGURE 2.7 Unary relationships
TERNARY RELATIONSHIPS
A ternary relationship involves three different entity types. Assume for the moment that any salesperson can sell to any customer. Then, Figure 2.8 shows the most general, many-to-many-to-many ternary relationship among salespersons, customers, and products. It means that we know which salesperson sold which product to which customer. Each sale has intersection data consisting of the date of the sale and the number of units of the product sold.
EXAMPLE: THE GENERAL HARDWARE COMPANY
Figure 2.9 is the E-R diagram for the General Hardware Company, parts of which we have been using throughout this chapter. General Hardware is a wholesaler and distributor of various manufacturers' tools and other hardware products. Its customers are hardware and home improvement stores, which in turn sell the products at retail to individual consumers. Again, as a middleman it buys its goods from the manufacturers and then sells them to the retail stores. How exactly does General Hardware operate? Now that we know something about E-R diagrams, let's see if we can figure it out from Figure 2.9!
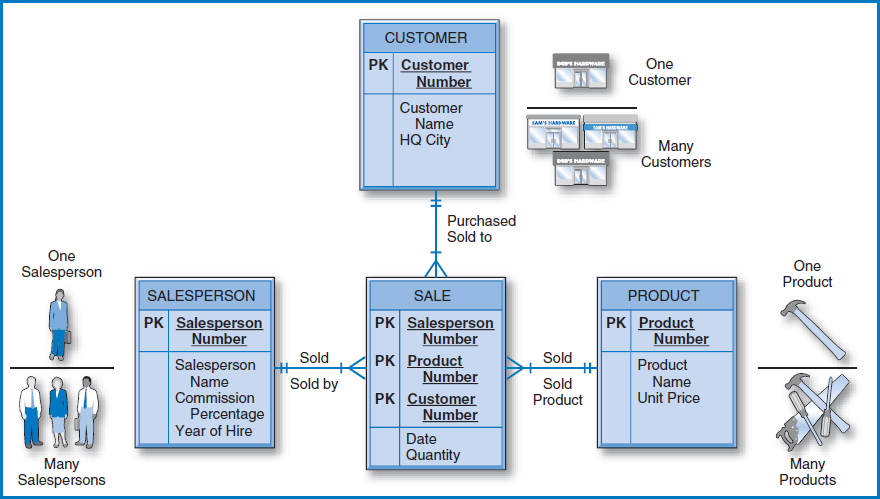
FIGURE 2.8 Ternary relationship
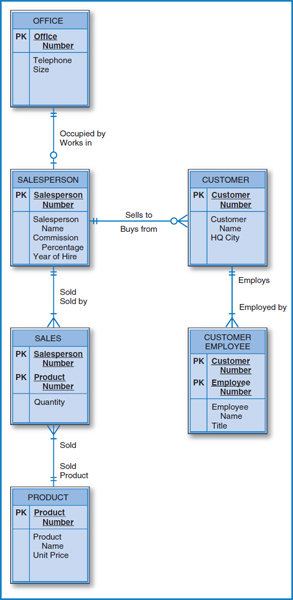
FIGURE 2.9 The General Hardware Company E-R diagram
YOUR TURN
2.2 MODELING YOUR WORLD–PART 2
Can you think of unary and ternary relationships in your world?
QUESTION:
How many unary and ternary relationships can you think of in your school environment? As in Your Turn 2-1, make a list of the unary and ternary relationships in the school environment and diagram them with E-R diagrams. Do any of the many-to-many-many ternary relationships have intersection data? Explain.
Begin with the SALESPERSON entity box in the middle on the left. SALESPERSON has four attributes with one of them, Salesperson Number, serving as the unique identifier of the salespersons. Looking upwards from SALESPERSON, a salesperson works in exactly one office (indicated by the double ones or bars encountered on the way to the OFFICE entity). OFFICE has three attributes; Office Number is the unique identifier. Looking back downwards from the OFFICE entity box, an office has either no salespersons working in it (the zero modality symbol) or one salesperson (the one or bar cardinality symbol). Starting again at the SALESPERSON entity box and moving to the right, a salesperson has no customers or many customers. (Remember that the customers are hardware or home improvement stores.) The CUSTOMER entity has three attributes; Customer Number is the unique identifier. In the reverse direction, a customer must have exactly one General Hardware salesperson.
Below the CUSTOMER entity is the CUSTOMER EMPLOYEE entity. According to the figure, a customer must have at least one but can have many employees. An employee works for exactly one customer. This is actually a special situation. General Hardware only has an interest in maintaining data about the people who are its customers' employees as long as their employer remains a customer of General Hardware. If a particular hardware store or home improvement chain stops buying goods from General Hardware, then General Hardware no longer cares about that store's or chain's employees. Furthermore, while General Hardware assumes that each of its customers assigns their employees unique employee numbers, those numbers can be assumed to be unique only within that customer store or chain. Thus, the unique identifier for a customer employee must be the combination of the Customer Number and the Employee Number attributes. In this situation, CUSTOMER EMPLOYEE is called a dependent or weak entity.
Returning to the SALESPERSON entity box and looking downward, there is a one-to-many relationship between salespersons and sales. But, below that, there is also a one-to-many relationship from products to sales. Also note that the unique identifier of SALES is the combination of Salesperson Number and Product Number. This is the signal that there is a many-to-many relationship between salespersons and products! A salesperson is authorized to sell at least one and generally many products. A product is sold by at least one and generally many salespersons. The PRODUCT entity has three attributes, with Product Number being the unique identifier. The attribute Quantity is intersection data in the many-to-many relationship and so becomes an attribute in the associative entity SALES that links salespersons with the products they have sold in a many-to-many relationship.
EXAMPLE: GOOD READING BOOK STORES
Figure 2.10 shows the E-R diagram for Good Reading Bookstores. Good Reading is a chain of bookstores that wants to keep track of the books that it sells, their publishers, their authors, and the customers who buy them. The BOOK entity has four attributes. Book Number is the unique identifier. A book has exactly one publisher. Publisher Name is the unique identifier of the PUBLISHER entity. A publisher may have (and generally has) published many books that Good Reading carries; however, Good Reading also wants to be able to keep track of some publishers that currently have no books in Good Reading's inventory (note the zero-modality symbol from PUBLISHER towards BOOK). A book must have at least one author but can have many (where in this case “many” means a few, generally two or three at most). For a person to be of interest to Good Reading as an author, she must have written at least one and possibly many books that Good Reading carries. Note that there is a many-to-many relationship between the BOOK and AUTHOR that is realized in the associative entity WROTE, which has no intersection data. The company wants to keep track of which authors wrote which books, but there are no attributes that further describe that many-to-many relationship. The associative entity SALE indicates that there is a many-to-many relationship between books and customers. A book can be involved in many sales and so can a customer. But a particular sale involves just one book and one customer. Date, Price, and Quantity are intersection data in the many-to-many relationship between the BOOK and CUSTOMER entities.
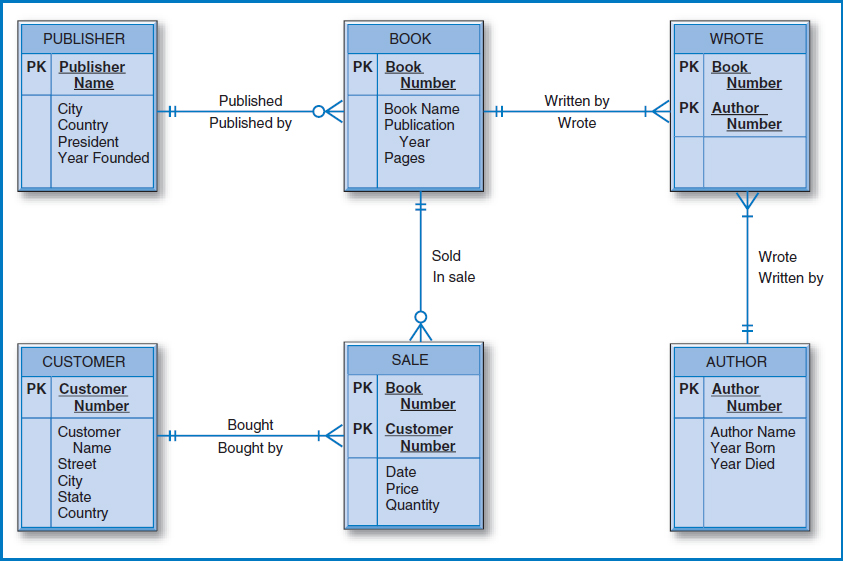
FIGURE 2.10 Good Reading Bookstores entity-relationship diagram
YOUR TURN
2.3 MODELING YOUR WORLD–PART 3
Now it's time to put the university environment all together.
QUESTION:
Create one comprehensive E-R diagram for your university environment that you developed in Your Turn Parts 1 and 2.
Does this make sense? Might a customer have bought several copies of the same book on the same date? After all, that's what the presence of the Quantity attribute implies. And might she have then bought more copies of the same book on a later date? Yes to both questions! A grandmother bought a copy of a book for each of three of her grandchildren one day and they liked it so much that she returned and bought five more copies of the same book for her other five grandchildren several days later. By the way, notice that the modality 0 going from book to sale says that a book may not have been involved in any sales (maybe it just came out). The modality of 1 going from customer to book says that for a person to be considered a customer, he must have participated in at least one sale, which is reasonable.
EXAMPLE: WORLD MUSIC ASSOCIATION
The World Music Association (WMA) is an organization that maintains information about its member orchestras and the recordings they have made. The WMA E-R diagram in Figure 2.11 shows the information about the orchestras and their musicians across the top and the information about the recordings in the rest of the diagram. Each orchestra has at least one and possibly many musicians. (In this case, the modality expressing “at least one” is a technicality. Certainly an orchestra must have many musicians.) A musician might not work for any orchestra (perhaps she is currently unemployed but WMA wants to keep track of her anyway) or may work for just one orchestra. A musician may not be a college graduate or may have several college degrees. A degree belongs to just one musician (for the moment we ignore the possibility that more than one musician earned the same degree from the same university in the same year). Since the DEGREE entity is dependent on the MUSICIAN entity, the unique identifier for DEGREE is the combination of the Musician Number and Degree (e.g. B.A.) attributes.
Looking downward from the ORCHESTRA entity box, an orchestra may have made no recordings of a particular composition or may have made many. In the reverse direction, a composition may not have been recorded by any orchestra (but we still want to maintain data about it) or may have been recorded by many orchestras. For a particular recording, we note the year of the recording and the retail price, as intersection data of the many-to-many relationship between orchestras and compositions. In fact, RECORDING is an associative entity. A composer may have several compositions to his credit but must have at least one to be of interest to WMA. A composition is associated with exactly one composer. COMPOSITION is a dependent entity to COMPOSER, which means that the unique identifier of COMPOSITION is the combination of Composer Name and Composition Name. After all, there could be Beethoven's “Third Symphony” and Mozart's “Third Symphony.” This has an important implication for the RECORDING associative entity. To uniquely identify a recording (and attach the year and price intersection data to it) requires an Orchestra Name, Composition Name, and Composer Name.
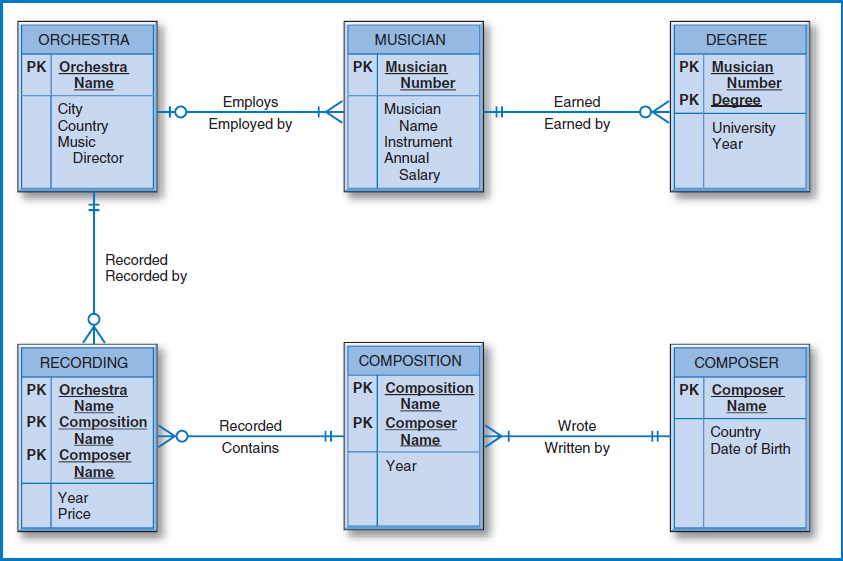
FIGURE 2.11 World Music Association entity-relationship diagram
EXAMPLE: LUCKY RENT-A-CAR
Lucky Rent-A-Car's business environment is, obviously, centered on its cars. This is literally true in its E-R diagram, shown in Figure 2.12. A car was manufactured by exactly one manufacturer. A manufacturer manufactured at least one and generally many of Lucky's cars. A car has had many maintenance events (but a brand new car may not have had any, yet.) A car may not have been rented to any customers (again, the case of a brand new car) or to many customers. A customer may have rented many cars from Lucky, and to be in Lucky's business environment must have rented at least one. Rental Date, Return Date, and Total Cost are intersection data to the many-to-many relationship between CAR and CUSTOMER, as shown in the associative entity RENTAL.
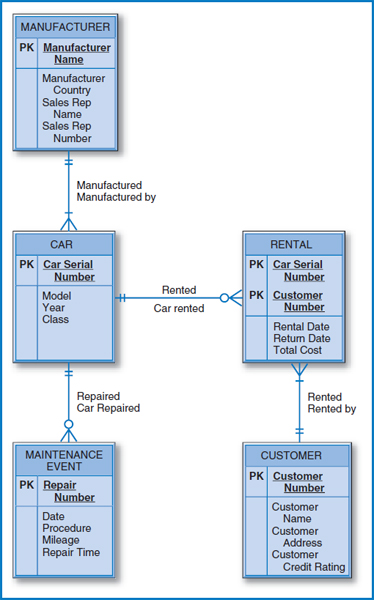
FIGURE 2.12 Lucky Rent-A-Car entity-relationship diagram
SUMMARY
Being able to express entities, attributes, and relationships is an important preliminary step towards database management. The Entity-Relationship Model is a diagramming technique that gives us this capability. The E-R model can display unary relationships (relationships between entities of the same type,) binary relationships (relationships between entities of two different types), and ternary relationships (relationships between entities of three different types). Based on the number of distinct entities involved in a relationship, we expand this to one-to-one, one-to-many, and many-to-many unary relationships, one-to-one, one-to-many, and many-to-many binary relationships, and ternary relationships (which we consider to in general be many-to-many-to-many.)
Other terms and concepts discussed include cardinality (the maximum number of entities that can be involved in a particular relationship), modality (the minimum number of entity occurrences that can be involved in a relationship), intersection data (data that describes a many-to-many relationship), and associative entities.
KEY TERMS
Attribute
Associate entity
Binary relationship
Cardinality
Data modeling
Entity
Entity-relationship (E-R) diagram
Entity-relationship (E-R) model
Intersection data
Many-to-many relationship
Modality
One-to-many relationship
One-to-one relationship
Relationship
Ternary relationship
Unary relationship
Unique identifier
QUESTIONS
- What is data modeling? Why is it important?
- What is the Entity-Relationship model?
- What is a relationship?
- What are the differences among a unary relationship, a binary relationship, and a ternary relationship?
- Explain and compare the cardinality of a relationship and the modality of a relationship.
- Explain the difference between a one-to-one, a one-to-many, and a many-to-many binary relationship.
- What is intersection data in a many-to-many binary relationship? What does the intersection data describe?
- Can a many-to-many binary relationship have no intersection data? Explain.
- Can intersection data be placed in the entity box of one of the two entities in the many-to-many relationship? Explain.
- What is an associative entity? How does intersection data relate to an associative entity?
- Describe the three cases of unique identifiers for associative entities.
- Describe the concept of the unary relationship.
- Explain how a unary relationship can be described as one-to-one, one-to-many, and many-to-many if only one entity type is involved in the relationship.
- Describe the ternary relationship concept.
- Can a ternary relationship have intersection data? Explain.
- What is a dependent entity? (See the description in the General Hardware example.)
EXERCISES
Draw an entity-relationship diagram that describes the following business environment.
The city of Chicago, IL, wants to maintain information about its extensive system of high schools, including its teachers and their university degrees, its students, administrators, and the subjects that it teaches.
Each school has a unique name, plus an address, telephone number, year built, and size in square feet. Students have a student number, name, home address, home telephone number, current grade, and age. Regarding a student's school assignment, the school system is only interested in keeping track of which school a student currently attends. Each school has several administrators, such as the principal and assistant principals. Administrators are identified by an employee number and also have a name, telephone number, and office number.
Teachers are also identified by an employee number and each has a name, age, subject specialty such as English (assume only one per teacher), and the year that they entered the school system. Teachers tend to move periodically from school to school and the school system wants to keep track of the history of which schools the teacher has taught in, including the current school. Included will be the year in which the teacher entered the school, and the highest pay rate that the teacher attained at the school. The school system wants to keep track of the universities that each teacher attended, including the degrees earned and the years in which they were earned. The school system wants to record each university's name, address, year founded, and Internet URL (address). Some teachers, as department heads, supervise other teachers. The school system wants to keep track of these supervisory relationships but only for teachers' current supervisors.
The school system also wants to keep track of the subjects that it offers (e.g. French I, Algebra III, etc.). Each subject has a unique subject number, a subject name, the grade level in which it is normally taught, and the year in which it was introduced in the school system. The school system wants to keep track of which teacher taught which student which subject, including the year this happened and the grade received.
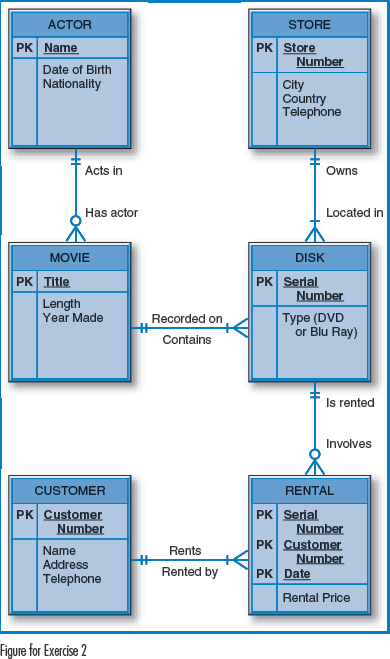
- The following entity-relationship diagram describes the business environment of Video Centers of Europe, Ltd., which is a chain of videotape and DVD rental stores. Write a verbal description of how VCE conducts its business, based on this E-R diagram.
MINICASES
Draw an entity-relationship diagram that describes the following business environment.
Happy Cruise Lines has several ships and a variety of cruise itineraries, each involving several ports of call. The company wants to maintain information on the sailors who currently work on each of its ships. It also wants to keep track of both its past and future cruises and of the passengers who sailed on the former and are booked on the latter.
Each ship has at least one and, of course, normally many sailors on it. The unique identifier of each ship is its ship number. Other ship attributes include ship name, weight, year built, and passenger capacity. Each sailor has a unique sailor identification number, as well as a name, date of birth, and nationality. Some of the sailors are in supervisory positions, supervising several other sailors. Each sailor reports to just one supervisor. A cruise is identified by a unique cruise serial number. Other cruise descriptors include a sailing date, a return date, and a departure port (which is also the cruise's ending point). Clearly, a cruise involves exactly one ship; over time a ship sails on many cruises, but there is a requirement to be able to list a new ship that has not yet sailed on any cruises at all. Each cruise stops at at least one and usually several ports of call, each of which is normally host to many cruises, over time. In addition, the company wants to maintain information about ports that it has not yet used in its cruises but may use in the future. A port is identified by its name and the country it is in. Other information about a port includes its population, whether a passport is required for passengers to disembark there, and its current docking fee, which is assumed to be the same for all ships. Passenger information includes a unique passenger number, name, home address, nationality, and date of birth. A cruise typically has many passengers on it (certainly at least one). Hoping for return business, the company assumes that each passenger may have sailed on several of its cruises (and/or may be booked for a future cruise). For a person to be of interest to the company, he or she must have sailed on or be booked on at least one of the company's cruises. The company wants to keep track of how much money each passenger paid (or will pay) for each of their cruises, as well as their satisfaction rating of the cruise, if it has been completed.
Draw an entity-relationship diagram that describes the following business environment. The Super Baseball League wants to maintain information about its teams, their coaches, players, and bats. The information about players is historical. For each team, the league wants to keep track of all of the players who have ever played on the team, including the current players. For each player, it wants to know about every team the player ever played for. On the other hand, coach affiliation and bat information is current, only.
The league wants to keep track of each team's team number, which is unique, its name, the city in which it is based, and the name of its manager. Coaches have a name (which is assumed to be unique only within its team) and a telephone number. Coaches have units of work experience that are described by the type of experience and the number of years of that type of experience. Bats are described by their serial numbers (which are unique only within a team) and their manufacturer's name. Players have a player number that is unique across the league, a name, and an age.
A team has at least one and usually several coaches. A coach works for only one team. Each coach has several units of work experience or may have none. Each unit of work experience is associated with the coach to whom it belongs. Each team owns at least one and generally many bats. Currently and historically, each team has and has had many players. To be of interest to the league, a player must have played on at least one and possibly many teams during his career. Further, the league wants to keep track of the number of years that a player has played on a team and the batting average that he compiled on that team.