Beginner Level: Final Examination
The final exam consists of eight charts with questions. You may use any of the guide/summary sheets prepared for you in Chapter 5.
The answers will be found in the Exercise Appendix.
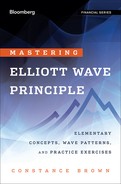
Question 1: Figure 5.16 is a daily chart of the DIA ETF for the Dow Jones Industrial Average. Pay no attention to the volatility bands running through the price data. You will have to become accustomed to reading wave structure through other analytics on your charts. Wave ‘4’ has already been labeled for you. What kind of corrective pattern did the market develop?
FIGURE 5.16 Final Exam 1
Source: Aerodynamic Investments Inc., Advanced Trading Seminar, TradeStation.
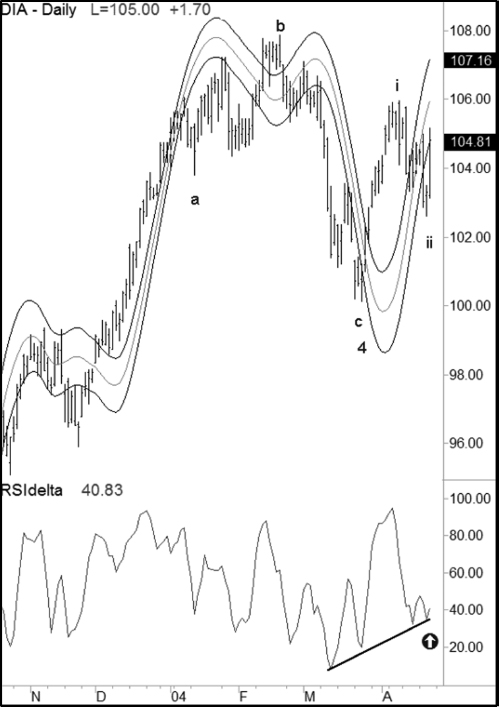
Question 2: Figure 5.17 shows three housing stocks that enjoyed a spectacular emotional bubble that imploded in 2008. These charts were captured in 2004. KBH is forming a diagonal triangle termination pattern. CTX is clearly near the end of wave ‘3’ up. Can a diagonal triangle end a third wave?
FIGURE 5.17 Housing Sector Stocks (CTX Monthly, KBH Weekly, PHM Weekly)
Source: Aerodynamic Investments Inc., © 1996–2012, Daily Market Report, www.aeroinvest.com; TradeStation.
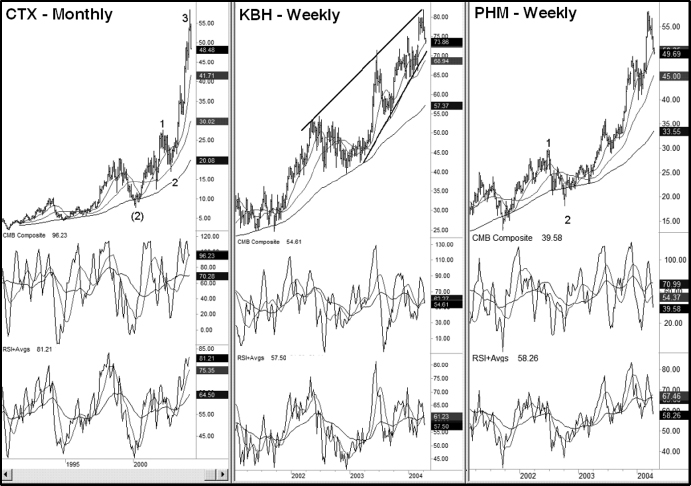
Question 3: The monthly chart for CVX in Figure 5.18 shows a complete five-wave pattern in the larger trend up. Wave 4 was a sizeable event. What kind of corrective pattern developed in the wave ‘b of 4’ position?
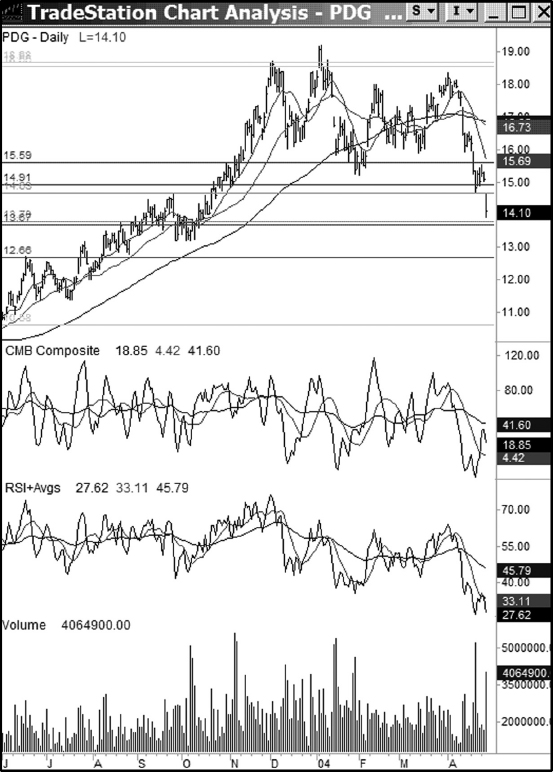
Question 4: Draw two boxes in the daily PDG chart (Figure 5.19) that demonstrate zigzag corrective patterns. Draw two lines to show where a diagonal triangle developed within the same chart.
FIGURE 5.19 PDG, Daily
Source: Aerodynamic Investments Inc., © 1996–2012, Daily Market Report, www.aeroinvest.com; TradeStation.
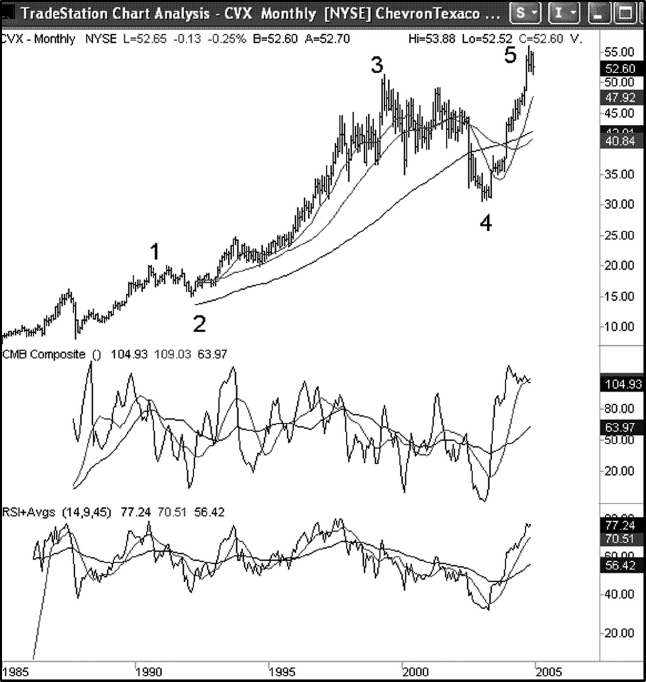
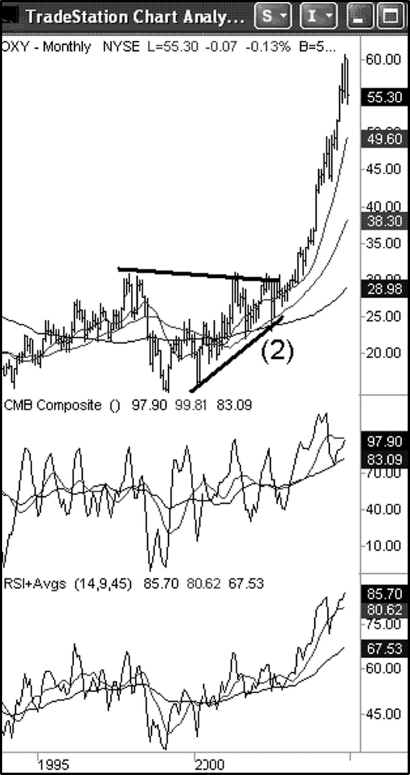
Question 5: Figure 5.20 shows the monthly chart for OXY stock. Is wave (3) up complete?
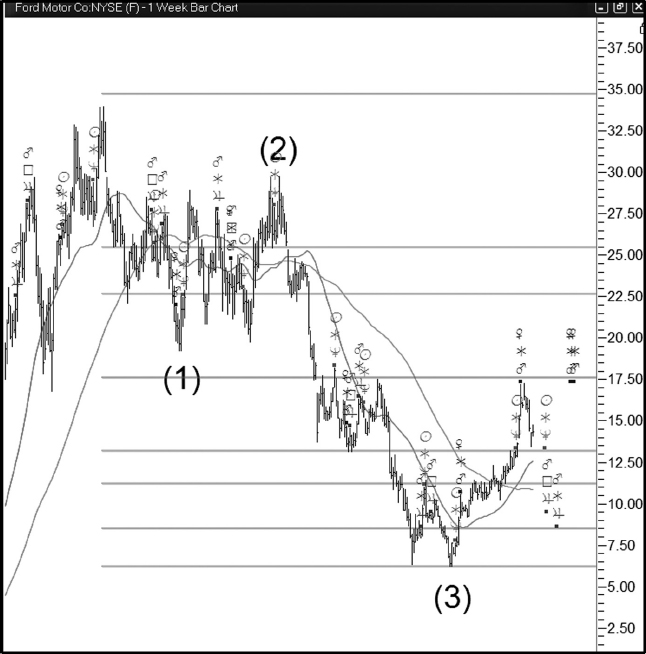
Question 6: Ford (F) stock is displayed in a weekly time horizon in Figure 5.21. The wave interpretation in this chart suggests an impulse wave is unfolding that will create five waves down. Is wave (4) up complete now, and can the most recent pivot high near 17.50 be marked as (4)?
FIGURE 5.21 Ford, Weekly
Source: Aerodynamic Investments Inc., © 1996–2012, Daily Market Report, www.aeroinvest.com; TradeStation.
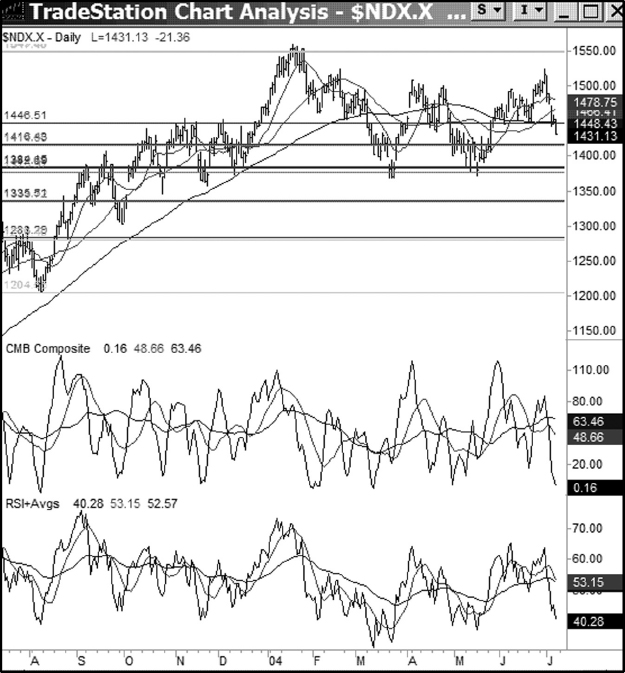
Question 7: The Nasdaq Index is shown in a daily chart in Figure 5.22. Identify where a contracting triangle developed.
FIGURE 5.22 Nasdaq Index, Daily
Source: Aerodynamic Investments Inc., © 1996–2012, Daily Market Report, www.aeroinvest.com; TradeStation.
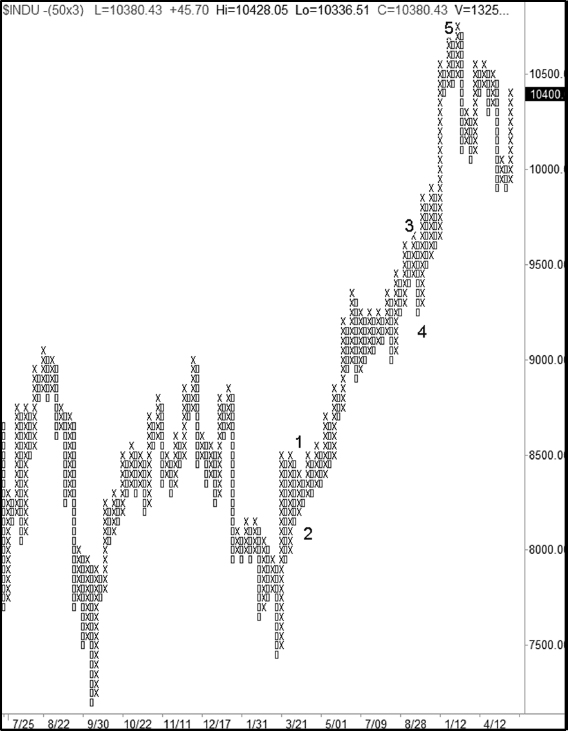
Question 8: Identify the location of two different contracting triangles in the point-and-figure chart for the Dow Jones Industrial Average in Figure 5.23.
FIGURE 5.23 Dow Jones Industrial Average, Point-and-Figure
Source: Aerodynamic Investments Inc., Seminars, TradeStation.
The answers will be found in the Exercise Appendix.
![]()
When you are finished with the exams you will be ready to move on and further your skill level in Advanced Elliott Wave Analysis: Complex Patterns, Intermarket Relationships, and Global Cash Flow Analysis. I look forward to moving past the basics as the global chess board is a fascinating study when you apply the Elliott Wave Principle with skill. You will also learn ways to increase your probability for the wave interpretations you develop on your own. Do not think you are ready to do so at your current level, but you will have the skill to understand others’ charts and recognize when the application of another’s wave interpretation violates the basic tenants of the Wave Principle. That is an invaluable accomplishment. But we have so much more to cover together. We will surely meet again soon.