
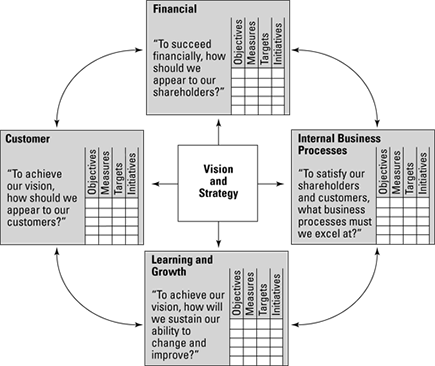
Figure 13-1: The Balanced Scorecard model.
Chapter 13
Management Tools
In This Chapter
![]() Understanding strategy
Understanding strategy
![]() Being there
Being there
![]() Leading through management information tools
Leading through management information tools
Lean is a strategic initiative. You undertake Lean because it makes good business and financial sense as a long-term direction for your organization. Yet, Lean requires not just a strategic vision, but a deep, personal daily commitment to improvement; you are changing your culture (see Part II). You need to have the right measurement system. You need to closely watch the short-term and long-term metrics. You need to learn from your experiences — both the successes and the failures. And you need to help everyone be actively involved on a daily basis.
Without the attention of managers and the participation of executives, the changes developed in a Lean implementation are not sustainable. In this chapter, we introduce you to tools that support the development and tracking of the business strategy, tactical initiatives, and the overall performance of the business.
Like other aspects of Lean, managerial tools are visual. Along with the customer and value-stream tools in Chapter 10, the flow and pull tools described in Chapter 11, and the perfection tools in Chapter 12, these tools make up the overall Lean toolbox. You need all these tools to support Lean implementation.
The chapter concludes with a general discussion of software tools to support Lean in the global extended enterprise. Although Lean is about simplicity and the elimination of waste, it is also about the appropriate implementation of technology. Follow a philosophy of: simplify and eliminate, then automate and integrate. This will help guide the management team to the appropriate level of technology implementation.
Managing Strategy
A successful management team manages both the long-term strategy of the organization and the tactical, day-to-day activities of the business. It’s the same in a successful Lean organization: creating the master plan and measuring everyday progress to that plan. And in keeping with Lean fundamentals, the process of strategy development, deployment, and measurement should be simple and visual.
Strategy and measurement tools are plentiful in the marketplace, and the ones included in this section align with the tenets of Lean. The Plan-Do-Check-Act (PDCA) cycle central to kaizen also provides a great foundation for strategy development and implementation. Collectively, these tools help the management team effectively lead their organization through the Lean transformation.
 In all that you do, your mantra should be “Simplify, eliminate, automate, then integrate.” Lean is all about simplifying, eliminating waste, and then helping people use tools and technology to integrate functions and processes. Management teams can easily fall prey to consultants or IT vendors offering the latest and greatest whiz-bang solutions to all their problems. Automating bad business practices will not fix your problems. Magic wands do not exist. Whether developing strategy, performing kaizen activities, or evaluating technology, don’t stray from the essence of Lean: Eliminate waste in everything you do.
Hoshin: balanced planning
The term hoshin kanri means “direction setting.” The Lean planning system built around it is known as hoshin planning or policy deployment. The hoshin planning process is a proven, effective strategic planning process that follows the PDCA improvement cycle. In hoshin, the organization makes plans and then conducts a regular standardized self-analysis. The results provide inputs for updating the plan.
Hoshin planning is a two-pronged approach of (a) strategic planning and alignment, and (b) everyday operations fundamentals. The goal of hoshin planning is to ensure that the organization is developing its longer-term (two- to five-year) objectives and strategies, as well as managing short-term everyday business execution. It is also fundamentally based on the principle that you achieve the best results when everyone in the organization fully understands the goals and is involved in the planning processes to achieve them.

Hoshin planning, to be truly effective, must also be cross-functional, promoting cooperation along the value stream, within and between business functions. The different departments of an organization must collaborate and support each other to achieve the remarkable results only possible through synergy and cooperation.
Understanding the hoshin planning process
Hoshin planning systematizes strategic planning. The format of the plans is unified via standards and measured through tables. This standardization provides you a structured approach for developing and producing the organization’s strategic plan. The structure and standards also enable you to have an efficient way to link the strategic plan through the organization. This ultimately leads everyone to an organization-wide understanding of not just the plan but also the planning process.
Hoshin planning is a seven-step process, in which you perform the following management tasks:
![]() Identify the key business issues facing the organization and relate them to how you provide value to the customer/consumer.
Identify the key business issues facing the organization and relate them to how you provide value to the customer/consumer.
![]() Establish balanced measurable business objectives that address these issues.
Establish balanced measurable business objectives that address these issues.
![]() Define the overall vision and goals.
Define the overall vision and goals.
![]() Develop supporting strategies for pursuing the goals, including how you apply Lean to achieve these goals.
Develop supporting strategies for pursuing the goals, including how you apply Lean to achieve these goals.
![]() Determine the tactics and objectives that facilitate each strategy.
Determine the tactics and objectives that facilitate each strategy.
![]() Implement performance measures for each business process.
Implement performance measures for each business process.
![]() Measure business fundamentals.
Measure business fundamentals.
Be sure you identify measurable objectives, goals, and supporting strategies with process and functional owners to address critical business issues.
Setting the hoshin tables
Hoshin plans aren’t the result of academic exercises; they don’t collect dust on a shelf. You check them regularly against actual performance. In the hoshin process you employ a standardized set of reports, known as tables, in the review process. Managers and work teams use these reports to assess performance. Each table includes:
![]() A header, showing the author and scope of the plan
A header, showing the author and scope of the plan
![]() The situation, to give meaning to the planned items
The situation, to give meaning to the planned items
![]() The objective (what is to be achieved)
The objective (what is to be achieved)
![]() Milestones that will show when the objective is achieved
Milestones that will show when the objective is achieved
![]() Strategies for how the objectives are achieved
Strategies for how the objectives are achieved
![]() Measures to check that the strategies are being achieved
Measures to check that the strategies are being achieved
The different hoshin tables are:
![]() Hoshin review table: During reviews, present plans in the form of standardized hoshin review tables. In each table, show a single objective and its supporting strategies. A group or the individual responsible for several objectives should generate several review tables in order to cover all objectives.
Hoshin review table: During reviews, present plans in the form of standardized hoshin review tables. In each table, show a single objective and its supporting strategies. A group or the individual responsible for several objectives should generate several review tables in order to cover all objectives.
![]() Strategy implementation table: Use strategy implementation tables to identify the tactics or action plans you need to accomplish each strategy. With implementation tables, present the following information:
Strategy implementation table: Use strategy implementation tables to identify the tactics or action plans you need to accomplish each strategy. With implementation tables, present the following information:
• The tactics needed to implement the strategy
• The people involved in each tactic and their exact responsibilities
• The timeline of each tactic, usually presented as a Gantt chart (a time-phased graphical representation of project activities and tasks)
• Performance measures
• How and when you will review the implementation
![]() Business fundamentals table (BFT): A business fundamentals table depicts the elements that define the success of a business process. In the table, you show how these elements are monitored through their corresponding metrics. Examples of business fundamentals are safety, people, quality, responsiveness, and cost. You must have the BFT figures in control before attending to the long-term strategies.
Business fundamentals table (BFT): A business fundamentals table depicts the elements that define the success of a business process. In the table, you show how these elements are monitored through their corresponding metrics. Examples of business fundamentals are safety, people, quality, responsiveness, and cost. You must have the BFT figures in control before attending to the long-term strategies.
![]() Annual planning table (APT): Record the organization’s objectives and strategies in the annual planning table. Then pass the APT down to the next organizational structure. Flow this pass-down process throughout the entire organization. Each level of your organization develops its plan to support the overall top-level organizational plan.
Annual planning table (APT): Record the organization’s objectives and strategies in the annual planning table. Then pass the APT down to the next organizational structure. Flow this pass-down process throughout the entire organization. Each level of your organization develops its plan to support the overall top-level organizational plan.
You can find software packages to help you create these tables.
Making and proliferating the annual plan
Senior managers are ultimately responsible for establishing the strategies, goals, and balanced performance measures used to address the organization’s issues for the coming year. Some organizations find it helpful to use issue teams. These teams consist of the functional, process managers and senior leaders most involved with a given issue. Together, they formulate the objectives and strategies, which best address the critical business issues at hand and maintain or improve customer satisfaction. Ultimately, the senior leadership must be convinced that the selected strategies will make it possible to achieve the objectives and resolve critical business issues.
Record the organization’s objectives and strategies in the annual planning table. Pass the APT down to the next organizational structure. As the plans cascade through the organization, the strategies of one level become the objectives of the next level down in the organization. This provides direction and hierarchical linkage to the plan’s highest level. At each succeeding level, strategies are owned, expanded, and turned into implementation plans that contribute to reaching the objective and the overall goal.
As each succeeding level accepts its portion of the plan, it has been involved in the plan’s development by adding detail where it can best contribute and add value. This is also how the organization buys into the plan; it now has some ownership of the plan itself. The hoshin methodology is a strategic planning process with the built-in ability to empower the organization.
Implementing hoshin
The implementation Do process includes the execution of the hoshin activities, along with the timelines and checkpoints for specific events. Use the implementation plan as an ongoing decision-making tool. Plot or note the actual performance to plan along the planned events and checkpoints.
The implementation plan usually requires you to coordinate both within and between functional departments and process owners. Implementation plans are not just the responsibility of an individual completing the lowest-level annual plan. Each level and process in the organization must articulate and own detailed responsibilities to ensure support for and successful completion of the organization’s plans. This is how you make the Do step of PDCA happen.
The annual hoshin review
Because hoshin is a cyclic process, the review of the previous year’s performance is the basis for the next year’s plan.
![]() For the objectives that were completed successfully, perform an analysis to determine what went right and to determine if the supporting strategies and performance measures initially established were truly appropriate. Also, note any exceptional results and how they were obtained. This step is critical to capturing knowledge of how to exceed goals, and then transferring that knowledge to the organization.
For the objectives that were completed successfully, perform an analysis to determine what went right and to determine if the supporting strategies and performance measures initially established were truly appropriate. Also, note any exceptional results and how they were obtained. This step is critical to capturing knowledge of how to exceed goals, and then transferring that knowledge to the organization.
Recognizing major contributors to the success of the plan builds the team and reinforces the importance of plan achievement.
![]() For each objective not attained, determine the reasons for the shortfall. Analyze the detailed supporting data of all strategies associated with the objective. Ask the strategy owners to identify what their teams would have changed in the plan to have been more successful in the year just completed, as well as for the future. This process of both looking back and ahead improves organizational learning.
For each objective not attained, determine the reasons for the shortfall. Analyze the detailed supporting data of all strategies associated with the objective. Ask the strategy owners to identify what their teams would have changed in the plan to have been more successful in the year just completed, as well as for the future. This process of both looking back and ahead improves organizational learning.
Conduct reviews at all levels of the organization. Starting at the lowest level that has plan ownership, complete the review and pass the information up and across the organizational structure (management levels). Have each level use the review tables from previous structures (management levels) to complete its own review. Foster discussions between the different structures of the organization to achieve consensus on the review table results.
In addition to listing objectives from the previous year’s plan, use the review table to call attention to important issues for the coming year. When the review reaches the senior managers, the hoshin review tables highlight the areas in which the organization made significant progress and attained the identified goal, and where changes should be made or more work is needed.
Complete the review using information from:
![]() Hoshin review tables
Hoshin review tables
![]() Corporate objectives
Corporate objectives
![]() Business plans
Business plans
![]() Economic projections
Economic projections
![]() Customer inputs
Customer inputs
![]() A quality assessment (if conducted)
A quality assessment (if conducted)
The senior managers can determine whether the prior year’s critical business issues and objectives are still appropriate for the coming year. This also is the time to make sure the organization is providing value to its customers as described in the plans. Also they ensure that the plans are consistent with moving the business in the direction of the long-term vision (ideal state).
Reviewing progress periodically
Although the planning cycle is annual, review business fundamental metrics monthly to ensure that performance is trending in the right direction. Review the annual plan quarterly to ensure that the plan is still the right plan. If the metrics aren’t trending in the right direction, identify countermeasures to get the plan back on track. The actions may comprise as many as three phases:
![]() Alleviating the immediate problem with an emergency countermeasure.
Alleviating the immediate problem with an emergency countermeasure.
![]() Preventing the problem from recurring with a short-term fix.
Preventing the problem from recurring with a short-term fix.
![]() Determining and removing the problem’s root cause. This is the permanent solution that will prevent the problem from recurring.
Determining and removing the problem’s root cause. This is the permanent solution that will prevent the problem from recurring.
The final annual review is essentially a compilation and summary of the hoshin review tables accumulated during the year. This final review returns you to the Study step described earlier. The Study step plays a crucial role in improving organizational learning ability. When actual performance and results are compared and a deviation-from-plan analysis is completed, those closest to the strategy make visible to the organization’s leaders a great deal of information.
Reflection — thoroughly analyzing what went right or what went wrong in each strategy — is an important aspect of management reviews. Determining objectively which strategies and actions worked — and which strategies actions need improvement because they failed to hit their targets — is required in the organization’s learning process. This is not a blame session! Focus on the strategies and actions; don’t point fingers.
The Balanced Scorecard
The health and effectiveness of an organization is reflected only in part by its financial performance. Corporations report revenues, costs, and earnings; nonprofits measure fundraising; government organizations track budgets. Although the numbers are important, everyone knows that numbers are only one of several indicators of its true condition. To create a more balanced picture, Harvard researchers Dr. Robert Kaplan and Dr. David Norton developed a concept in the early 1990s called the Balanced Scorecard.
Kaplan and Norton recognized that a retrospective on financial performance alone is a wholly insufficient way to measure and guide organizations in the emerging postindustrial information age. It is both impractical and inappropriate to use financials as the sole basis for evaluating and managing the broad spectrum of customers, employees, suppliers, and distributors, as well as the processes and technologies that enable a modern enterprise. You need something more holistic.
As Kaplan and Norton formalized it, the Balanced Scorecard is a framework for both evaluating and managing an organization along the lines of four distinct perspectives: financial (of course), but also customer, process, and learning. Figure 13-1 shows the conceptual framework. In the Balanced Scorecard approach, the organization creates measurable indicators in each of the four areas, which are used both to track progress as well as manage achievement toward its vision. Simple and easy to understand, the Balanced Scorecard has been applied in some form as a standardized system of measurement in a majority of the world’s companies.
Balanced Scorecard basics
The underlying framework for the Balanced Scorecard methodology is built on many of the same principles as Lean, including the following:
![]() Focus on the customer and, in particular, on the fact that the customer defines value
Focus on the customer and, in particular, on the fact that the customer defines value
![]() Structured application of measurements and controls
Structured application of measurements and controls
![]() Quality at the source
Quality at the source
![]() Continuous improvement, through measurement and feedback
Continuous improvement, through measurement and feedback
![]() Engagement, empowerment, and development of employees
Engagement, empowerment, and development of employees
Consistent with hoshin, the balanced scorecard incorporates the outputs from internal business processes as well as from vision and strategy planning. It requires the organization to develop metrics based on strategic planning priorities, as well as the operational business fundamentals. This enables everyone to observe the outcomes of the measured processes and strategies and track the results to guide the organization and provide feedback.
Scorecard sections
The standard Balanced Scorecard contains four cards — one each for customer, financials, processes, and learning. They are purposely interdependent, forming a holistic view of the enterprise:
![]() Customer: The customer card focuses on the measures that demonstrate the ability of the organization to provide quality goods and services, effective delivery, and overall customer satisfaction. This includes both internal and external customers.
Customer: The customer card focuses on the measures that demonstrate the ability of the organization to provide quality goods and services, effective delivery, and overall customer satisfaction. This includes both internal and external customers.
![]() Financial: The financials card mirrors that of most top-level financial reports, consistent with the nature of the enterprise (public, private, nonprofit, governmental).
Financial: The financials card mirrors that of most top-level financial reports, consistent with the nature of the enterprise (public, private, nonprofit, governmental).
![]() Process: The internal process card reports on the status and performance of the key business processes that constitute the core business functions (that is, what generates value for the customer).
Process: The internal process card reports on the status and performance of the key business processes that constitute the core business functions (that is, what generates value for the customer).
![]() Learning: The final card is a report on the learning, development, and growth elements of the people, systems, and culture of the organization. This includes skills, communications, motivation, and agility.
Learning: The final card is a report on the learning, development, and growth elements of the people, systems, and culture of the organization. This includes skills, communications, motivation, and agility.
You can easily see how the standard Balanced Scorecard would reflect the status and performance of a Lean organization. For this reason, the Balanced Scorecard is an acceptable tool of measure and works synergistically in a Lean enterprise.
 You can use the Balanced Scorecard as more than a measurement system — you can also use it as the basis for a management system as well. This is true, to the extent that you get what you measure. If you’re embarking on a Lean journey, however, be careful about mixing your management systems. In the Lean world, Balanced Scorecard is a framework for reporting.
Create your scorecard to fit your organization. Although the standard Balanced Scorecard is prescriptive, you may find it more beneficial to track a different mix of categories — such as safety, people, quality, responsiveness, or cost. Find the right fundamental business metrics for your organization and review them on a frequent basis — at least monthly.
Go and Observe
Lean managers know that they cannot effectively lead their organizations from their office. They need to be where the action is, where customer value is created — to build relationships, to understand the real issues, and to set performance expectations. You can create the most eloquent annual plan, but without involvement in the day-to-day activities, those plans are pipe dreams.
But it’s more than just getting out of the office. The tools of this section create a framework for these managerial activities. Gemba walks, for example, aren’t random strolls through an operation — they’re focused on Lean implementation, safety, quality, or some other perspective. Whether conducted by an individual or team of people, the intention of a gemba review is clear.
At any level, the best way to know what is going on in the business is to “go, observe, and get the facts.”
The power of 3 Gen
The principle of 3 Gen — genchi (like gemba), genbutsu, genjitsu — compels us to go to the actual place, observe the actual product or service and gather actual facts. In other words, get up off your butt and go find out for yourself — for real! Recognize that the electronic channels — the telephone, video conferencing, and the Internet — aren’t enough to transmit the whole story. Yes, the overhead of travel (whether it’s next door, on another floor, in another building, or across the ocean) is, strictly speaking, non-value-added, but it far overcomes the loss of detail, context, texture, and personal interaction. Reality is the only way you will truly solve problems and know what is really happening is to go to the actual place (gemba) where your products or services are produced.
In the modern, technology-enabled, hierarchical and geographically- dispersed work environment, people seldom feel compelled to wander much beyond the space between the conference room, the break room, and their office or cubicle (or, for the tele-commuter, the space between the kitchen, back porch, and home office!). Communications happen via e-mail, conference calls, net-meetings, and on-line presentations. The risk is that you never really get the true information; this is why it is vital to practice 3 Gen. Here are some examples of 3 Gen in action:
![]() Interacting with customers to better understand their needs and behaviors
Interacting with customers to better understand their needs and behaviors
![]() Visiting the manufacturing, distribution, and retail facilities prior to beginning design work
Visiting the manufacturing, distribution, and retail facilities prior to beginning design work
![]() Seeing the show-room floor before developing the marketing materials
Seeing the show-room floor before developing the marketing materials
![]() Experiencing the product in action before designing the next generation
Experiencing the product in action before designing the next generation
![]() Spending time with customer service to better understand warranty issues and alternative customer product usage
Spending time with customer service to better understand warranty issues and alternative customer product usage
![]() Visiting your suppliers — and their suppliers — to understand capabilities and constraints
Visiting your suppliers — and their suppliers — to understand capabilities and constraints
Next time, before drawing premature conclusions based on hearsay, opinion, or even all that hard data, consider 3 Gen — go to the actual place, observe for yourself the actual product and gather actual facts. 3 Gen is sometimes translated at the 3 Actuals.
Losing connection with you ultimate customer can lead to costly mistakes and erroneous decision-making. You must understand what your customer is experiencing to stay in step or ahead of them.
 Sometime you will see words such as genbutsu written as gembutsu this is because when the Japanese characters are transliterated to English both gem- and gen- are correct.
Gemba walks
Gemba is where you go when you “go and observe.” Gemba is where the action is — the actual place where value is created for the customer. It is the kitchen in a restaurant, the operating room in a hospital, or a retail floor in a store. Gemba is where the real business occurs. If you don’t go to gemba, you’ll never truly understand your business or its issues.
The gemba walk is an observation tour. This is not a “run through that area, wave hello, and get back to your office” tour. The key is to observe and ask questions about things you notice. During a gemba walk, you may focus on a single selected item from the hoshin plan, like safety, housekeeping, performance, or customer satisfaction. For example, if quick changeovers are a priority, find out when setups will happen and go watch them. You may even be able to suggest additional improvements.
Though gemba walks aren’t scripted, you must have a main intention or a standardized framework. If the theme of the walk is safety, you’ll observe everything about safety, from employee actions to metric performance to the condition and location of safety equipment.
You may be wondering, “What do I do on a gemba walk?” Here’s a list:
![]() Build relationships with people in the organization, and break down barriers to change.
Build relationships with people in the organization, and break down barriers to change.
![]() Learn to observe your organization with “Lean” eyes. Initially, go on gemba walks with your Lean sensei (see Chapter 5) to learn what and how to observe.
Learn to observe your organization with “Lean” eyes. Initially, go on gemba walks with your Lean sensei (see Chapter 5) to learn what and how to observe.
![]() Train others to observe by conducting regular and frequent walks — as a staff and with individual staff members. Have individual staff members shadow you — it’s a powerful way of educating them.
Train others to observe by conducting regular and frequent walks — as a staff and with individual staff members. Have individual staff members shadow you — it’s a powerful way of educating them.
![]() Review performance metrics as tied to the hoshin plan.
Review performance metrics as tied to the hoshin plan.
![]() Review A3s, team performance charts, andon status, housekeeping, and display boards (see Chapter 12).
Review A3s, team performance charts, andon status, housekeeping, and display boards (see Chapter 12).
![]() Talk to people. Seek to understand what they do and what their issues are. They’re the experts at their job function, so ask about what you’re seeing. Most people love to talk about what they do.
Talk to people. Seek to understand what they do and what their issues are. They’re the experts at their job function, so ask about what you’re seeing. Most people love to talk about what they do.
![]() Whenever possible, help people make the connection between the global issues and strategy of the company with the issues of your gemba.
Whenever possible, help people make the connection between the global issues and strategy of the company with the issues of your gemba.
You can build rapport with your organization while you’re on a gemba walk. Listen to their issues and take action to help them out. Over time, you’ll earn their respect and build trust. Eventually, they’ll look for you during the walks to recommend improvements and give you feedback.
Housekeeping tours are a special form of a gemba walk, and a good way for managers to accomplish several goals:
![]() Stress the importance of a safe and orderly environment. (If you find safety issues, correct and contain them immediately. Follow up in future tours to make sure a permanent solution is implemented.)
Stress the importance of a safe and orderly environment. (If you find safety issues, correct and contain them immediately. Follow up in future tours to make sure a permanent solution is implemented.)
![]() Practice a form of standardized work.
Practice a form of standardized work.
![]() Connect with people across the organization.
Connect with people across the organization.
Management tours should cover the entire facility, inside and out. They should also follow a set process, including an established checklist of items to review, an agenda, and facility route (including restrooms and safety equipment). Nonconformities should be recorded and addressed. These items should be followed up on the next tour.
Management Information Tools
More and more tools and software are available to facilitate all manner of business process improvement, analysis, management, and controls. These tools are increasingly broad ranging and capable. Software poses a bit of a conundrum to the Lean practitioner, however, because software is inherently complex, and complexity is an anathema to Lean. Furthermore, you risk becoming captive to the tool, which is also a Lean no-no. However, a well-designed software program can be an effective tool for enabling your staff to perform both tactical and strategic tasks faster and more accurately, thereby reducing several forms of waste.
Per Lean doctrine, keep your computer and software application usage as standardized, streamlined and simple as possible. That may sound like an oxymoron, but you can contain the size, scope, and proliferation of your computer applications. Use them where they’re needed.
Lean process facilitation software
You can apply software to the practice of value-stream mapping and related Lean activities. Leading tools include enterprise-class tools like ARIS from Software AG (www.softwareag.com), and practitioner tools like iGrafx Flowcharter (www.igrafx.com). These tools also offer additional features, including process mapping, simulation, and some analytical capabilities.
The seven basic tools of quality addressed in Chapter 12, as well as the larger universe of statistical and analytical tools, are aptly facilitated by well-established providers. If you look in the Start menu of your PC, you’ll likely find one of them: Microsoft Excel (http://office.microsoft.com/excel), which performs most all of the basic statistical analysis functions for you. For more high-powered statistics and analysis, Minitab (www.minitab.com) is the king of desktop data analysis and statistics software. If you need more than basic statistics, such as regression analysis, analysis of variance (ANOVA), statistical process control (SPC), measurement systems analysis (MSA), design of experiments (DoE), reliability analysis, multivariate analysis, and non-parametrics, Minitab is the tool for you! Minitab also comes with a Quality Companion tool that performs process mapping, Fishbone diagrams, Failure Modes Effects Analysis (FMEA), value-stream map comparisons, and more.
Spider charts
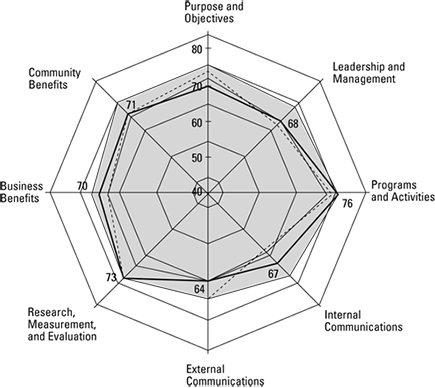
Spider charts, also known as radar charts, are popular Lean management tools. By plotting multiple performance measures radially, spider charts are effective at showing the performance of several performance characteristics in a single graph (see Figure 13-2).
Spider charts are popular Lean tools because they’re graphical, they’re visual, and they communicate information rapidly. With a spider chart, you can do things like:
![]() Graphically observe the performance of business metrics to a set goal.
Graphically observe the performance of business metrics to a set goal.
![]() Observe the relative value of different suppliers.
Observe the relative value of different suppliers.
![]() Make logical comparisons between competing strategies or approaches.
Make logical comparisons between competing strategies or approaches.
![]() Instantly see the strengths and weaknesses between alternatives.
Instantly see the strengths and weaknesses between alternatives.
Spider chart are easy. Follow this quick process:
1. Identify the information you want to compare.
2. Generate a list of approximately five to ten evaluation criteria.
3. Score the alternatives for each of the criteria.
4. Draw the chart and identify as many axis arms (spokes) as there are criteria.
5. Label the spoke arms of the chart — one arm for each criterion, and put hash marks on each spoke that represent counts.
6. Score a given alternative on each axis arm — and connect the dots with a straight line.
7. Repeat for each alternative. When you finish, it looks like a spider web.
Now observe the results and analyze the chart. What do you see? Look at the balance, the extremes, and the total area within each score. Spider charts are a powerful and revealing graphical management tool.
Don’t be surprised if you change your scoring over time. People often set high expectations or they learn that their initial evaluations were too generous. If your web is filling in, it is time to re-evaluate your criteria. Remember the goal is continuous improvement.
Figure 13-2: A spider chart.
Visualizing Processes
Managers create displays and dashboards to monitor key processes and track performance at nearly any level or location, as it is occurring. You must have transparency into processes and operations to see what’s happening and know what action is needed to maintain flow. Your management dashboards should be flexible and easily customized to provide anyone the view of what matters most to them — as well as what matters most to everyone else.
Management dashboards can be manually generated, but because the information is typically spread out over multiple locations and is available through information systems, dashboards are usually computer-generated. Automated dashboards can display everything from pie charts, maps, and histograms to run charts and control charts with upper and lower spec limits. Refer to Figure 13-3. Managers gain process intelligence through computerized visualization of key performance indicators, generated in real-time.
Figure 13-3: Process intelligence.
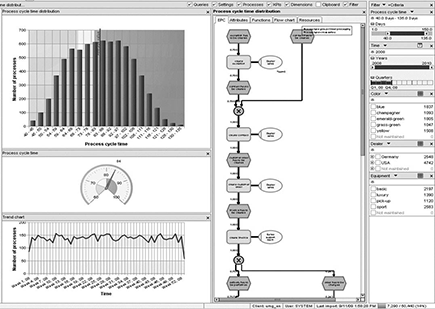
Courtesy of SoftwareAG.
In keeping with Lean, your dashboard should be simple to read and visual in presentation.
Management dashboards related performance-visualization tools are increasingly deployed broadly across all types of businesses and organizations, making objectives and metrics easier than ever to monitor, manage, and improve. This, in turn, enables kaizen and permits organizations to strive toward even higher performance goals. With these sophisticated visualization techniques, your business performance can become an upward spiral that enables your enterprise to strive for ever-higher performance goals.
Business Process Management software
One of the most powerful forces to emerge in the enterprise-level software world in the past decade is a suite of tools known as BPM — Business Process Management. BPM enables you to define processes that cross functional lines, integrating information from numerous systems like ERP, MRP, CRM, and others, and track processes through them as they perform.
BPM systems support process modeling, data capture, data analysis, visualization, and process control functions. They perform andon, enable the development and real-time display of management dashboards, and even build balanced scorecards. In short, BPM tools enhance the Lean enterprise.
Be sure you react properly to data. Single data points reflect instances; multiple points indicate trends. Improper point reaction can actually tamper with the system and cause waste. When you see data, go to gemba, see what is happening, gather facts, and determine appropriate reactions.
..................Content has been hidden....................
You can't read the all page of ebook, please click here login for view all page.