
Chapter 1
Grasping the Fundamentals of Big Data
In This Chapter
![]() Looking at a history of data management
Looking at a history of data management
![]() Understanding why big data matters to business
Understanding why big data matters to business
![]() Applying big data to business effectiveness
Applying big data to business effectiveness
![]() Defining the foundational elements of big data
Defining the foundational elements of big data
![]() Examining big data’s role in the future
Examining big data’s role in the future
Managing and analyzing data have always offered the greatest benefits and the greatest challenges for organizations of all sizes and across all industries. Businesses have long struggled with finding a pragmatic approach to capturing information about their customers, products, and services. When a company only had a handful of customers who all bought the same product in the same way, things were pretty straightforward and simple. But over time, companies and the markets they participate in have grown more complicated. To survive or gain a competitive advantage with customers, these companies added more product lines and diversified how they deliver their product. Data struggles are not limited to business. Research and development (R&D) organizations, for example, have struggled to get enough computing power to run sophisticated models or to process images and other sources of scientific data.
Indeed, we are dealing with a lot of complexity when it comes to data. Some data is structured and stored in a traditional relational database, while other data, including documents, customer service records, and even pictures and videos, is unstructured. Companies also have to consider new sources of data generated by machines such as sensors. Other new information sources are human generated, such as data from social media and the click-stream data generated from website interactions. In addition, the availability and adoption of newer, more powerful mobile devices, coupled with ubiquitous access to global networks will drive the creation of new sources for data.
Although each data source can be independently managed and searched, the challenge today is how companies can make sense of the intersection of all these different types of data. When you are dealing with so much information in so many different forms, it is impossible to think about data management in traditional ways. Although we have always had a lot of data, the difference today is that significantly more of it exists, and it varies in type and timeliness. Organizations are also finding more ways to make use of this information than ever before. Therefore, you have to think about managing data differently. That is the opportunity and challenge of big data. In this chapter, we provide you a context for what the evolution of the movement to big data is all about and what it means to your organization.
The Evolution of Data Management
It would be nice to think that each new innovation in data management is a fresh start and disconnected from the past. However, whether revolutionary or incremental, most new stages or waves of data management build on their predecessors. Although data management is typically viewed through a software lens, it actually has to be viewed from a holistic perspective. Data management has to include technology advances in hardware, storage, networking, and computing models such as virtualization and cloud computing. The convergence of emerging technologies and reduction in costs for everything from storage to compute cycles have transformed the data landscape and made new opportunities possible.
As all these technology factors converge, it is transforming the way we manage and leverage data. Big data is the latest trend to emerge because of these factors. So, what is big data and why is it so important? Later in the book, we provide a more comprehensive definition. To get you started, big data is defined as any kind of data source that has at least three shared characteristics:
![]() Extremely large Volumes of data
Extremely large Volumes of data
![]() Extremely high Velocity of data
Extremely high Velocity of data
![]() Extremely wide Variety of data
Extremely wide Variety of data
Big data is important because it enables organizations to gather, store, manage, and manipulate vast amounts data at the right speed, at the right time, to gain the right insights. But before we delve into the details of big data, it is important to look at the evolution of data management and how it has led to big data. Big data is not a stand-alone technology; rather, it is a combination of the last 50 years of technology evolution.
Organizations today are at a tipping point in data management. We have moved from the era where the technology was designed to support a specific business need, such as determining how many items were sold to how many customers, to a time when organizations have more data from more sources than ever before. All this data looks like a potential gold mine, but like a gold mine, you only have a little gold and lot more of everything else. The technology challenges are “How do you make sense of that data when you can’t easily recognize the patterns that are the most meaningful for your business decisions? How does your organization deal with massive amounts of data in a meaningful way?” Before we get into the options, we take a look at the evolution of data management and see how these waves are connected.
Understanding the Waves of Managing Data
Each data management wave is born out of the necessity to try and solve a specific type of data management problem. Each of these waves or phases evolved because of cause and effect. When a new technology solution came to market, it required the discovery of new approaches. When the relational database came to market, it needed a set of tools to allow managers to study the relationship between data elements. When companies started storing unstructured data, analysts needed new capabilities such as natural language–based analysis tools to gain insights that would be useful to business. If you were a search engine company leader, you began to realize that you had access to immense amounts of data that could be monetized. To gain value from that data required new innovative tools and approaches.
The data management waves over the past five decades have culminated in where we are today: the initiation of the big data era. So, to understand big data, you have to understand the underpinning of these previous waves. You also need to understand that as we move from one wave to another, we don’t throw away the tools and technology and practices that we have been using to address a different set of problems.
Wave 1: Creating manageable data structures
As computing moved into the commercial market in the late 1960s, data was stored in flat files that imposed no structure. When companies needed to get to a level of detailed understanding about customers, they had to apply brute-force methods, including very detailed programming models to create some value. Later in the 1970s, things changed with the invention of the relational data model and the relational database management system (RDBMS) that imposed structure and a method for improving performance. Most importantly, the relational model added a level of abstraction (the structured query language [SQL], report generators, and data management tools) so that it was easier for programmers to satisfy the growing business demands to extract value from data.
The relational model offered an ecosystem of tools from a large number of emerging software companies. It filled a growing need to help companies better organize their data and be able to compare transactions from one geography to another. In addition, it helped business managers who wanted to be able to examine information such as inventory and compare it to customer order information for decision-making purposes. But a problem emerged from this exploding demand for answers: Storing this growing volume of data was expensive and accessing it was slow. Making matters worse, lots of data duplication existed, and the actual business value of that data was hard to measure.
At this stage, an urgent need existed to find a new set of technologies to support the relational model. The Entity-Relationship (ER) model emerged, which added additional abstraction to increase the usability of the data. In this model, each item was defined independently of its use. Therefore, developers could create new relationships between data sources without complex programming. It was a huge advance at the time, and it enabled developers to push the boundaries of the technology and create more complex models requiring complex techniques for joining entities together. The market for relational databases exploded and remains vibrant today. It is especially important for transactional data management of highly structured data.
When the volume of data that organizations needed to manage grew out of control, the data warehouse provided a solution. The data warehouse enabled the IT organization to select a subset of the data being stored so that it would be easier for the business to try to gain insights. The data warehouse was intended to help companies deal with increasingly large amounts of structured data that they needed to be able to analyze by reducing the volume of the data to something smaller and more focused on a particular area of the business. It filled the need to separate operational decision support processing and decision support — for performance reasons. In addition, warehouses often store data from prior years for understanding organizational performance, identifying trends, and helping to expose patterns of behavior. It also provided an integrated source of information from across various data sources that could be used for analysis. Data warehouses were commercialized in the 1990s, and today, both content management systems and data warehouses are able to take advantage of improvements in scalability of hardware, virtualization technologies, and the ability to create integrated hardware and software systems, also known as appliances.
Sometimes these data warehouses themselves were too complex and large and didn’t offer the speed and agility that the business required. The answer was a further refinement of the data being managed through data marts. These data marts were focused on specific business issues and were much more streamlined and supported the business need for speedy queries than the more massive data warehouses. Like any wave of data management, the warehouse has evolved to support emerging technologies such as integrated systems and data appliances.
Data warehouses and data marts solved many problems for companies needing a consistent way to manage massive transactional data. But when it came to managing huge volumes of unstructured or semi-structured data, the warehouse was not able to evolve enough to meet changing demands. To complicate matters, data warehouses are typically fed in batch intervals, usually weekly or daily. This is fine for planning, financial reporting, and traditional marketing campaigns, but is too slow for increasingly real-time business and consumer environments.
How would companies be able to transform their traditional data management approaches to handle the expanding volume of unstructured data elements? The solution did not emerge overnight. As companies began to store unstructured data, vendors began to add capabilities such as BLOBs (binary large objects). In essence, an unstructured data element would be stored in a relational database as one contiguous chunk of data. This object could be labeled (that is, a customer inquiry) but you couldn’t see what was inside that object. Clearly, this wasn’t going to solve changing customer or business needs.
Enter the object database management system (ODBMS). The object database stored the BLOB as an addressable set of pieces so that we could see what was in there. Unlike the BLOB, which was an independent unit appended to a traditional relational database, the object database provided a unified approach for dealing with unstructured data. Object databases include a programming language and a structure for the data elements so that it is easier to manipulate various data objects without programming and complex joins. The object databases introduced a new level of innovation that helped lead to the second wave of data management.
Wave 2: Web and content management
It’s no secret that most data available in the world today is unstructured. Paradoxically, companies have focused their investments in the systems with structured data that were most closely associated with revenue: line-of-business transactional systems. Enterprise Content Management systems evolved in the 1980s to provide businesses with the capability to better manage unstructured data, mostly documents. In the 1990s with the rise of the web, organizations wanted to move beyond documents and store and manage web content, images, audio, and video.
The market evolved from a set of disconnected solutions to a more unified model that brought together these elements into a platform that incorporated business process management, version control, information recognition, text management, and collaboration. This new generation of systems added metadata (information about the organization and characteristics of the stored information). These solutions remain incredibly important for companies needing to manage all this data in a logical manner. But at the same time, a new generation of requirements has begun to emerge that drive us to the next wave. These new requirements have been driven, in large part, by a convergence of factors including the web, virtualization, and cloud computing. In this new wave, organizations are beginning to understand that they need to manage a new generation of data sources with an unprecedented amount and variety of data that needs to be processed at an unheard-of speed.
Wave 3: Managing big data
Is big data really new or is it an evolution in the data management journey? The answer is yes — it is actually both. As with other waves in data management, big data is built on top of the evolution of data management practices over the past five decades. What is new is that for the first time, the cost of computing cycles and storage has reached a tipping point. Why is this important? Only a few years ago, organizations typically would compromise by storing snapshots or subsets of important information because the cost of storage and processing limitations prohibited them from storing everything they wanted to analyze.
In many situations, this compromise worked fine. For example, a manufacturing company might have collected machine data every two minutes to determine the health of systems. However, there could be situations where the snapshot would not contain information about a new type of defect and that might go unnoticed for months.
With big data, it is now possible to virtualize data so that it can be stored efficiently and, utilizing cloud-based storage, more cost-effectively as well. In addition, improvements in network speed and reliability have removed other physical limitations of being able to manage massive amounts of data at an acceptable pace. Add to this the impact of changes in the price and sophistication of computer memory. With all these technology transitions, it is now possible to imagine ways that companies can leverage data that would have been inconceivable only five years ago.
But no technology transition happens in isolation; it happens when an important need exists that can be met by the availability and maturation of technology. Many of the technologies at the heart of big data, such as virtualization, parallel processing, distributed file systems, and in-memory databases, have been around for decades. Advanced analytics have also been around for decades, although they have not always been practical. Other technologies such as Hadoop and MapReduce have been on the scene for only a few years. This combination of technology advances can now address significant business problems. Businesses want to be able to gain insights and actionable results from many different kinds of data at the right speed — no matter how much data is involved.
If companies can analyze petabytes of data (equivalent to 20 million four-drawer file cabinets filled with text files or 13.3 years of HDTV content) with acceptable performance to discern patterns and anomalies, businesses can begin to make sense of data in new ways. The move to big data is not just about businesses. Science, research, and government activities have also helped to drive it forward. Just think about analyzing the human genome or dealing with all the astronomical data collected at observatories to advance our understanding of the world around us. Consider the amount of data the government collects in its antiterrorist activities as well, and you get the idea that big data is not just about business.
Different approaches to handling data exist based on whether it is data in motion or data at rest. Here’s a quick example of each. Data in motion would be used if a company is able to analyze the quality of its products during the manufacturing process to avoid costly errors. Data at rest would be used by a business analyst to better understand customers’ current buying patterns based on all aspects of the customer relationship, including sales, social media data, and customer service interactions.
Keep in mind that we are still at an early stage of leveraging huge volumes of data to gain a 360-degree view of the business and anticipate shifts and changes in customer expectations. The technologies required to get the answers the business needs are still isolated from each other. To get to the desired end state, the technologies from all three waves will have to come together. As you will see as you read this book, big data is not simply about one tool or one technology. It is about how all these technologies come together to give the right insights, at the right time, based on the right data — whether it is generated by people, machines, or the web.
Defining Big Data
Big data is not a single technology but a combination of old and new technologies that helps companies gain actionable insight. Therefore, big data is the capability to manage a huge volume of disparate data, at the right speed, and within the right time frame to allow real-time analysis and reaction. As we note earlier in this chapter, big data is typically broken down by three characteristics:
![]() Volume: How much data
Volume: How much data
![]() Velocity: How fast that data is processed
Velocity: How fast that data is processed
![]() Variety: The various types of data
Variety: The various types of data
 Although it’s convenient to simplify big data into the three Vs, it can be misleading and overly simplistic. For example, you may be managing a relatively small amount of very disparate, complex data or you may be processing a huge volume of very simple data. That simple data may be all structured or all unstructured. Even more important is the fourth V: veracity. How accurate is that data in predicting business value? Do the results of a big data analysis actually make sense?
It is critical that you don’t underestimate the task at hand. Data must be able to be verified based on both accuracy and context. An innovative business may want to be able to analyze massive amounts of data in real time to quickly assess the value of that customer and the potential to provide additional offers to that customer. It is necessary to identify the right amount and types of data that can be analyzed to impact business outcomes. Big data incorporates all data, including structured data and unstructured data from e-mail, social media, text streams, and more. This kind of data management requires that companies leverage both their structured and unstructured data.
Building a Successful Big Data Management Architecture
We have moved from an era where an organization could implement a database to meet a specific project need and be done. But as data has become the fuel of growth and innovation, it is more important than ever to have an underlying architecture to support growing requirements.
Beginning with capture, organize, integrate, analyze, and act
Before we delve into the architecture, it is important to take into account the functional requirements for big data. Figure 1-1 illustrates that data must first be captured, and then organized and integrated. After this phase is successfully implemented, data can be analyzed based on the problem being addressed. Finally, management takes action based on the outcome of that analysis. For example, Amazon.com might recommend a book based on a past purchase or a customer might receive a coupon for a discount for a future purchase of a related product to one that was just purchased.

Figure 1-1: The cycle of big data management.
Although this sounds straightforward, certain nuances of these functions are complicated. Validation is a particularly important issue. If your organization is combining data sources, it is critical that you have the ability to validate that these sources make sense when combined. Also, certain data sources may contain sensitive information, so you must implement sufficient levels of security and governance. We cover data management in more detail in Chapter 7.
Of course, any foray into big data first needs to start with the problem you’re trying to solve. That will dictate the kind of data that you need and what the architecture might look like.
Setting the architectural foundation
In addition to supporting the functional requirements, it is important to support the required performance. Your needs will depend on the nature of the analysis you are supporting. You will need the right amount of computational power and speed. While some of the analysis you will do will be performed in real time, you will inevitably be storing some amount of data as well. Your architecture also has to have the right amount of redundancy so that you are protected from unanticipated latency and downtime.
Your organization and its needs will determine how much attention you have to pay to these performance issues. So, start out by asking yourself the following questions:
![]() How much data will my organization need to manage today and in the future?
How much data will my organization need to manage today and in the future?
![]() How often will my organization need to manage data in real time or near real time?
How often will my organization need to manage data in real time or near real time?
![]() How much risk can my organization afford? Is my industry subject to strict security, compliance, and governance requirements?
How much risk can my organization afford? Is my industry subject to strict security, compliance, and governance requirements?
![]() How important is speed to my need to manage data?
How important is speed to my need to manage data?
![]() How certain or precise does the data need to be?
How certain or precise does the data need to be?
To understand big data, it helps to lay out the components of the architecture. A big data management architecture must include a variety of services that enable companies to make use of myriad data sources in a fast and effective manner. To help you make sense of this, we put the components into a diagram (see Figure 1-2) that will help you see what’s there and the relationship between the components. In the next section, we explain each component and describe how these components are related to each other.
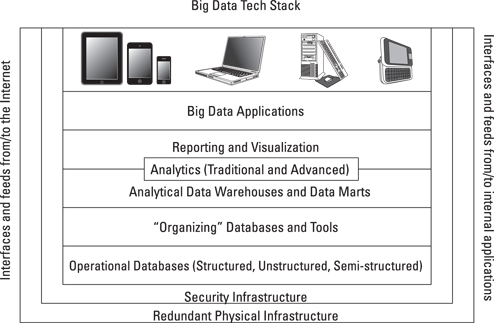
Figure 1-2: The big data architecture.
Interfaces and feeds
Before we get into the nitty-gritty of the big data technology stack itself, we’d like you to notice that on either side of the diagram are indications of interfaces and feeds into and out of both internally managed data and data feeds from external sources. To understand how big data works in the real world, it is important to start by understanding this necessity. In fact, what makes big data big is the fact that it relies on picking up lots of data from lots of sources. Therefore, open application programming interfaces (APIs) will be core to any big data architecture. In addition, keep in mind that interfaces exist at every level and between every layer of the stack. Without integration services, big data can’t happen.
Redundant physical infrastructure
The supporting physical infrastructure is fundamental to the operation and scalability of a big data architecture. In fact, without the availability of robust physical infrastructures, big data would probably not have emerged as such an important trend. To support an unanticipated or unpredictable volume of data, a physical infrastructure for big data has to be different than that for traditional data. The physical infrastructure is based on a distributed computing model. This means that data may be physically stored in many different locations and can be linked together through networks, the use of a distributed file system, and various big data analytic tools and applications.
Redundancy is important because we are dealing with so much data from so many different sources. Redundancy comes in many forms. If your company has created a private cloud, you will want to have redundancy built within the private environment so that it can scale out to support changing workloads. If your company wants to contain internal IT growth, it may use external cloud services to augment its internal resources. In some cases, this redundancy may come in the form of a Software as a Service (SaaS) offering that allows companies to do sophisticated data analysis as a service. The SaaS approach offers lower costs, quicker startup, and seamless evolution of the underlying technology.
Security infrastructure
The more important big data analysis becomes to companies, the more important it will be to secure that data. For example, if you are a healthcare company, you will probably want to use big data applications to determine changes in demographics or shifts in patient needs. This data about your constituents needs to be protected both to meet compliance requirements and to protect the patients’ privacy. You will need to take into account who is allowed to see the data and under what circumstances they are allowed to do so. You will need to be able to verify the identity of users as well as protect the identity of patients. These types of security requirements need to be part of the big data fabric from the outset and not an afterthought.
Operational data sources
When you think about big data, it is important to understand that you have to incorporate all the data sources that will give you a complete picture of your business and see how the data impacts the way you operate your business. Traditionally, an operational data source consisted of highly structured data managed by the line of business in a relational database. But as the world changes, it is important to understand that operational data now has to encompass a broader set of data sources, including unstructured sources such as customer and social media data in all its forms.
You find new emerging approaches to data management in the big data world, including document, graph, columnar, and geospatial database architectures. Collectively, these are referred to as NoSQL, or not only SQL, databases. In essence, you need to map the data architectures to the types of transactions. Doing so will help to ensure the right data is available when you need it. You also need data architectures that support complex unstructured content. You need to include both relational databases and nonrelational databases in your approach to harnessing big data. It is also necessary to include unstructured data sources, such as content management systems, so that you can get closer to that 360-degree business view.
All these operational data sources have several characteristics in common:
![]() They represent systems of record that keep track of the critical data required for real-time, day-to-day operation of the business.
They represent systems of record that keep track of the critical data required for real-time, day-to-day operation of the business.
![]() They are continually updated based on transactions happening within business units and from the web.
They are continually updated based on transactions happening within business units and from the web.
![]() For these sources to provide an accurate representation of the business, they must blend structured and unstructured data.
For these sources to provide an accurate representation of the business, they must blend structured and unstructured data.
![]() These systems also must be able to scale to support thousands of users on a consistent basis. These might include transactional e-commerce systems, customer relationship management systems, or call center applications.
These systems also must be able to scale to support thousands of users on a consistent basis. These might include transactional e-commerce systems, customer relationship management systems, or call center applications.
Performance matters
Your data architecture also needs to perform in concert with your organization’s supporting infrastructure. For example, you might be interested in running models to determine whether it is safe to drill for oil in an offshore area given real-time data of temperature, salinity, sediment resuspension, and a host of other biological, chemical, and physical properties of the water column. It might take days to run this model using a traditional server configuration. However, using a distributed computing model, what took days might now take minutes.
Performance might also determine the kind of database you would use. For example, in some situations, you may want to understand how two very distinct data elements are related. What is the relationship between buzz on a social network and the growth in sales? This is not the typical query you could ask of a structured, relational database. A graphing database might be a better choice, as it is specifically designed to separate the “nodes” or entities from its “properties” or the information that defines that entity, and the “edge” or relationship between nodes and properties. Using the right database will also improve performance. Typically the graph database will be used in scientific and technical applications.
Other important operational database approaches include columnar databases that store information efficiently in columns rather than rows. This approach leads to faster performance because input/output is extremely fast. When geographic data storage is part of the equation, a spatial database is optimized to store and query data based on how objects are related in space.
Organizing data services and tools
Not all the data that organizations use is operational. A growing amount of data comes from a variety of sources that aren’t quite as organized or straightforward, including data that comes from machines or sensors, and massive public and private data sources. In the past, most companies weren’t able to either capture or store this vast amount of data. It was simply too expensive or too overwhelming. Even if companies were able to capture the data, they did not have the tools to do anything about it. Very few tools could make sense of these vast amounts of data. The tools that did exist were complex to use and did not produce results in a reasonable time frame. In the end, those who really wanted to go to the enormous effort of analyzing this data were forced to work with snapshots of data. This has the undesirable effect of missing important events because they were not in a particular snapshot.
MapReduce, Hadoop, and Big Table
With the evolution of computing technology, it is now possible to manage immense volumes of data that previously could have only been handled by supercomputers at great expense. Prices of systems have dropped, and as a result, new techniques for distributed computing are mainstream. The real breakthrough in big data happened as companies like Yahoo!, Google, and Facebook came to the realization that they needed help in monetizing the massive amounts of data their offerings were creating.
These emerging companies needed to find new technologies that would allow them to store, access, and analyze huge amounts of data in near real time so that they could monetize the benefits of owning this much data about participants in their networks. Their resulting solutions are transforming the data management market. In particular, the innovations MapReduce, Hadoop, and Big Table proved to be the sparks that led to a new generation of data management. These technologies address one of the most fundamental problems — the capability to process massive amounts of data efficiently, cost-effectively, and in a timely fashion.
MapReduce
MapReduce was designed by Google as a way of efficiently executing a set of functions against a large amount of data in batch mode. The “map” component distributes the programming problem or tasks across a large number of systems and handles the placement of the tasks in a way that balances the load and manages recovery from failures. After the distributed computation is completed, another function called “reduce” aggregates all the elements back together to provide a result. An example of MapReduce usage would be to determine how many pages of a book are written in each of 50 different languages.
Big Table
Big Table was developed by Google to be a distributed storage system intended to manage highly scalable structured data. Data is organized into tables with rows and columns. Unlike a traditional relational database model, Big Table is a sparse, distributed, persistent multidimensional sorted map. It is intended to store huge volumes of data across commodity servers.
Hadoop
Hadoop is an Apache-managed software framework derived from MapReduce and Big Table. Hadoop allows applications based on MapReduce to run on large clusters of commodity hardware. The project is the foundation for the computing architecture supporting Yahoo!’s business. Hadoop is designed to parallelize data processing across computing nodes to speed computations and hide latency. Two major components of Hadoop exist: a massively scalable distributed file system that can support petabytes of data and a massively scalable MapReduce engine that computes results in batch.
Traditional and advanced analytics
What does your business now do with all the data in all its forms to try to make sense of it for the business? It requires many different approaches to analysis, depending on the problem being solved. Some analyses will use a traditional data warehouse, while other analyses will take advantage of advanced predictive analytics. Managing big data holistically requires many different approaches to help the business to successfully plan for the future.
Analytical data warehouses and data marts
After a company sorts through the massive amounts of data available, it is often pragmatic to take the subset of data that reveals patterns and put it into a form that’s available to the business. These warehouses and marts provide compression, multilevel partitioning, and a massively parallel processing architecture.
Big data analytics
The capability to manage and analyze petabytes of data enables companies to deal with clusters of information that could have an impact on the business. This requires analytical engines that can manage this highly distributed data and provide results that can be optimized to solve a business problem. Analytics can get quite complex with big data. For example, some organizations are using predictive models that couple structured and unstructured data together to predict fraud. Social media analytics, text analytics, and new kinds of analytics are being utilized by organizations looking to gain insight into big data. Big data analytics are described in more detail in Chapters 12, 13, and 14.
Reporting and visualization
Organizations have always relied on the capability to create reports to give them an understanding of what the data tells them about everything from monthly sales figures to projections of growth. Big data changes the way that data is managed and used. If a company can collect, manage, and analyze enough data, it can use a new generation of tools to help management truly understand the impact not just of a collection of data elements but also how these data elements offer context based on the business problem being addressed. With big data, reporting and data visualization become tools for looking at the context of how data is related and the impact of those relationships on the future.
Big data applications
Traditionally, the business expected that data would be used to answer questions about what to do and when to do it. Data was often integrated as fields into general-purpose business applications. With the advent of big data, this is changing. Now, we are seeing the development of applications that are designed specifically to take advantage of the unique characteristics of big data.
Some of the emerging applications are in areas such as healthcare, manufacturing management, traffic management, and so on. What do all these big data applications have in common? They rely on huge volumes, velocities, and varieties of data to transform the behavior of a market. In healthcare, a big data application might be able to monitor premature infants to determine when data indicates when intervention is needed. In manufacturing, a big data application can be used to prevent a machine from shutting down during a production run. A big data traffic management application can reduce the number of traffic jams on busy city highways to decrease accidents, save fuel, and reduce pollution.
The Big Data Journey
Companies have always had to deal with lots of data in lots of forms. The change that big data brings is what you can do with that information. If you have the right technology in place, you can use big data to anticipate and solve business problems and react to opportunities. With big data, you can analyze data patterns to change everything, from the way you manage cities, prevent failures, conduct experiments, manage traffic, improve customer satisfaction, or enhance product quality, just to name a few examples. The emerging technologies and tools that are the heart of this book can help you understand and unleash the tremendous power of big data, changing the world as we know it.