Part V
More Project Checklists
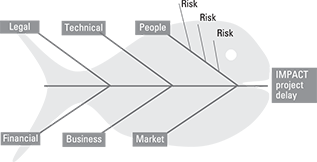
The Ishikawa (or Fishbone) Diagram is a cause and effect model. It works really well for risk management though. You put the risk impact, such as overspending, as the effect and then analyse each of your chosen risk categories as shown on the primary bones. You write in the risks in that category as the secondary bones. This technique works really well in a risk workshop.
In this part …
- Find out how to take over someone else’s project with minimum disruption.
- Get to grips with project audit.
- Understand common and powerful project techniques to save you time and make your life a whole lot easier.
..................Content has been hidden....................
You can't read the all page of ebook, please click here login for view all page.