6 Exemplary Models of Programs and Illustrations for Professional Learning in Reliability Prediction and Accelerated Reliability Testing
Lev M. Klyatis
For use in engineering education and training courses, seminars, lectures, tutorials, workshops, and so on.
6.1 Examples of the Program
6.1.1 Example 1. Several Days' Course: “Successful Prediction of Product Reliability and Necessary Testing”
Will provide the foundation for designing and using this problem solution.
Course participants will learn:
First and second days: “Methodological Aspects of Reliability Prediction”
- Reliability understanding and measuring
- Impact of reliability on profits.
- How reliability influence on life‐cycle cost.
- Reduction in life‐cycle time and cost.
- Design FMEA.
- Misapplications of FMEA.
- Fault tree analysis (FTA).
- Conducting design reviews.
- Reliability as one from interacted component of product performance.
- Analysis of current situation with reliability of the products and the basic causes of this situation.
- Why reliability prediction is often inaccurate
- Analysis of current situation with using different methodological approaches of reliability prediction—their positive and negative aspects.
- Terms and definitions of reliability prediction.
- New advanced methodological approach for successful reliability prediction.
- The strategy of successful prediction for industry.
- Preparation of recommendations for design improvement.
- Growth of reliability through ART.
- Controlling warranty costs.
- Implementation of successful reliability prediction.
- List of benefits, requirements, and objectives of methodological aspects of successful reliability prediction
Following days: “Accelerated Reliability and Durability Testing as Source for Obtaining Initial Information for Successful Reliability Prediction”
- Choose accelerated testing method for a given application.
- Adjust accelerated testing programs for business situations.
- Description of how product development cycles can be reduced in time.
- Analysis of current situation in methodology for accelerated field and laboratory testing.
- Analysis of current situation in equipment market for accelerated testing.
- Why the above methodology and equipment cannot offer accurate information for improving reliability prediction.
- Terms and definitions of reliability and durability testing.
- Explain the steps and methodology used to conduct of ART/ADT.
- How and why accelerated reliability and durability testing can help to solve the problem improved prediction of product reliability.
- How to utilize existing test equipment.
- Demonstrate the application of a variety of tools utilized for ART/ADT.
- How to prepare requirements to design equipment for ART/ADT.
- Implementation solution of reliability testing.
- Economic benefits from improved reliability usage.
6.1.2 Example 2. One‐Day Course “Methodology of Reliability Prediction”
Will provide the methodological foundation for designing and usage reliability prediction program to achieve high reliability during given time. Seminar participants will learn:
- Why current situation with reliability prediction is often unsuccessful for practice.
- Why this situation has continued for many years (with analysis of publications).
- Terms and definitions of reliability prediction.
- How reliability prediction methodology can be improved.
- Basic components of improved reliability prediction.
- Examples with using improved reliability prediction methodology.
6.1.3 Example 3. One–Two Days' Course (or tutorial) “Accelerated Reliability and Durability Testing Technology as Source of Obtaining Information for Successful Reliability Prediction”
- Current situation with reliability and durability testing.
- Accelerated aging—positive and negative aspects.
- Highly accelerated life testing (HALT) and highly accelerated stress screening (HASS). Their advantages and disadvantages.
- The role of real world simulation in level of testing.
- The basis of accurate real world simulation.
- Key terms and definition of accelerated reliability and durability testing (ART/ADT).
- Accelerated reliability and durability testing (ART/ADT) as a key factor for improvement reliability prediction.
- Basic specifics and concepts of ART/ADT.
- Equipment for ART/ADT.
- Benefits on ART/ADT.
- Reliability testing standardization.
6.1.4 Example 4. One–Two Days' Seminar “Foundation for Designing Successful Accelerated Testing”
Will provide the foundation for designing a successful accelerated testing (AT) program so as to achieve high reliability in existing products and future designs. Seminar participants will learn:
- Why current technique and equipment for AT give no more than 20–30% of possible benefits.
- Why the simulation of real‐life influences is usually not accurate for a high level of correlation between AT results and field results.
- How one can obtain maximum correlation between AT results and field results.
- How engineers and managers can find and eliminate causes for failures and degradation of product quickly and at lower costs.
- Why the quality of published literature often is not enough to turn practical engineers and managers to the way with minimum benefits.
Course participants will also learn to apply AT to:
- Shorten product time to the market.
- Reduce design and product development cycle time, warranty costs, and minimize customer returns.
AT is applicable to mechanical, electro‐mechanical, electronic, hydraulic and other devices used in automotive, railroad, aerospace, marine, and other areas of industry.
Benefits of Attending
By completing this seminar, professionals will know:
- How to implement advanced and less expensive techniques to increase the product warranty period.
- Participants will be informed what advanced literature they could use for improvement of their knowledge in accelerated testing.
Seminar Basic Content
- Failure modes & effect analysis (FMEA) basics (introduction & overview, definition, general discussion, performing a design FMEA & Process FMEA, criticality/risk analysis).
- Fault tree analysis as a supportive tool.
- Introduction to successful AT.
- The strategy for creating successful AT.
- Physical simulation of real‐life input influences on the product.
- Technology of step‐by step AT.
- Conditions for accelerated multiple environmental testing.
- Accelerated corrosion testing with accurate simulation of field conditions.
- Vibration testing with accurate simulation of field conditions.
Who Should Attend?
Corporate executives, test engineers and managers, design engineers and technicians, reliability engineers and managers, supervisors, quality assurance managers, quality control engineers and managers, manufacturing engineers, and others.
6.2 Illustrations for these and Other Programs in Reliability Prediction and Testing
The following illustrations for the learning courses have to be prepared in slides (PowerPoint or similar software).
6.2.1 Examples: Text for the Slides
- It is a known fact that in 2009–2010 Toyota's global recall jumped to 9 million cars and trucks, later recalls could average around 3–5 million annually.
- A similar situation could happen with other automakers, as well as with companies in other areas of industry.
- The basic reason is the inaccurate prediction of the product's reliability during design and manufacturing.
- Prediction is inaccurate, because accelerated reliability and durability testing, as source of initial information for this prediction, is not properly used.
- Below is described how one can solve this problem.
Commonly, the situation in reliability is reflecting in recalls, because: there is official information about recalls from Government and other organizations and companies.
- In automotive industry current situation can be expressed as “ Auto Recalls Accelerate. ”
- The US Federal Government (NHTSA) said *In 2011 automakers recalled more US vehicles last year than in any of the last six years.” and
- “Recalls affected 20.3 million vehicles, the highest number since 2004” (2009, 15.2 million).
In the field reliability of equipment for the military area are several times lower than was predicted after testing during design and manufacturing.
*SAE International G‐11 RMSL Division Spring 2004 Meeting.
- Use examples with newest information from NHTSA (National Highway Safety Traffic Administration, DoT or other publications).
- Honda – ?.? million vehicles.
- Toyota – ?.? million.
- Ford – ?.? million.
- Other – ?? million.
*a. Source…
b. The companies could be changed.
- HIGHER COST
- LOWER SAFETY
- LOST TIME
than predicted during design & manufacturing.
YEARLY FATALITIES AND FATALITY RATE (NHTSA): (deaths: 2010, 33,186; 2011, 32,310), (other years).
Figure 6.7 One from final result of inaccurate prediction is.
Efforts of the industrial companies for reducing recalls and life‐cycle cost, increasing quality, reliability, safety, durability, maintainability, and others.
- What are the causes?
- Present approaches do not offer the possibility for successful solution to the above problems.
Using:
- Engineering technology (design, technology, quality control, etc.) analysis
- Physical analysis
- Chemical analysis
- Statistical analysis
Figure 6.9 Ways for finding the causes for complaints and recalls.
Phillip Coyle, the former director of the Operational Test and Evaluation Office (Pentagon) said that:
- if during the design and manufacturing complicated apparatus such as satellite, one tries to save a few pennies in testing ,
- the end results may be a huge loss of thousands of dollars due to faulty products which have to be replaced, because of this mistake.
Figure 6.10 Example: results of saving expenses for testing during design and manufacturing.
The reliability function of distribution after ART is F A(x), in the field is F 0(x).
The measure of their difference is

for 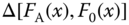 given limitation is ΔA.
If 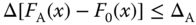
it is possible to determine the reliability of ART results.
But if 
it is not recommended.
Figure 6.11 Statistical criteria for comparison the reliability in results of accelerated reliability testing (ART) and field testing.
If one doesn't know the functions F A(x) and F 0(x) (often in practice) one can construct the graphs of the experiment data F A(x) and F 0(x) and determine
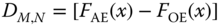
where
F OE and F AE
are empirical distributions of the reliability function as result of the machinery testing under operating conditions and by ART/ADT.
One needs to calculate the accumulated parameter's function and the values of the confidence coefficient found in the equations:

And evaluate the curves that are limited to the upper and lower confidence areas, where  is the probability that based on an event will be in n independent experiments m times. The values of Y are found in the tables of books on the theory of probability if the confidence coefficient is

Figure 6.13 Comparison parameter's function with predetermined accuracy and confidence area.
More stress means greater acceleration and lower correlation of accelerated testing results with field results


6.2.2 Examples of Figures

Figure 6.29 Four basic steps for successful reliability prediction.
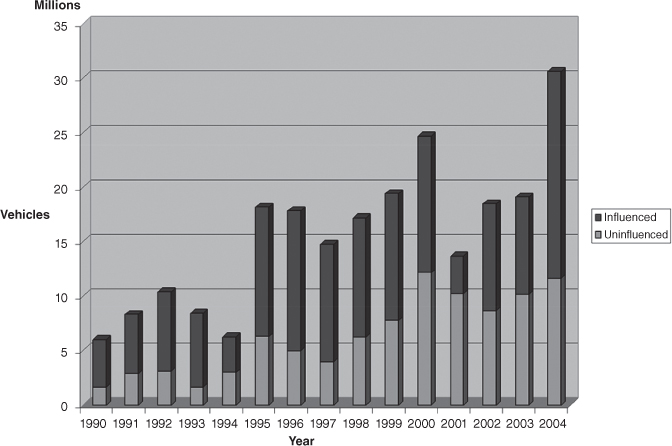
Figure 6.30 Recalls of automobiles from 1990 to 2004 (millions) in the American market.
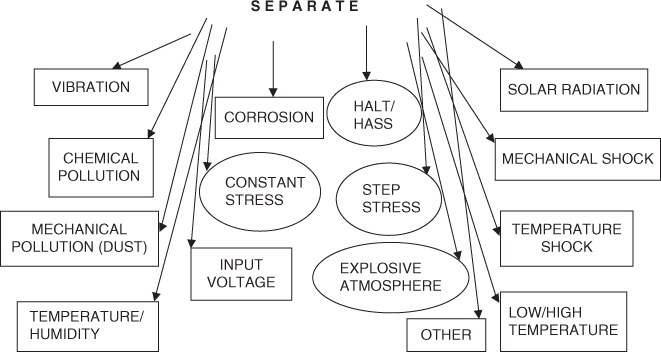
Figure 6.31 Examples of separate types of practical simulation and stress testing during design and manufacturing. This is low effective way.

Figure 6.32 Basic reasons why accelerated stress testing cannot help to accurately predict reliability and durability.


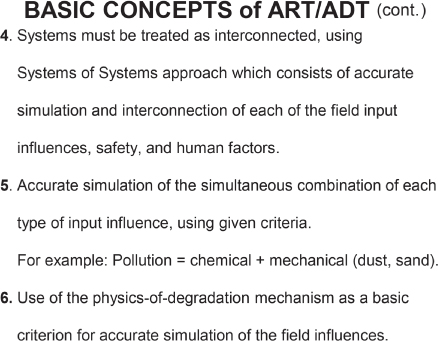
Figure 6.35 Example of interacted (simultaneous combination) of the real‐world input influences on the product.

Figure 6.36 The way from actual field input influences to failures (or degradation only).

Figure 6.37 Example: The types and parameters of the degradation mechanisms.


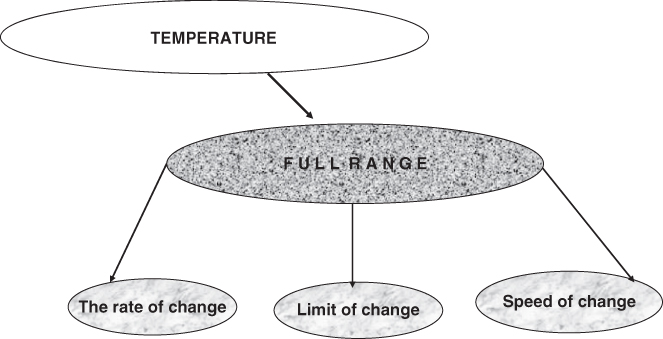
Figure 6.40 Scheme of study the temperature as an example of accurate simulation input influences.
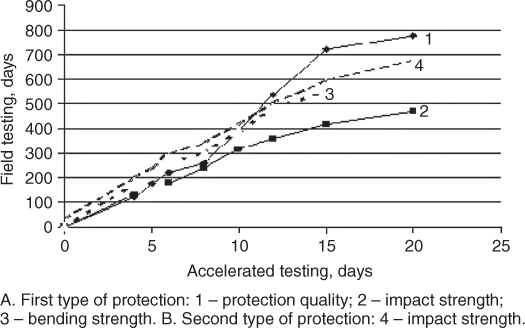
Figure 6.41 Accelerated destruction of paint protection in test chamber (two types of paint).

Figure 6.42 Dependence of steel corrosion values on the number of wettings in test chamber.

Figure 6.43 Vibration in test certification process in aircraft. The 190 Aircraft and vibration equipment.
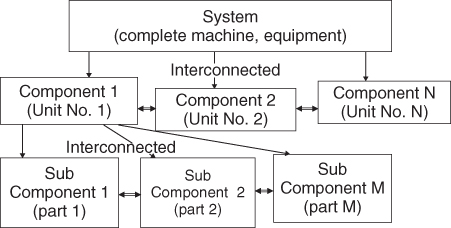
Figure 6.44 The system (test subject) as complex of interconnected components (units and details).
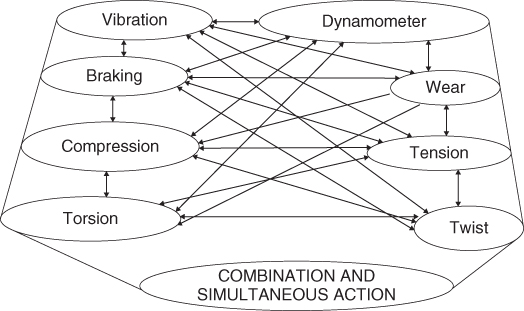

Figure 6.46 Technology vibration of mobile product in the field.

Figure 6.47 Stages of basic vibration testing equipment development.

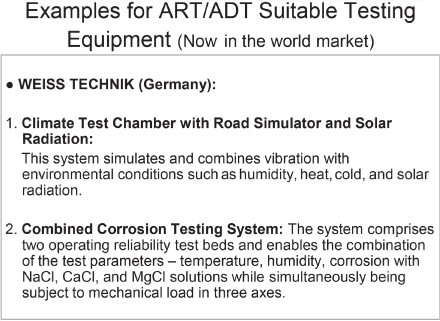
Figure 6.48 Climate test chamber with four‐wheel‐drive dynamometer with sunlight simulation (Weiss Technik).

Figure 6.49 Cold‐head climate test chamber with road simulator and sunlight simulator (Weiss Technik).

Figure 6.50 Combined testing system: vibration, climate, and corrosion (Weiss Technik).

Figure 6.51 Combined test chamber for electronic devices. Simulates vibration, temperature, input voltage, and humidity.


Figure 6.54 Normalized correlation and power spectrum of frame tension data for the car's trailer in different field conditions and in the chamber.

Figure 6.55 Deformation of metallic sample during the time in the field and during ART/ADT.

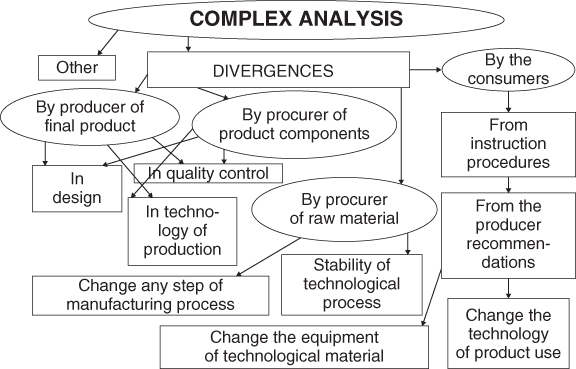
Figure 6.57 Scheme of complex analysis of factors that influence product reliability/quality.