
Chapter 13
Copying Existing Drawings from Other Sources
This chapter discusses ways to import existing drawings into the AutoCAD® 2019 software through tracing, scaling, and scanning. At times, you'll want to turn an existing drawing into an AutoCAD drawing file. The original drawing may be hand drawn, or it might be a PDF from another source. You may be modifying a design that someone else created or converting your library of older, hand‐drafted drawings for AutoCAD use. Perhaps you want to convert a hand‐drawn sketch into a formal drawing. In addition to importing drawings, you'll learn how to incorporate drawings in Portable Document Format (PDF) into your AutoCAD work.
Methods for Converting Paper Drawings to AutoCAD Files
Tracing with a special piece of hardware known as a digitizing tablet used to be the only way to enter a hand‐drafted drawing into AutoCAD. However, a traced drawing usually requires some cleanup and reorganization.
Scaling a drawing is the method of taking measurements directly from a paper drawing using an architect's or engineer's scale. It is the most flexible method because you don't need special peripherals to do it and, generally, you're faced with fewer cleanups afterward. Scaling also facilitates the most accurate input of orthogonal lines because you can read dimensions directly from the drawing and enter them into AutoCAD. The main drawback with scaling is that if the hand‐drafted drawing does not contain written dimensions, it will be difficult to produce an accurate copy. In addition, you must constantly look at the hand‐drafted drawing and measure distances with a scale, and irregular curves are difficult to scale accurately.
Programs are available that automatically convert an image file into an AutoCAD drawing file consisting of lines and arcs. These programs may offer some help, but they require some editing and checking for errors.
Scanning, much like tracing, is best used for drawings that are difficult to scale, such as complex topographical maps containing a large number of contours or nontechnical line art, such as letterhead and logos.
The simplest method for converting paper drawings, and the method we show you in this chapter, is to scan your drawings as image files to be used as a background in AutoCAD. You can import your image files into AutoCAD and then trace directly over them. This technique allows you to see the original drawing in the AutoCAD window, removing the need to refer constantly to documents in other programs.
Importing a Raster Image
If you have a scanner and you'd like to use it to import drawings and other images into AutoCAD, you can take advantage of the program's ability to import raster images. There are many reasons you may want to import a scanned image. In architectural plans, a vicinity map is frequently used to show the location of a project. With the permission of its creator, you can scan a map into AutoCAD and incorporate it into a cover sheet. That cover sheet can also contain other images, such as photographs of the site, computer renderings and elevations of the project, and company logos. In architectural projects, scans of older drawings can be used as backgrounds for renovation work. This can be especially useful for historical buildings where the building's owner wishes to keep the original architectural detail.
Another reason for importing a scanned image is to use the image as a reference over which to trace. You can trace a drawing with a good deal of accuracy by using a scanned image. A scanner can be a cost‐effective tool for tracing a wide variety of graphic material, or you can use your smartphone camera to photograph a drawing. In this section, you'll learn how you can import an image as a background for tracing:
- Using the
acad.dwt(acadiso.dwt) template, create a new file calledRastertrace.dwgand switch off the background grid. - Click the External References tool on the Insert tab's Reference panel (see Figure 13.1) to open the External References palette, which lets you import a full range of raster image files.
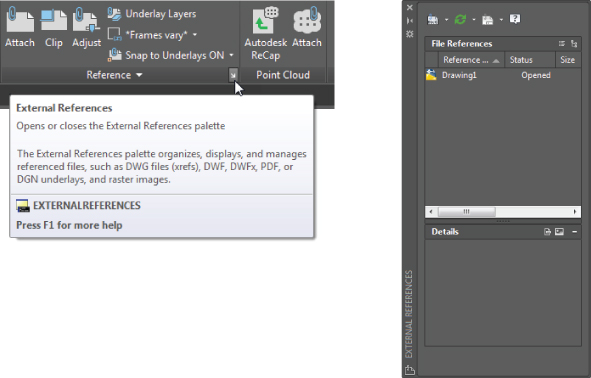
FIGURE 13.1 The External References palette allows you to import raster images
You can also type XR↵. This palette should look familiar from Chapter 7, “Mastering Viewing Tools, Hatches, and External References.” It's the same palette that you used to manage external references. Just like external references (Xrefs), raster images are loaded when the current file is open but they aren't stored as part of the current file when it is saved. This helps keep file sizes down, but it also means that you need to keep track of inserted raster files. You must make sure that they're kept together with the AutoCAD files in which they're inserted. For example, you might want to keep image files in the same folder as the drawing file to which they're attached.
AutoCAD has a utility called eTransmit that collects AutoCAD files and their related support files, such as raster images, external references, and fonts, into any folder or drive that you specify. See Chapter 25, “Managing and Sharing Your Drawings,” for details.
Another similarity between Xrefs and imported raster images is that you can clip a raster image so that only a portion of the image is displayed in your drawing. Portions of a raster file that are clipped aren't stored in memory, so your system won't get bogged down even if the raster file is huge.
The following exercises gives you step‐by‐step instructions for importing a raster file. It also lets you see how scanned resolution translates into an image in AutoCAD. This is important if you're interested in scanning drawings for the purpose of tracing over them.
First, you need to set up your drawing for scale and size. If you are using Imperial units, set up the Rastertrace.dwg file as an architectural drawing with a 1/4″ = 1′ scale on an 8‐1/2″ × 11″ sheet of paper. Metric users should set up their drawing at a 1:50 scale on an A4 Size sheet. Here are the steps:
- If you use Imperial units, set the Limits settings to 0,0 for the lower‐left corner and 528,408 for the upper‐right corner. The Limits settings for metric users should be 0,0 for the lower‐left corner and 1480,1050 for the upper‐right corner.
- Make sure that the drawing units type is set to Architectural and the insertion scale is set to inches. Metric users should set up their drawing at a 1:50 scale on an A4 size sheet and set the insertion scale to centimeters.
Now you're ready to import the raster file. Do the following:
 Choose Zoom All from the Zoom flyout on the Navigation bar or type Z↵A↵ to make sure that the entire area of the drawing limits is displayed on the screen. Ensure that the grid is switched off.
- Draw a line across the screen from coordinates 0,20′ to 64′,20′. Metric users should draw the line from 0,600 to 1820,600. Remember that if Dynamic Input is turned on (it's on by default), you need to use the # sign in front of the second coordinate to indicate absolute coordinates. You'll use this line in a later exercise.
- Click the line that you just drew, and then select Red from the Object Color drop‐down list in the Home tab's Properties panel. This helps make the line more visible. If you have the Quick Properties feature turned on, you can select the color from the Quick Properties panel.
 If you haven't done so already, click the External References tool in the title bar of the Insert tab's Reference panel to open the External References palette.
 On the External References palette's menu bar, click the arrowhead next to the Attach DWG tool and then choose Attach Image from the flyout.
In the Select Reference File dialog box, locate and select the
raster1.jpgproject file. You can see a preview of the file on the right side of the dialog box.- Click Open to open the Attach Image dialog box (see Figure 13.2).
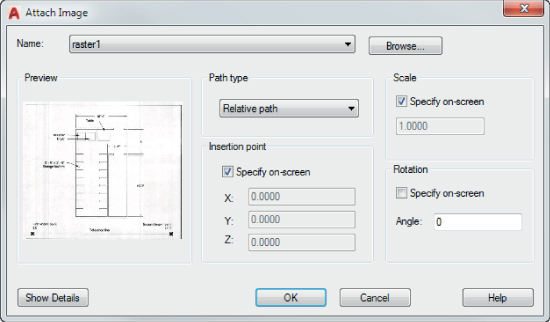
FIGURE 13.2 The Attach Image dialog box
- Uncheck the Specify On‐Screen option in the Insertion Point group to accept the 0,0,0 coordinates.
- Click OK, and then, at the
Specify scale factor <1>:prompt, use the cursor to scale the image so that it fills about half of the screen, as shown in Figure 13.3. Theraster1.jpgfilename appears in the External References palette.
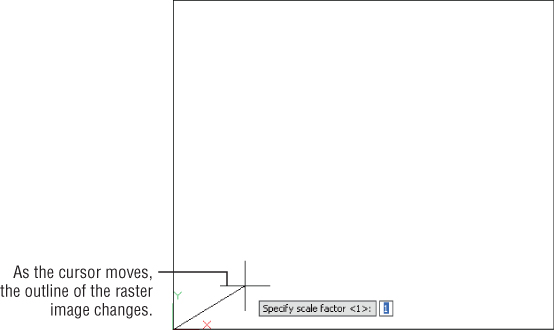
FIGURE 13.3 Manually scaling the raster image
Working with a Raster Image
Once you've imported a raster image, you can begin to work with it in a variety of ways. You can resize the image to suit your needs and even adjust its size to a particular scale. Raster images can be made to overlap AutoCAD objects, or you can have raster images appear in the background. There are also rudimentary controls for brightness, contrast, and transparency. In the following sections, you'll continue to use the image that you attached to your drawing to explore some of these options.
Scaling a Raster Image
The raster1.jpg file was scanned as a grayscale image at 100 dpi. This shows that you can get a reasonable amount of detail at a fairly low scan resolution.
Now suppose that you want to trace over this image to start an AutoCAD drawing. The first thing that you should do is scale the image to the appropriate size. You can scale an image file to full size. Try the following steps to see how you can begin the process:
- Choose Zoom Extents from the Zoom flyout on the Navigation bar, or type Z↵E↵. You may also want to pan the view or move the Xref palette to get a clear view of the drawing.
 Turn on Polar Tracking or Ortho mode, and then click Scale on the Home tab's Modify panel.
- Click the edge of the raster image to select it.
- Press ↵ to finish your selection.
- At the
Specify base point:prompt, click the X in the lower‐left corner of the image. - At the
Specify scale factor or [Copy/Reference]:prompt, enter R↵ to use the Reference option. - At the
Specify reference length <0′ ‐1″>:prompt, type @↵. This tells AutoCAD that you want to use the last point selected as one end of the reference length. After you enter the @ symbol, you'll see a rubber‐banding line emanating from the X. - At the
Specify second point:prompt, click the X at the lower‐right corner of the image. - At the
Specify new length or [Points] <0′‐1″>:prompt, enter 44′↵. Metric users should enter 1341↵. The image enlarges. Remember that this reference line is 44′, or 1341 cm, in length.
The image is now scaled properly for the plan it portrays. You can proceed to trace over the image. You can also place the image on its own layer and turn it off from time to time to check your trace work. Even if you don't trace the scanned floor plan line for line, you can read the dimensions of the plan from your computer monitor instead of having to go back and forth between measuring the paper image and drawing the plan on the computer.
Controlling Object Visibility and Overlap with Raster Images
With the introduction of raster image support, AutoCAD inherited a problem that's fairly common to programs that use such images: Raster images obscure other objects that were placed previously. The image you imported in the previous exercise, for example, obscures the line you drew when you first opened the file. In most cases, this overlap isn't a problem. However, in some situations, you'll want AutoCAD vector objects to overlap an imported raster image. An example is a civil‐engineering drawing showing an AutoCAD drawing of a new road superimposed over an aerial view of the location for the road.
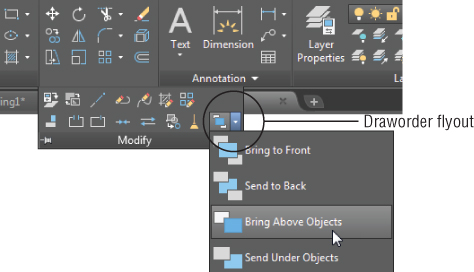
Paint and page‐layout programs usually offer a “to front/to back” tool to control the overlap of objects and images. AutoCAD offers the Draworder command. Here's how it works:
- Click Zoom Extents on the Navigation bar or type Z↵E↵ to get an overall view of the image.
- Choose the Bring Above Objects tool from the Draworder flyout on the Home tab's expanded Modify panel.
- At the
Select objects:prompt, select the horizontal line that you drew when you first opened the file. - If there are other objects in the drawing that you want to “bring above objects,” you can select them as well. Press ↵ to finish your selection.
- At the
Select reference objects:prompt, click the edge of the raster image of the utility room and then press ↵.
The drawing regenerates, and the entire line appears, no longer obscured by the raster image.
The Draworder tool that you just used has nine options in the Draworder flyout on the Home tab's Modify panel:
- Bring To Front Places an object or a set of objects at the top of the draw order for the entire drawing. The effect is that the objects are completely visible.
- Send To Back Places an object or a set of objects at the bottom of the draw order for the entire drawing. The effect is that other objects in the drawing may obscure those objects.
- Bring Above Objects Places an object or a set of objects above another object in the draw order. This has the effect of making the first set of objects appear above the second selected object.
- Send Under Objects Places an object or a set of objects below another object in the draw order. This has the effect of making the first set of objects appear underneath the second selected object.
- Bring Text To Front Automatically places all text in a drawing in front of all objects.
- Bring Dimensions To Front Automatically places all dimensions in a drawing in front of all objects.
- Bring Leaders To Front Automatically places all dimension leaders in a drawing in front of all objects.
- Bring All Annotations To Front Automatically places all annotation objects in a drawing, including dimensions, in front of all objects.
- Send Hatches To Back Automatically sends all hatch patterns in a drawing behind other objects.
You can also use the DR keyboard shortcut to issue the Draworder command. If you do this, you see these prompts:
Select objects:Enter object ordering option [Above objects/Under objects/Front/Back]<Back>:
After selecting an object or set of objects at the Select Objects: prompt, press ↵. You must then select the option by typing the capitalized letter of the option.
Although this section discussed the Draworder tools in relation to raster images, they can also be invaluable in controlling visibility of line work in conjunction with hatch patterns and solid fills. See Chapter 7 for a detailed discussion of the Draworder tools and hatch patterns.
Adjusting Brightness, Contrast, and Fade
AutoCAD offers a tool that enables you to adjust the brightness, contrast, and fade of a raster image. Try making some adjustments to the raster image of the utility room in the following exercise:
- Click the edge of the raster image. The Image tab appears in the Ribbon (see Figure 13.4).
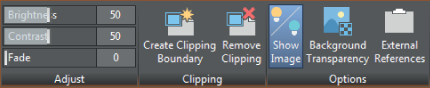
FIGURE 13.4 The Image tab appears when you select a raster image
- In the Adjust panel of the Image tab, click and drag the Fade slider to the right so that it's near the middle of the slider scale, or enter 50 in the Fade box to the right of the slider. The sample image fades to the AutoCAD background color as you move the slider.
- Press the Esc key to unselect the raster image. The Image tab closes.
- Save the file as
Rasterimport.dwg.
You can adjust the brightness and contrast by using the other two sliders in the Adjust panel of the Image tab.
By using the Image tab in conjunction with image clipping, you can create special effects. Figure 13.5 shows an aerial view of downtown San Francisco with labels. This view consists of two copies of the same raster image. One copy serves as a background, which was lightened using the method demonstrated in the previous exercise. The second copy is the darker area of the image with a roughly triangular clip boundary applied. You might use this technique to bring focus to a particular area of a drawing that you're preparing for a presentation.
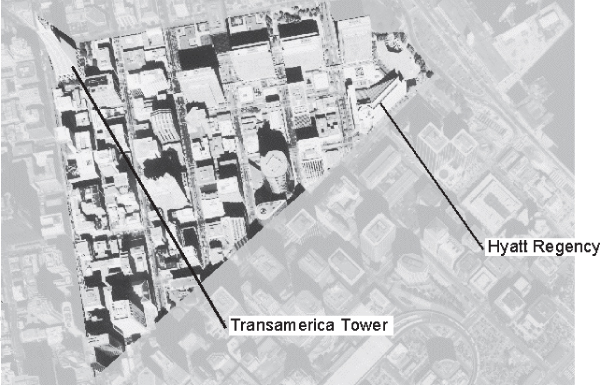
FIGURE 13.5 Two copies of the same image can be combined to emphasize a portion of the drawing
If the draw order of objects is incorrect after you open a file or perform a Pan or Zoom, issue a Regen to recover the correct draw‐order view.
In addition to the tools in the Adjust panel, there are several tools in the Image tab that can be used to modify raster images. Table 13.1 gives you a rundown of their function.
TABLE 13.1: The tools on the Image tab
| Tool | Function |
| Brightness | Adjusts the brightness of an image. |
| Contrast | Adjusts the contrast of an image. |
| Fade | Adjusts the fade value of an image. |
| Create Clipping Boundary | Allows you to create a clipping boundary. This tools works just like the Clip tool. |
| Remove Clipping | Removes a clipping boundary. |
| Show Image | Toggles an image on and off. |
| Background Transparency | Toggles the transparency of an image on and off. |
| External References | Opens the External References palette. |
Clipping a Raster Image
In Chapter 7, you saw how you could clip an external reference object so that only a portion of it appears in the drawing. You can clip imported raster images in the same way. Just as with Xrefs, you can create a closed outline of the area that you want to clip, or you can specify a simple rectangular area.
In the following exercise, you'll try the Clip command to control the display of the raster image:
- Select the Clip tool from the Insert tab's Reference panel, or type Clip↵.
- At the
Select object to clip:prompt, click the edge of the raster image. - At the
Enter image clipping option [ON/OFF/Delete/New boundary]<New>:prompt, press ↵ to create a new boundary. - At the
[Select polyline/Polygonal/Rectangular/Invert clip] <Rectangular>:prompt, enter P↵ or click Polygonal in the command‐line interface to draw a polygonal boundary. - Select the points shown in the top image in Figure 13.6 and then press ↵. The raster image is clipped to the boundary that you created, as shown in the second image in Figure 13.6.
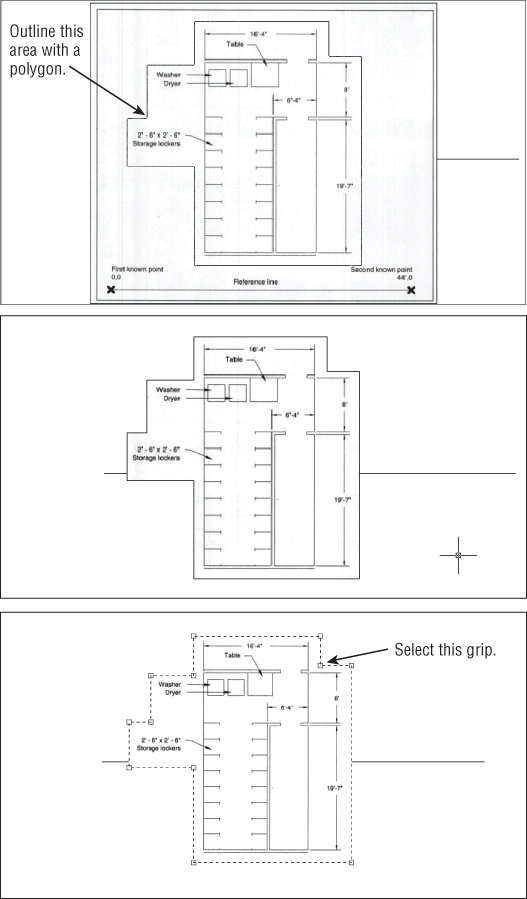
FIGURE 13.6 Adjusting the boundary of a clipped image
As the prompt in step 3 indicates, you can turn the clipping off or on, or you can delete an existing clipping boundary through the Clip Image option.
After you clip a raster image, you can adjust the clipping boundary by using its grips:
- Click the boundary edge of the raster image to expose its grips.
- Click a grip in the upper‐right corner, as shown in the bottom image in Figure 13.6.
- Drag the grip up and to the right, and then click a point. The image adjusts to the new boundary.
- You can save the
Rasterimport.dwgfile for future reference and exit the file.
In addition to hiding portions of a raster image that are unimportant to you, clipping an image file reduces the amount of RAM the raster image uses during your editing session. AutoCAD loads only the visible portion of the image into RAM and ignores the rest. A triangular options grip enables you to flip the display between what is shown inside the border and what is shown outside.
Turning Off the Frame, Adjusting Overall Quality, and Controlling Transparency
You can make three other adjustments to your raster image: frame visibility, image quality, and image transparency.
By default, a raster image displays an outline, or a frame. In many instances, this frame can detract from your drawing. You can turn off image frames globally by typing Imageframe↵0↵. This sets the Imageframe setting to 0, which turns off the frame visibility. If it's set to 1, the frame is made visible. You can also set it to 2, which leaves the frame visible but doesn't plot it (see Figure 13.7).
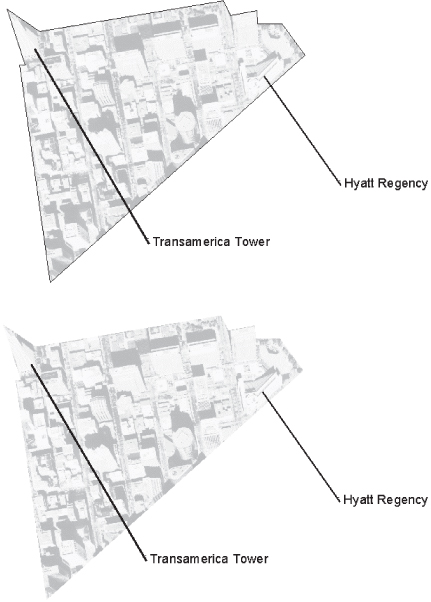
FIGURE 13.7 A raster image with the frame on (top) and off (bottom)
![]() Frames can also be controlled through the Frame flyout on the Insert tab's Reference panel. If you turn off a raster image's frame, you can't click the image to select it for editing, although you can still select an image using the All, Previous, or Last selection option (see Chapter 2, “Creating Your First Drawing,” for more on selection options). To make a raster image selectable with your mouse, turn on the image frame using the Display And Plot Frames or the Display But Don't Plot Frames option.
Frames can also be controlled through the Frame flyout on the Insert tab's Reference panel. If you turn off a raster image's frame, you can't click the image to select it for editing, although you can still select an image using the All, Previous, or Last selection option (see Chapter 2, “Creating Your First Drawing,” for more on selection options). To make a raster image selectable with your mouse, turn on the image frame using the Display And Plot Frames or the Display But Don't Plot Frames option.
If your drawing doesn't require the highest‐quality image, you can set the image quality to Draft mode. You may use Draft mode when you're tracing an image or when the image is already of a high quality. To set the image quality, enter Imagequality↵ and then enter H for High mode (high quality) or D for Draft mode. In Draft mode, your drawing will regenerate faster.
High mode softens the pixels of the raster image, giving the image a smoother appearance. Draft mode displays the image in a raw, pixelated state. If you look carefully at the regions between the motorcycle and the background in the second image in Figure 13.8, you'll see that the edges of the motorcycle appear a bit jagged. The top image in Figure 13.8 uses the High setting to soften the edges of the motorcycle. You may need to look closely to see the difference.
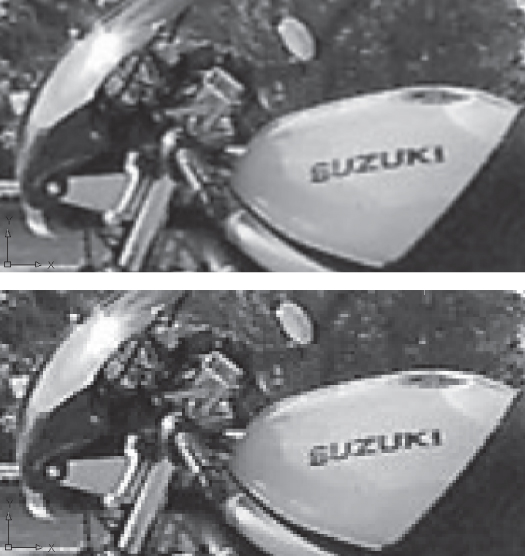
FIGURE 13.8 A close‐up of a raster image with quality set to High (top) and Draft (bottom)
Finally, you can control the transparency of raster image files that allow transparent pixels. Some file formats, such as GIF (Global Interchange Format), allow you to set a color in the image to be transparent (usually the background color). Most image‐editing programs support this format because it's a popular one used on web pages.
When you turn on the Transparency setting, objects normally obscured by the background of a raster image may show through. Select the raster image and then, in the Image tab's Options panel, select Background Transparency. You can also right‐click and select Image ➢ Transparency and then select On or Off from the Dynamic Input menu. In addition, you can enter Transparency↵ and then select the raster image that you want to make transparent. Press ↵, and then enter On or Off, depending on whether you want the image to be transparent. Unlike the Frame and Quality options, Transparency works on individual objects rather than operating globally.
The Properties palette offers many of the same adjustments described in this section. You can use it for quick access to the Transparency setting and other raster image settings.
Working with PDF Files
If you're using a computer as part of your daily work activity, you will encounter a PDF document. PDFs have become a part of everyday life, so it's no surprise that AutoCAD offers a fair amount of support for PDFs.
In the following sections, you'll learn how to import a PDF document into AutoCAD and how you can control various properties of the document, such as fading and the ability to snap to objects in the PDF.
Importing a PDF
To import a PDF, you use a method similar to the one you used earlier to import an image file. In fact, you could perform all of the steps in the exercise in the section “Importing a Raster Image” earlier in this chapter using a PDF file instead of the raster1.jpg file. You just need to know how to set up the Select Reference File dialog box to allow you to locate PDFs.
Try the following to see how to import a PDF:
- Open a new file using the
acad.dwtfile as a template. - Use the Save As option in the Application menu, and save the drawing as PDFunderlay.dwg.
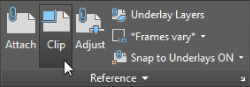
 Click the Attach tool in the Insert tab's Reference panel or type attach↵ to open the Select Reference File dialog box.
- In the Files Of Type drop‐down list at the bottom of the dialog box, select PDF Files (*.pdf).
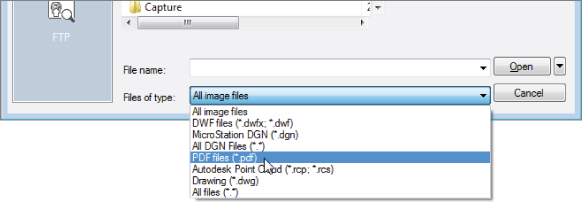
- Locate and select the
SampleImport.pdffile. - Click Open to open the Attach PDF Underlay dialog box (see Figure 13.9). Notice that you have an option to select a specific page of the PDF document if you are opening a multipage PDF.
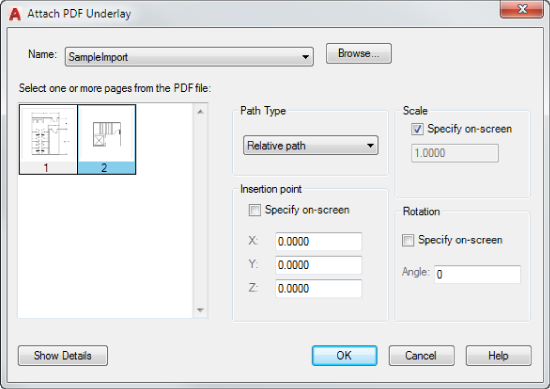
FIGURE 13.9 The Attach PDF Underlay dialog box
- Click page 2 of the page preview on the left side of the dialog box.
- Make sure the Specify On‐Screen options are selected for Scale and Insertion Point.
- Click OK and then, at the
Specify insertion point:prompt, place the outline of the drawing so that it is roughly centered in the drawing area and click. - At the
Specify scale factor or [Unit] <1.0000>:prompt, use the cursor to scale the image so that it fills the screen (see Figure 13.10). Page 2 of theSampleImport.pdffile appears in the drawing.
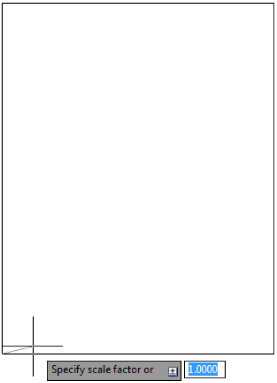
FIGURE 13.10 Manually scaling the PDF image
Scaling and Osnaps with PDFs
In an earlier exercise, you were able to scale an image file, though you had to use a reference line that was already in the image file to scale the drawing roughly to its proper size in AutoCAD. If you have a PDF that was created from an AutoCAD file or from another vector‐based program, you can use osnaps to select exact locations in the PDF.
Try the following exercise to see how you can use osnaps to select geometry in the PDF. You'll scale the drawing so that the width of the stairs conforms to the known distance for that area.
First make sure the Snap To Underlays feature is turned on:
- In the Insert tab's Reference panel, click the Snap To Underlays tool. Depending on your AutoCAD window width, you may see the icon only and not the “Snap To Underlays” label.
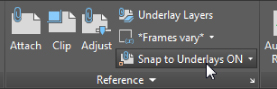
- Select the Snap To Underlays ON option.
Now you are ready to scale the PDF drawing:
- Click the Scale tool in the Home tab's Modify panel or type SC↵.
- Select the attached PDF file and press ↵.
- At the
Specify base point:prompt, turn on the osnaps and select the left endpoint of the horizontal line near the top of the drawing, as shown in Figure 13.11.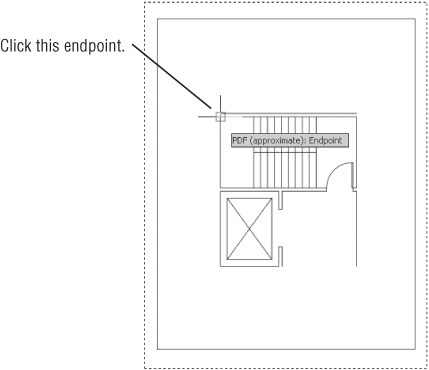
FIGURE 13.11 Selecting the first endpoint of the line for the Scale command
- At the
Specify scale factor or [Copy/Reference]:prompt, type R↵ to use the Reference option. - At the
Specify Reference length <1.0000>:prompt, click the same endpoint again or type @↵. - At the
Specify second point:prompt, click the endpoint of the line shown in Figure 13.12.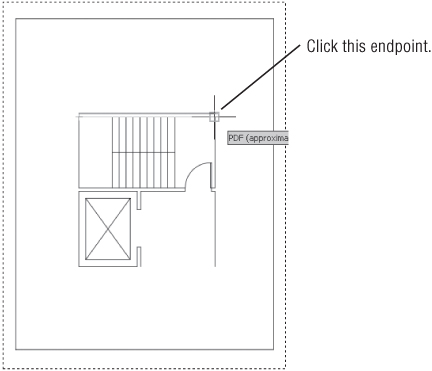
FIGURE 13.12 Selecting the second endpoint of the line for the Scale command
- At the
Specify new length or [Points] <1.0000>:prompt, enter 196↵, which is the inch equivalent of 16′‐4″. - In the Navigation bar, choose the Zoom Extents option from the Zoom flyout to center the drawing in the drawing area.
In this exercise, you were able to use object snaps directly on the imported PDF drawing. You may have noticed that a tool tip appeared with the message “PDF (approximate): Endpoint.” The PDF drawing is not an exact representation of the original drawing, so the tool tip reminds you that even though you are using an osnap to select a location in the drawing, it is not an exact location as it would be in an AutoCAD file.
Controlling the PDF Display
You can take advantage of a number of other features of a PDF file. Just as with a typical Xref or image file, you can fade the PDF so that it appears as a background image. You can also use the Clip feature that you saw earlier in this chapter to clip the PDF to a specific area.
You can gain access to these and other PDF display features through the PDF Underlay Ribbon tab. This tab appears automatically whenever you select an attached PDF drawing. Click the PDF drawing of the lobby, and you'll see the PDF Underlay tab appear in the Ribbon (see Figure 13.13).
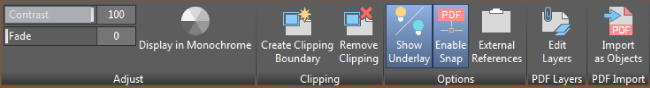
FIGURE 13.13 The panels on the PDF Underlay Ribbon tab
Table 13.2 describes the tools in the PDF Underlay Ribbon tab. The tools are fairly self‐explanatory. For example, the tools in the Adjust panel let you control the fade and contrast of the PDF drawing. The Display In Monochrome option displays a color PDF in monochrome.
TABLE 13.2: The PDF Underlay tab tools
| Option | Use |
| Contrast | Adjusts the contrast setting for the PDF |
| Fade | Adjusts the amount of fade applied to the PDF |
| Display In Monochrome | Displays the PDF in monochrome |
| Create Clipping Boundary | Adds a clipping boundary to the PDF |
| Remove Clipping | Removes a clipping boundary |
| Show Underlay | Shows or hides the PDF |
| Enable Snap | Enables or disables the PDF snap feature |
| External References | Opens the External References palette |
| Edit Layers | Opens the Underlay Layers dialog box, allowing you to control layer visibility |
| Import As Objects | Converts an attached vector PDF into AutoCAD drawing objects |
One option that you'll want to take a closer look at is the Edit Layers tool in the PDF Layers panel. If the source PDF is a drawing that contains layers, you can control the visibility of those layers using this tool. With an imported PDF selected, click the Edit Layers tool to open the Underlay Layers dialog box (see Figure 13.14).
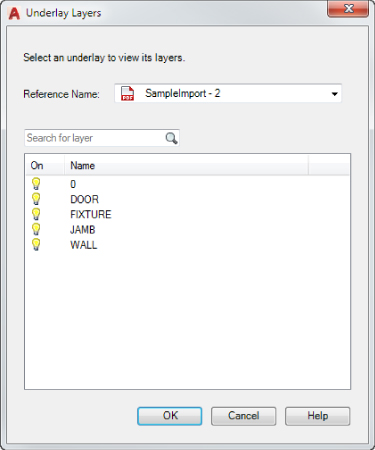
FIGURE 13.14 The Underlay Layers dialog box
You can turn the visibility of a layer on or off by clicking the light bulb icon to the left of it in the list. For example, if you turn off the WALL layer in the Underlay Layers dialog box for the SampleImport example, the PDF drawing will change so that the walls will not be shown (see Figure 13.15).
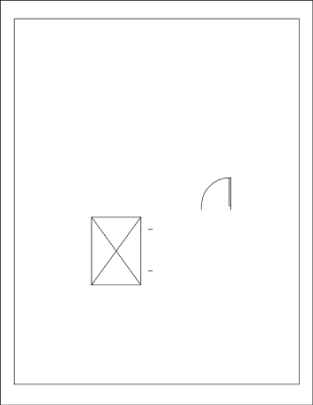
FIGURE 13.15 The imported PDF with the WALL layer turned off
Importing a PDF as an AutoCAD Drawing
PDFs can contain both raster and vector data. If you have a PDF that is a line drawing or 3D model, there is a good chance that it is stored in a vector format. PDFs containing vector information and text can be imported into AutoCAD as an AutoCAD drawing. For example, a PDF floor plan produced from AutoCAD can be imported back into AutoCAD and then edited as a normal AutoCAD drawing, as the following exercise will show:
- Click the Open icon in the Quick Access toolbar, and open the
PDFimport.dwgfile from thesamplesfolder. This is just a blank file with the units set to Architectural. - Open the Application menu by clicking the AutoCAD icon in the upper‐left corner of the AutoCAD window, and then select Import ➢ PDF. The cursor will change to a pickbox. At the
Select PDF underlay or [File] <File>:prompt, press ↵. - In the Import file dialog box, browse to the Chapter 13 sample files and open the
PDFvector.pdffile. The Import PDF dialog box appears (see Figure 13.16). Here you have a number of options that give you control over how the file is imported. For this exercise, you'll use the default settings.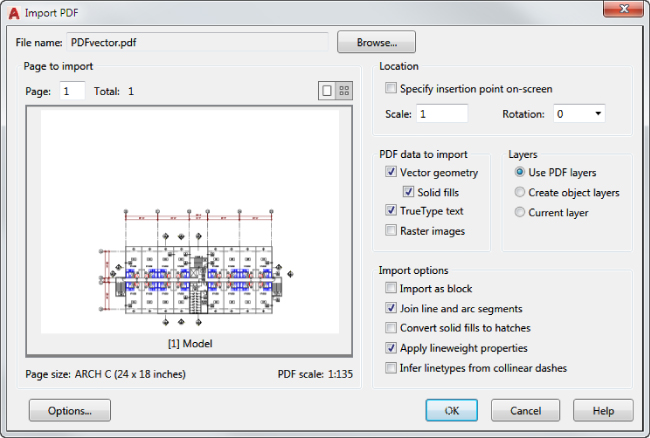
FIGURE 13.16 The Import PDF dialog box
- Click OK. The PDF is imported into the current file as an AutoCAD drawing.
- Click any object, and you'll notice that individual objects are selectable.
- Click a room label. You'll notice that the text has been converted to lines.
- Zoom into the left side of the drawing to enlarge the C and D grid lines.
- Click the Measure tool in the Home tab's Utilities panel, and then select the endpoints of the grid lines between grids C and D. Notice that measurement is the same as the dimensioned distance.
This exercise demonstrates a few features of the Import PDF feature. In step 6, you discovered that the room label was imported as lines. For drawings that contain TrueType fonts, you have the option to import text in the original font. This will enable you to edit the text using the AutoCAD text editing tools. In step 4, you saw that the drawings imported to scale. The distance between grid lines C and D measured the same as the dimensioned distance.
The PDFvector.dwg file was created using the AutoCAD PDF (High Quality Print).pc3 printer option. In addition, it was plotted from model space. Had it been printed from a layout, measurements taken in the drawing would reflect the print size and not a full, 1‐to‐1 scale drawing. For example, measuring the distance between grid lines C and D would have returned a distance in inches as if measured from a scale paper drawing.
Be aware that PDF plots created from model space will lose some accuracy, even though they will import to a 1‐to‐1 scale. In addition, PDF drawings from other vector programs may not import to scale, in which case you can use the Scale option in the Import PDF dialog box to adjust the scale of the imported drawing. Or you can just scale the drawing after it is imported using the methods described earlier in this chapter.
Let's take a look at the options in the Import PDF dialog box shown in Figure 13.16. These options enable you to control how the PDF is imported. You can set whether raster data is imported into the drawing or, if the PDF contains layers, how the layers are translated. You can also control how types of geometry are converted. For example, in the Import Options section, you can set the PDF to be imported as a block or convert solid fills in the PDF to hatches. The options are fairly self‐explanatory, but a few may need a bit more explanation.
![]() If the PDF file that you want to import contains multiple pages, you can select a page using the Page option just above and to the left of the preview image. You can also get a matrix view of the pages by selecting the thumbnail toggle above and to the right of the preview. The Options button in the lower‐left of the dialog box opens the Options dialog box to the File tab, where you can set the location for the storage of any raster images that are imported. (See Appendix B for more on the Files tab of the Options dialog box.)
If the PDF file that you want to import contains multiple pages, you can select a page using the Page option just above and to the left of the preview image. You can also get a matrix view of the pages by selecting the thumbnail toggle above and to the right of the preview. The Options button in the lower‐left of the dialog box opens the Options dialog box to the File tab, where you can set the location for the storage of any raster images that are imported. (See Appendix B for more on the Files tab of the Options dialog box.)
Reconstructing Imported AutoCAD SHX Fonts
The PDF file format does not support AutoCAD's SHX fonts such as Simplex and Txt. When you export an AutoCAD file to a PDF, TrueType fonts are maintained as fonts but AutoCAD SHX fonts are converted to drawing geometry such as lines and polylines, so when you import a PDF that was created from an AutoCAD drawing, SHX fonts will be imported as lines and polylines.
Fortunately, AutoCAD offers the Recognize SHX Text tool that can recognize imported SHX fonts and convert them back to AutoCAD text (see Figure 13.17). To use this tool, go to the Import panel in the Insert tab and select Recognize SHX Text. You can also enter PDFSHXTEXT↵. Next, select the geometry you want to convert back to AutoCAD text. Try to avoid including non‐text geometry in your selection. Once you've selected the geometry to convert, press ↵. When AutoCAD is finished with the conversion, you see a dialog box telling you how many text objects were created and how many fonts were used.
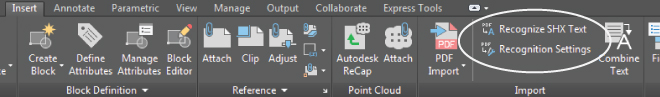
FIGURE 13.17 The Recognize SHX Text tool and the Recognition Settings tool
AutoCAD also offers the PDF Text Recognition Settings dialog box, which enables you to determine the font that AutoCAD uses for the conversion (see Figure 13.18). This dialog box can be opened by using the Recognition Settings tool in the Insert tab's Import panel (see Figure 13.17) or by selecting the Settings command option in the Recognize SHX Text tool.
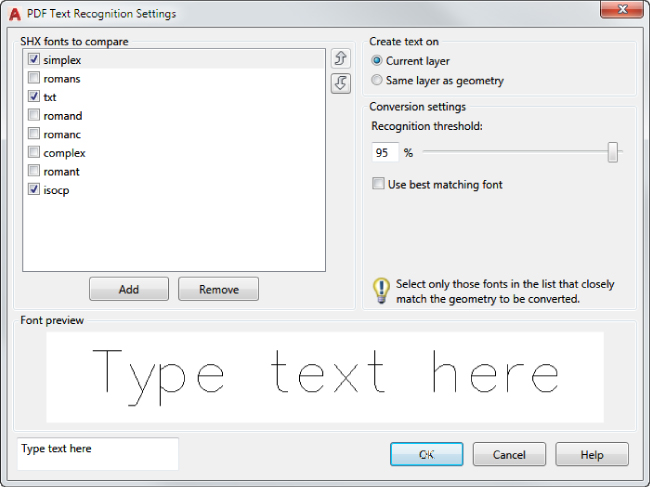
FIGURE 13.18 The PDF Text Recognition Settings dialog box
The PDF Text Recognition Settings dialog box contains a list that is populated with the most commonly used AutoCAD fonts. You can use the Add button to add other SHX fonts to the list, including custom and third‐party fonts.
Coordinating Geographic Locations
Architects and engineers use geolocation and mapping tools to help place their projects on their chosen sites. Usually, a program like Google Earth or another mapping program is used to get an idea of the site conditions. Street views from Google Maps can help designers get a better idea of how their buildings will appear from a street level.
Geolocation tools can help the designer coordinate information between the different disciplines involved in a project. Designers can place their projects over an aerial view of a site and coordinate the orientation and location of key features of their design.
The Geographic Location feature in AutoCAD allows you to place an accurately scaled map or aerial view in your drawing. You can then draw your designs directly on the map or import an existing AutoCAD design. Unlike an imported image, the Geographic Location map will always remain in the background so you don't have to be concerned about an overlapping image. You can also easily switch between a map view and an aerial view as the need arises.
Let's take a look at how the Geographic Location feature works:
- In a new file, select the Insert Ribbon tab, and in the Location panel, click Set Location, and select From Map.
- You will see a message asking “Do you want to use Online Map Data?” Click Yes.
- The Geographic Location dialog box appears (see Figure 13.19). Here, you can enter an address, a location name, or the latitude and longitude of a site.
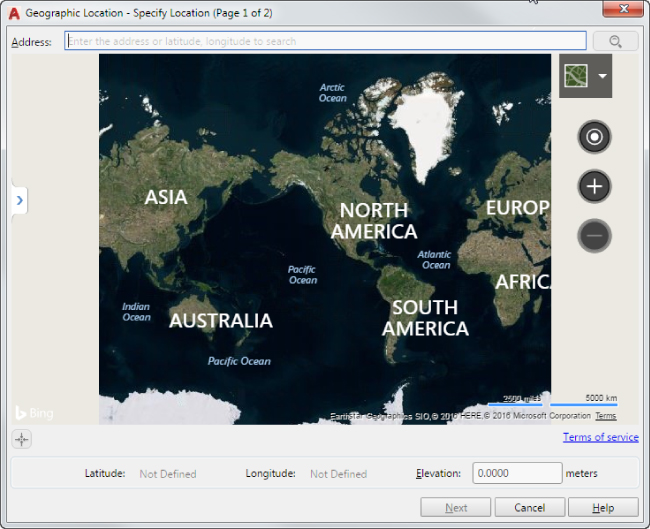
FIGURE 13.19 The Geographic Location dialog box
 Enter a location name or address in the text box at the top of the dialog box, and click the magnifying glass icon. For this exercise, enter Fort Mason, San Francisco. The dialog box changes to show an aerial view map of Fort Mason. In the left side, you see a list keyed to numbered locations on the map (see Figure 13.20). If there are multiple locations that contain the name you entered in this step, you will see them labeled with numbers.
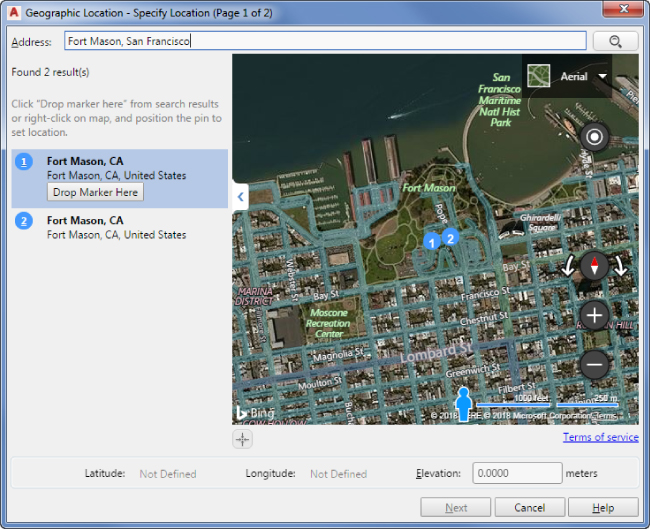
FIGURE 13.20 An aerial view of your selected location appears in the dialog box
- Click the Drop Marker Here button just under Fort Mason, San Francisco, CA. A red marker appears in the map.
- Click the Next button at the bottom of the dialog box.
- At the next dialog box, you are asked to select a coordinate system. Select NSRS11.SFO‐CS13F, which is at the top of the list, and then select Next. The dialog box closes, and you see the prompt
Select a point for the location <0.0000,0.0000.0.0000>:: - Click a point at the center of the drawing area. The point that you select corresponds to the red marker that appeared in the Geographic Location dialog box. You see the next prompt:
Specify the north direction angle or [First point] <90>: - Click a point directly above the first point that you selected to indicate a north direction pointing up. An aerial view of the northern tip of San Francisco appears (see Figure 13.21).
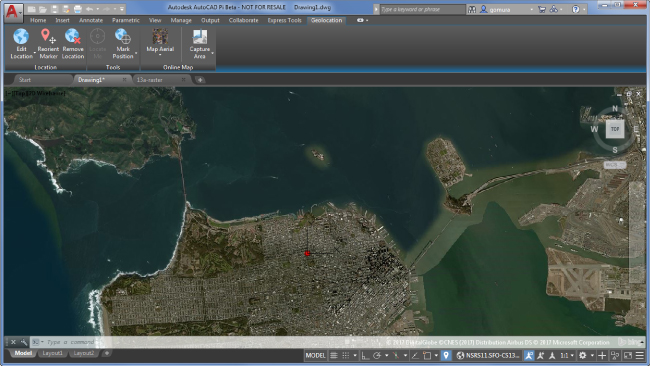
FIGURE 13.21 The drawing area with the Geographic Location aerial view
- Once the aerial view appears in the drawing, you can zoom in and out using the standard AutoCAD view tools. Use the wheel of your mouse to zoom in to get a closer look at Fort Mason.
You may notice that the Geolocation Ribbon tab appears with a set of options (see Figure 13.22). These options allow you to modify your geolocation view. For example, the Map Aerial flyout lets you switch to a map view and back again.
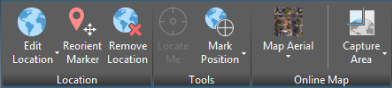
FIGURE 13.22 The Geolocation Ribbon tab panels
Try it in the following exercise:
- In the Online Map panel of the Geolocation tab, click the Map Aerial flyout and select Map Road. The view changes to show a graphic representation of the roads.
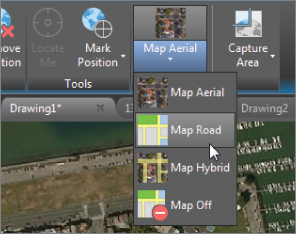
- In the Online Map panel of the Geolocation tab, click the Map Road flyout and select Map Aerial. The view changes back to the aerial view.
Making Adjustments to the Map
As you can see from the previous steps, you can easily switch between an aerial view and a map view. You also have the option to show a combined aerial and map view using the Map Hybrid option or to turn the geolocation background off entirely using the Map Off option.
OPTIONS ON THE LOCATION PANEL
Besides controlling the geolocation background image, the Geolocation Ribbon tab lets you make other adjustments to your background. Here is a rundown of the tools and features that you'll find in the Location panel:
- Edit Location Offers two options: From Map and From File. If you select From Map, the Geographic Location dialog box opens, enabling you to enter new location data. The From File option lets you find a location using a KML or KMZ file. KML files are used with Google Earth to enable location, tagging, and placement of 3D models on a Google Earth map. KMZ files are archive files similar to zip files, and they contain KML files and any support files needed for the KML file.
- Reorient Marker Lets you reposition the original marker location and reset the north orientation. You are asked to select a point for the location of the address or latitude‐longitude position, and then you are asked for the north orientation.
- Remove Location Lets you remove the geolocation map from the drawing. When you click this tool, you are asked if you want to remove the location data and the assigned coordinate system from the current drawing.
OPTIONS ON THE TOOLS PANEL
The Tools panel in the Geolocation tab offers tools that let you mark locations in the geolocation background. You've already seen what the Map Aerial and Map Road options do. The following list describes the other tools in this panel:
- Locate Me Lets you find your location on the aerial view or map. This feature is available only if your computer is equipped with a GPS or other feature that is able to provide your location data.
- Mark Position Lets you place a marker in the aerial or map view. The following options are available in the flyout: The Lat‐Long option lets you specify the latitude and longitude for the marker location. The My Location option is similar to the Locate Me tool, and it places a marker at your current location. The Point option enables you to point to a location to place a marker. Once you click a location, you are prompted to enter a text description for the location. AutoCAD opens the Text Editor Ribbon tab, giving you the ability to format your text description.
OPTIONS ON THE ONLINE MAP PANEL
The Online Map panel in the Geolocation tab gives you control over the map's appearance. It also lets you capture a portion of the map:
- Map Aerial Lets you select from a number of display options. You can choose to display a map (see Figure 13.23) or a combined map and aerial view. You can also turn the map off completely.
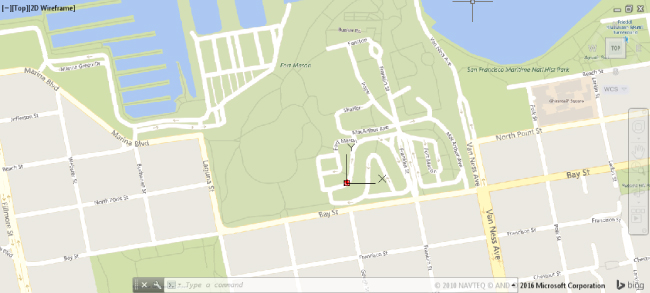
FIGURE 13.23 The Map Road view
- Capture Area Lets you place a selection rectangle over a portion of the displayed map. You can then copy the selected area to the Clipboard. You can also capture the entire map that is in the display. Once you place a selection rectangle, the Map Image Ribbon tab appears, enabling you to adjust brightness, contrast, and fade of the selected area. You can also control the quality of the image. Note that you can select the type of image that you want from the Map flyout to the far left of the Ribbon. You have the choice of Map Aerial, Map Road, and Map Hybrid.
The captured map area is stored with the drawing and is not dependent on an Internet connection. It can also be moved, rotated, or resized in a manner similar to an imported raster image. The captured area will also appear in the Layout viewports.
Finding Measurements and Distances
In the first Geolocation exercise, you may have noticed the Drawing Unit option in the Geographic Location dialog box. By default, this option is set to inches, but you can set it to feet, meters, miles, or some other unit of measure. By accepting the default inches for the Drawing Unit option, any measurements you take on the map will return distances using inches as the drawing unit. If the unit style of your drawing is set to Architectural, distances will be displayed in feet and inches—inches are the base drawing unit. Try the following exercise to see how distances are displayed:
- Type Units↵ to open the Drawing Units dialog box.
- Select Architectural from the Type drop‐down list, and then click OK.
- Choose Map Road from the Map Aerial flyout in the Map Tools Ribbon panel.
- Zoom into the map view so that it looks similar to Figure 13.23.
- Choose Measure from the Home tab's Utilities panel.
- Measure the distance from Laguna Street to Van Ness Avenue. The Measure tool reports a distance of 2446′, give or take a few feet.
In this exercise, the distance reported by the Measure tool is in feet. Had you not changed drawing unit in steps 1 and 2, the distance reported by the Measure tool would have been 29,043 units, which is the distance in inches.
You can use other methods to find measurements in your map. For example, you could get a rough estimate of the size of an existing building by drawing a closed polyline around the building outline (see Figure 13.24). Select the polyline and hover over a grip to view the dimensions of the outline closest to the grip.
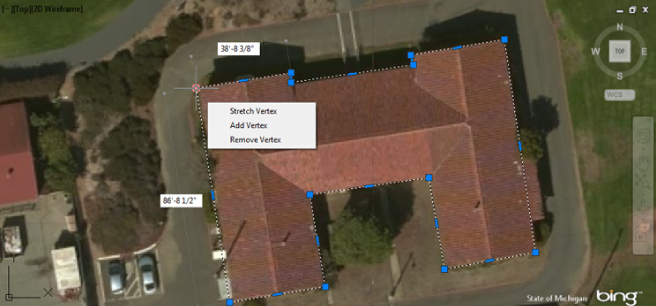
FIGURE 13.24 Dimensions from a building outline
The Bottom Line
- Convert paper drawings into AutoCAD files. AutoCAD gives you some great tools that let you convert your paper drawings into AutoCAD files. Several options are available. Depending on your needs, you'll find at least one solution that will allow you to convert your drawings quickly.
- Master It Describe the different methods available in AutoCAD for converting paper drawings into CAD files.
- Import a raster image. You can use bitmap raster images as backgrounds for your CAD drawings or as underlay drawings that you can trace over.
- Master It Import a raster image of your choice, and use the AutoCAD drawing tools to trace over your image.
- Work with a raster image. Once imported, raster images can be adjusted for size, brightness, contrast, and transparency.
- Master It Import a raster image of your choice, and fade the image so that it appears to blend into the background with less contrast.
- Work with PDF files. AutoCAD allows you to import and control the display of PDF files. This is significant since the PDF file format is so prevalent in the business world.
- Master It In a PDF that includes layers, how do you gain access to the layer settings?
- Use a geolocation map. You can include a correctly scaled background aerial view or road map of a site in your drawing to help you better coordinate your design with site conditions.
- Master It Name three types of information that you can use to find a site in the Geographic Location dialog box.