
Chapter 7
CloudTrail, CloudWatch, and AWS Config
THE AWS CERTIFIED SOLUTIONS ARCHITECT ASSOCIATE EXAM OBJECTIVES COVERED IN THIS CHAPTER MAY INCLUDE, BUT ARE NOT LIMITED TO, THE FOLLOWING:
- Domain 1: Design Resilient Architectures
- 1.2 Design highly available and/or fault‐tolerant architectures
- Domain 2: Design High‐Performing Architectures
- 2.1 Identify elastic and scalable compute solutions for a workload
- Domain 3: Design Secure Applications and Architectures
- 3.1 Design secure access to AWS resources
- 3.3 Select appropriate data security options
Introduction
CloudTrail, CloudWatch, and AWS Config are three services that can help you ensure the health, performance, and security of your AWS resources and applications. These services collectively help you keep an eye on your AWS environment by performing the following operational tasks:
- Tracking Performance Understanding how your AWS resources are performing can tell you if they're powerful enough to handle the load you're throwing at them or if you need to scale up or out. By tracking performance over time, you can identify spikes in usage and determine whether those spikes are temporarily exhausting your resources. For example, if an EC2 instance maxes out its CPU utilization during times of high usage, you may need to upgrade to a larger instance type or add more instances.
- Detecting Application Problems Some application problems may be latent or hidden and go unreported by users. Checking application logs for warnings or errors can alert you to latent problems early on. For example, the words exception or warning in a log may indicate a data corruption, a timeout, or other issue that needs to be investigated before it results in a catastrophic failure.
- Detecting Security Problems Users having excessive permissions—or worse, accessing resources they're not supposed to—pose a security risk. Tracking user activities and auditing user permissions can help you reduce your risk and improve your security posture.
- Logging Events Maintaining a log of every single action that occurs against your AWS resources can be invaluable in troubleshooting and security investigations. Problems and breaches are inevitable and sometimes go undiscovered until months later. Having a detailed record of who did what and when can help you understand the cause, impact, and scope of an issue. Just as importantly, you can use this information to prevent the same problem in the future.
- Maintaining an Inventory of AWS Resources Understanding your existing resources, how they're configured, and their relationships and dependencies can help you understand how proposed changes will impact your current environment. Maintaining an up‐to‐date inventory can also help you ensure compliance with baselines your organization has adopted. Tracking your resource configurations over time makes it easy to satisfy auditing requirements that demand documentation on how a resource was configured at a point in time in the past.
CloudTrail, CloudWatch, and AWS Config are separate services that can be configured independently. They can also work together to provide a comprehensive monitoring solution for your AWS resources, applications, and even on‐premises servers:
- CloudTrail keeps detailed logs of every read or write action that occurs against your AWS resources, giving you a trail that includes what happened, who did it, when, and even their IP address.
- CloudWatch collects numeric performance metrics from AWS and non‐AWS resources such as on‐premises servers. It collects and stores log files from these resources and lets you search them easily, and it provides alarms that can send you a notification or take an action when a metric crosses a threshold. CloudWatch can also take automatic action in response to events or on a schedule.
- AWS Config tracks how your AWS resources are configured and how they change over time. You can view how your resources are related to one another and how they were configured at any time in the past. You can also compare your resource configurations against a baseline that you define and have AWS Config alert you when a resource falls out of compliance.
CloudTrail
An event is a record of an action that a principal (a user or role; see Chapter 12, “The Security Pillar”) performs against an AWS resource. CloudTrail logs read and write actions against AWS services in your account, giving you a detailed record including the action, the resource affected and its region, who performed the action, and when.
CloudTrail logs both API and non‐API actions. API actions include launching an instance, creating a bucket in S3, and creating a virtual private cloud (VPC). Non‐API actions include logging into the management console. Despite the name, API actions are API actions regardless of whether they're performed in the AWS management console, with the AWS command‐line interface (CLI), with an AWS SDK, or by another AWS service. CloudTrail classifies events into management events and data events.
Management Events
Management events include operations that a principal executes (or attempts to execute) against an AWS resource. AWS also calls management events control plane operations. Management events are further grouped into write‐only and read‐only events.
- Write‐Only Events Write‐only events include API operations that modify or might modify resources. For example, the
RunInstancesAPI operation may create a new EC2 instance and would be logged, regardless of whether the call was successful. Write‐only events also include logging into the management console as the root or an IAM user. CloudTrail does not log unsuccessful root logins. - Read‐Only Events Read‐only events include API operations that read resources but can't make changes, such as the
DescribeInstancesAPI operation that returns a list of EC2 instances.
Data Events
Data events track two types of data plane operations that tend to be high volume: S3 object‐level activity and Lambda function executions. For S3 object‐level operations, CloudTrail distinguishes read‐only and write‐only events. GetObject—the action that occurs when you download an object from an S3 bucket—is a read‐only event, whereas DeleteObject and PutObject are write‐only events.
Event History
By default, CloudTrail logs 90 days of management events and stores them in a viewable, searchable, and downloadable database called the event history. The event history does not include data events.
CloudTrail creates a separate event history for each region containing only the activities that occurred in that region. So, if you're missing events, you're probably looking in the wrong region! But events for global services such as IAM, CloudFront, and Route 53 are included in the event history of every region.
Trails
If you want to store more than 90 days of event history or if you want to customize the types of events CloudTrail logs—for example, by excluding specific services or actions, or including data events such as S3 downloads and uploads—you can create a trail.
A trail is a configuration that records specified events and delivers them as CloudTrail log files to an S3 bucket of your choice. A log file contains one or more log entries in JavaScript Object Notation (JSON) format. A log entry represents a single action against a resource and includes detailed information about the action, including, but not limited to, the following:
- eventTime The date and time of the action, given in universal coordinated time (UTC). Log entries in a log file are sorted by timestamp, but events with the same timestamp are not necessarily in the order in which the events occurred.
userIdentityDetailed information about the principal that initiated the request. This may include the type of principal (e.g., IAM role or user), its Amazon resource name (ARN), and IAM username.eventSourceThe global endpoint of the service against which the action was taken (e.g.,ec2.amazonaws.com).eventNameThe name of the API operation (e.g.,RunInstances).awsRegionThe region the resource is located in. For global services, such as Route 53 and IAM, this is alwaysus‐east‐1.sourceIPAddressThe IP address of the requester.
Creating a Trail
You can choose to log events from a single region or all regions. If you apply the trail to all regions, then whenever AWS launches a new region, it automatically adds it to your trail.
You can create up to five trails for a single region. A trail that applies to all regions will count against this per‐region limit. For example, if you create a trail in us‐east‐1 and then create another trail that applies to all regions, CloudTrail will count this as two trails in the us‐east‐1 region.
After you create a trail, it can take up to 15 minutes between the time CloudTrail logs an event and the time it writes a log file to the S3 bucket. This also applies to events written to CloudTrail event history. If you don't see a recent event, just be patient!
Logging Management and Data Events
When you create a trail, you can choose whether to log management events, data events, or both. If you log management events, you must choose whether to log read‐only events, write‐only events, or both. This allows you to log read‐only and write‐only events to separate trails. Complete Exercise 7.1 to create a trail that logs write‐only events in all regions.
The following list explains the difference between management events and data events.
- Logging Management Events If you create a trail using the web console and log management events, the trail will automatically log global service events also. These events are logged as occurring in the
us‐east‐1region. This means that if you create multiple trails using the web console, global events will be logged to each trail. To avoid these duplicate events, you can disable logging global service events on an existing trail using the AWS CLI commandaws cloudtrail update‐trail ‐‐name mytrail ‐‐no‐include‐global‐service‐events.Alternately, if a trail is configured to log for all regions and you reconfigure it to log only for a single region, CloudTrail will disable global event logging for that trail. Another option is to forego the web console and create your trails using the AWS CLI, including the
‐‐no‐include‐global‐service‐eventsflag. - Logging Data Events You're limited to selecting a total of 250 individual objects per trail, including Lambda functions and S3 buckets and prefixes. If you have more than 250 objects to log, you can instruct CloudTrail to log all Lambda functions or all S3 buckets. If you create a single‐region trail to log Lambda events, you're limited to logging functions that exist in that region. If you create a trail that applies to all regions, you can log Lambda functions in any region.
Log File Integrity Validation
CloudTrail provides a means to ensure that no log files were modified or deleted after creation. When an attacker hacks into a system, it's common for them to delete or modify log files to cover their tracks. During quiet periods of no activity, CloudTrail also gives you assurance that no log files were delivered, as opposed to being delivered and then maliciously deleted. This is useful in forensic investigations where someone with access to the S3 bucket may have tampered with the log file.
With log file integrity validation enabled, every time CloudTrail delivers a log file to the S3 bucket, it calculates a cryptographic hash of the file. This hash is a unique value derived from the contents of the log file itself. If even one byte of the log file changes, the entire hash changes. Hashes make it easy to detect when a file has been modified.
Every hour, CloudTrail creates a separate file called a digest file that contains the cryptographic hashes of all log files delivered within the last hour. CloudTrail places this file in the same bucket as the log files but in a separate folder. This allows you to set different permissions on the folder containing the digest file to protect it from deletion. CloudTrail also cryptographically signs the digest file using a private key that varies by region and places the signature in the file's S3 object metadata.
Each digest file also contains a hash of the previous digest file, if it exists. If there are no events to log during an hourlong period, CloudTrail still creates a digest file. This lets you know that no log files were delivered during the quiet period.
You can validate the integrity of CloudTrail log and digest files by using the AWS CLI. You must specify the ARN of the trail and a start time. The AWS CLI will validate all log files from the starting time to the present. For example, to validate all log files written from January 1, 2021, to the present, you'd issue the following command:
aws cloudtrail validate‐logs ‐‐trail‐arn arn:aws:cloudtrail:us‐east‐1:account‐id:trail/benpiper‐trail ‐‐start‐time2021‐01‐01T00:00:00Z.
CloudWatch
CloudWatch lets you collect, retrieve, and graph numeric performance metrics from AWS and non‐AWS resources. All AWS resources automatically send their metrics to CloudWatch. These metrics include EC2 instance CPU utilization, EBS volume read and write IOPS, S3 bucket sizes, and DynamoDB consumed read and write capacity units. Optionally, you can send custom metrics to CloudWatch from your applications and on‐premises servers. CloudWatch Alarms can send you a notification or take an action based on the value of those metrics. CloudWatch Logs lets you collect, store, view, and search logs from AWS and non‐AWS sources. You can also extract custom metrics from logs, such as the number of errors logged by an application or the number of bytes served by a web server.
CloudWatch Metrics
CloudWatch organizes metrics into namespaces. Metrics from AWS services are stored in AWS namespaces and use the format AWS/service to allow for easy classification of metrics. For example, AWS/EC2 is the namespace for metrics from EC2, and AWS/S3 is the namespace for metrics from S3.
You can think of a namespace as a container for metrics. Namespaces help prevent metrics from being confused with similar names. For example, CloudWatch stores the WriteOps metric from the Relational Database Service (RDS) in the AWS/RDS namespace, whereas the EBS metric VolumeWriteOps goes in the AWS/EBS namespace. You can create custom namespaces for custom metrics. For example, you can store metrics from an Apache web server under the custom namespace Apache. Metrics exist only in the region in which they were created.
A metric functions as a variable and contains a time‐ordered set of data points. Each data point contains a timestamp, a value, and optionally a unit of measure. Each metric is uniquely defined by a namespace, a name, and optionally a dimension. A dimension is a name/value pair that distinguishes metrics with the same name and namespace from one another. For example, if you have multiple EC2 instances, CloudWatch creates a CPUUtilization metric in the AWS/EC2 namespace for each instance. To uniquely identify each metric, AWS assigns it a dimension named InstanceId with the value of the instance's resource identifier.
Basic and Detailed Monitoring
How frequently an AWS service sends metrics to CloudWatch depends on the monitoring type the service uses. Most services support basic monitoring, and some support basic monitoring and detailed monitoring.
Basic monitoring sends metrics to CloudWatch every five minutes. EC2 provides basic monitoring by default. EBS uses basic monitoring for gp2 volumes.
EC2 collects metrics every minute but sends only the five‐minute average to CloudWatch. How EC2 sends data points to CloudWatch depends on the hypervisor. For instances using the Xen hypervisor, EC2 publishes metrics at the end of the five‐minute interval. For example, between 13:00 and 13:05, an EC2 instance has the following CPUUtilization metric values measured in percent: 25, 50, 75, 80, and 10. The average CPUUtilization over the five‐minute interval is 48. Therefore, EC2 sends the CPUUtilization metric to CloudWatch with a timestamp of 13:00 and a value of 48.
For instances using the Nitro hypervisor, EC2 sends a data point every minute during a five‐minute period, but a data point is a rolling average. For example, at 13:00, EC2 records a data point for the CPUUtilization metric with a value of 25. EC2 sends this data point to CloudWatch with a timestamp of 13:00. At 13:01, EC2 records another data point with a value of 50. It averages this new data point with the previous one to get a value of 37.5. It then sends this new data point to CloudWatch, but with a timestamp of 13:00. This process continues for the rest of the five‐minute interval.
Services that use detailed monitoring publish metrics to CloudWatch every minute. More than 70 services support detailed monitoring, including EC2, EBS, RDS, DynamoDB, ECS, and Lambda. EBS defaults to detailed monitoring for io1 volumes.
Regular and High‐Resolution Metrics
The metrics generated by AWS services have a timestamp resolution of no less than one minute. For example, a measurement of CPUUtilization taken at 14:00:28 would have a timestamp of 14:00. These are called regular‐resolution metrics. For some AWS services, such as EBS, CloudWatch stores metrics at a five‐minute resolution. For example, if EBS delivers a VolumeWriteBytes metric at 21:34, CloudWatch would record that metric with a timestamp of 21:30.
CloudWatch can store custom metrics with up to one‐second resolution. Metrics with a resolution of less than one minute are high‐resolution metrics. You can create your own custom metrics using the PutMetricData API operation. When publishing a custom metric, you can specify the timestamp to be up to two weeks in the past or up to two hours into the future. If you don't specify a timestamp, CloudWatch creates one based on the time it received the metric in coordinated universal time (UTC).
Expiration
You can't delete metrics in CloudWatch. Metrics expire automatically, and when a metric expires depends on its resolution. Over time, CloudWatch aggregates higher‐resolution metrics into lower‐resolution metrics.
A high‐resolution metric is stored for three hours. After this, all the data points from each minute‐long period are aggregated into a single data point at one‐minute resolution. The high‐resolution data points simultaneously expire and are deleted. After 15 days, five data points stored at one‐minute resolution are aggregated into a single data point stored at five‐minute resolution. These metrics are retained for 63 days. At the end of this retention period, 12 data points from each metric are aggregated into a single 1‐hour resolution metric and retained for 15 months. After this, the metrics are deleted.
To understand how this works, consider a VolumeWriteBytes metric stored at five‐minute resolution. CloudWatch will store the metric at this resolution for 63 days, after which it will convert the data points to one‐hour resolution. After 15 months, CloudWatch will delete those data points permanently.
Graphing Metrics
CloudWatch can perform statistical analysis on data points over a period of time and graph the results as a time series. This is useful for showing trends and changes over time, such as spikes in usage. You can choose from the following statistics:
- Sum The total of all data points in a period
- Minimum The lowest data point in a period
- Maximum The highest data point in a period
- Average The average of all data points in a period
- Sample count The number of data points in a period
- Percentile The data point of the specified percentile. You can specify a percentile of up to two decimal places. For example, 50 would yield the median of the data points in the period. You must specify a percentile statistic in the format p50.
To graph a metric, you must specify the metric, the statistic, and the period. The period can be from one second to 30 days, and the default is 60 seconds. If you want CloudWatch to graph each data point as is, use the Sum statistic and set the period equal to the metric's resolution. For example, if you're using detailed monitoring to record the CPUUtilization metric from an EC2 instance, that metric will be stored at one‐minute resolution. Therefore, you would graph the CPUUtilization metric over a period of one minute using the Sum statistic. To get an idea of how this would look, refer to Figure 7.1.
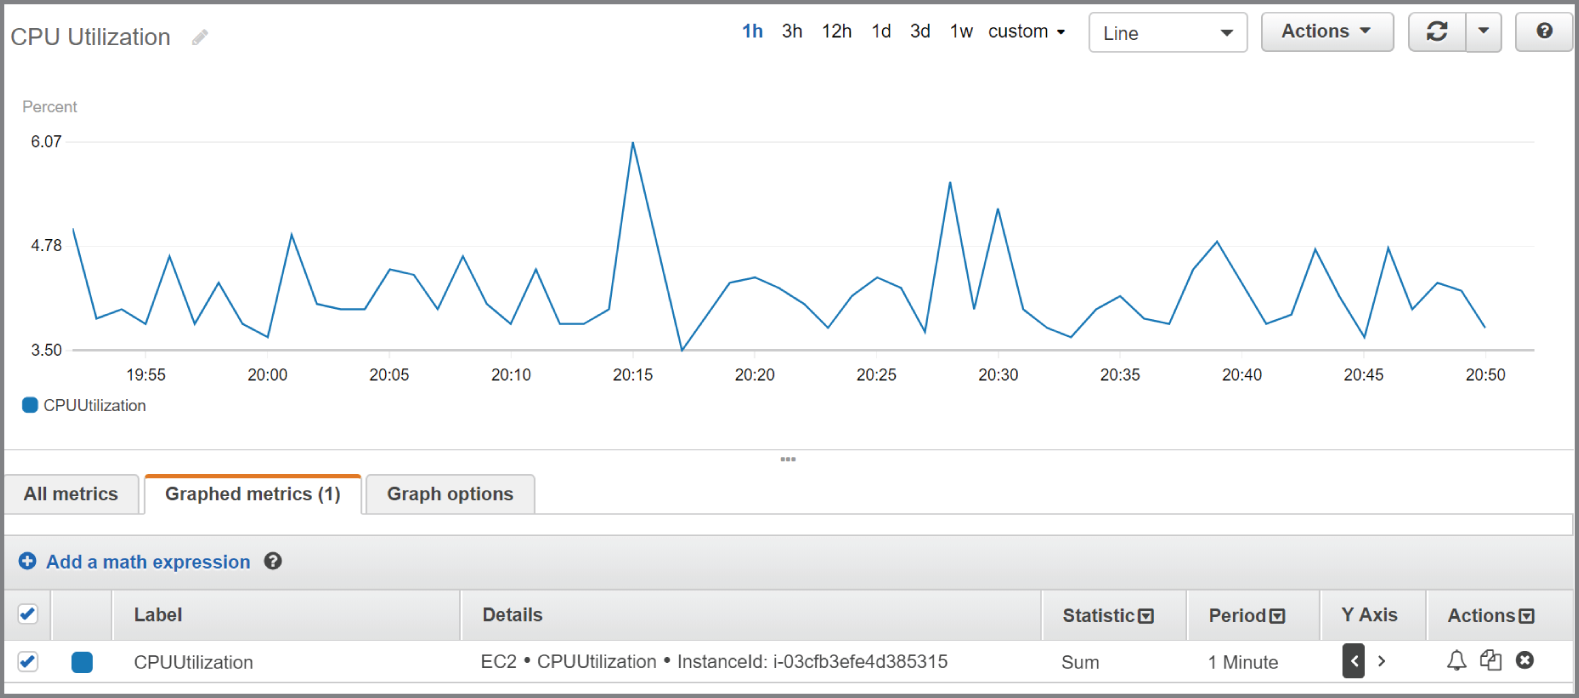
FIGURE 7.1 CPU utilization
Note that the statistic applies only to data points within a period. In the preceding example, the Sum statistic adds all data points within a one‐minute period. Because CloudWatch stores the metric at one‐minute resolution, there is only one data point per minute. Hence, the resulting graph shows each individual metric data point.
The time range in the preceding graph is set to one hour, but you can choose a range of time between 1 minute and 15 months. Choosing a different range doesn't change the time series, but only how it's displayed.
Which statistic you should choose depends on the metric and what you're trying to understand about the data. CPU utilization fluctuates and is measured as a percentage, so it doesn't make much sense to graph the sum of CPU utilization over, say, a 15‐minute period, because doing so would yield a result over 100 percent. It does, however, make sense to take the average CPU utilization over the same timeframe. Hence, if you were trying to understand long‐term patterns of CPU utilization, you can use the Average statistic over a 15‐minute period.
The NetworkOut metric in the AWS/EC2 namespace measures the number of bytes sent by an instance during the collection interval. To understand peak hours for network utilization, you can graph the Sum statistic over a one‐hour period and set the time range to one day, as shown in Figure 7.2.
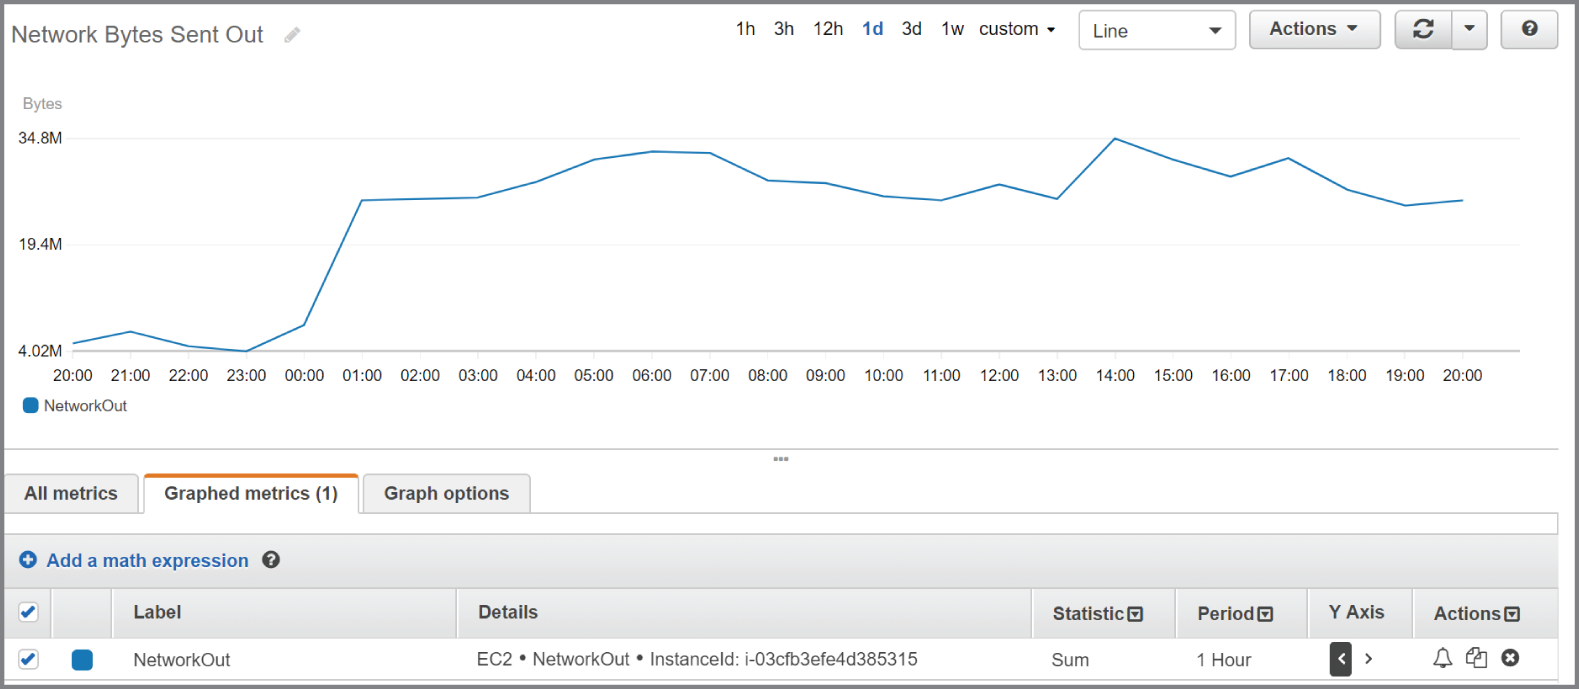
FIGURE 7.2 The sum of network bytes sent out over a one‐hour period
The Details column shows information that uniquely identifies the metric: the namespace, metric name, and the metric dimension, which in this case is InstanceId.
Metric Math
CloudWatch lets you perform various mathematical functions against metrics and graph them as a new time series. This capability is useful for when you need to combine multiple metrics into a single time series by using arithmetic functions, which include addition, subtraction, multiplication, division, and exponentiation. For example, you might divide the AWS/Lambda Invocations metrics by the Errors metric to get an error rate. Complete Exercise 7.2 to create a CloudWatch graph using metric math.
In addition to arithmetic functions, CloudWatch provides the following statistical functions that you can use in metric math expressions:
AVG—AverageMAX—MaximumMIN—MinimumSTDDEV—Standard deviationSUM—Sum
Statistical functions return a scalar value, not a time series, so they can't be graphed. You must combine them with the METRICS function, which returns an array of time series of all selected metrics. For instance, referring to step 6 in Exercise 7.2, you could replace the expression m1+m2 with the expression SUM(METRICS()) to achieve the same result. This would simply add up all the graphed metrics.
As another example, suppose you want to compare the CPU utilization of an instance with the standard deviation. You would first graph the AWS/EC2 metric CPUUtilization for the instance in question. You'd then add the metric math expression METRICS()/STDDEV(m1), where m1 is the time series for the CPUUtilization metric. See Figure 7.3 for an example of what such as graph might look like.
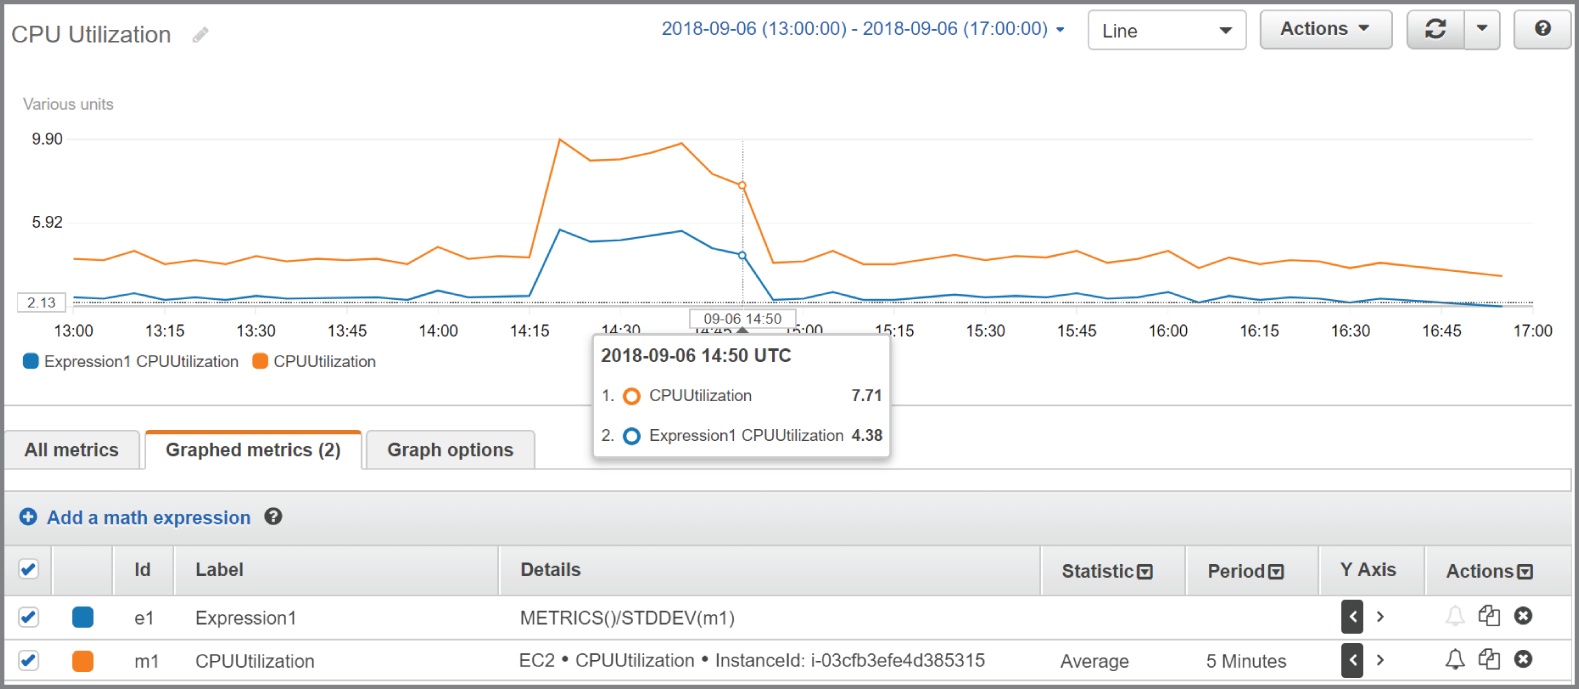
FIGURE 7.3 Combining metric math functions
Keep in mind that the function STDDEV(m1) returns a scalar value—the standard deviation of all data points for the CPUUtilization metric. You must therefore use the METRICS function in the numerator to yield a time series that CloudWatch can graph.
CloudWatch Logs
CloudWatch Logs is a feature of CloudWatch that collects logs from AWS and non‐AWS sources, stores them, and lets you search and even extract custom metrics from them. Some common uses for CloudWatch Logs include receiving CloudTrail logs, collecting application logs from an instance, and logging Route 53 DNS queries.
Log Streams and Log Groups
CloudWatch Logs stores log events that are records of activity recorded by an application or AWS resource. For CloudWatch Logs to understand a log event, the event must contain a timestamp and a UTF‐8 encoded event message. In other words, you can't store binary data in CloudWatch Logs.
CloudWatch Logs stores log events from the same source in a log stream. The source may be an application or AWS resource. For example, if you have multiple instances running a web server that generates access logs, the logs from each instance would go into a separate log stream. You can manually delete log streams, but not individual log events.
CloudWatch organizes log streams into log groups. A stream can exist in only one log group. To organize related log streams, you can place them into the same log group. For example, you might stream logs from all instances in the same Auto Scaling group to the same log group. There's no limit to the number of streams in a group.
You may define the retention settings for a log group, choosing to keep log events from between one day to 10 years or indefinitely, which is the default setting. The retention settings apply to all log streams in a log group. You can manually export a log group to an S3 bucket for archiving.
Metric Filters
You can use metric filters to extract data from log streams to create CloudWatch metrics. Metric values must be numeric. You can use a metric filter to extract a numeric value, such as the number of bytes transferred in a request, and store that in a metric. But you can't use a metric filter to extract a non‐numeric string, such as an IP address, from a log and store it as a metric. You can, however, increment a metric when the metric filter matches a specific string. You can create a metric filter to track the occurrences of a string at a particular position in a log file. For example, you may want to track the number of 404 Not Found errors that appear in an Apache web server application log. You would create a metric filter to track the number of times the string “404” appears in the HTTP status code section of the log. Every time CloudWatch Logs receives a log event that matches the filter, it increments a custom metric. You might name such a metric HTTP404Errors and store it in the custom Apache namespace. Of course, you can then graph this metric in CloudWatch.
Metric filters apply to entire log groups, and you can create a metric filter only after creating the group. Metric filters are not retroactive and will not generate metrics based on log events that CloudWatch recorded before the filter's creation.
CloudWatch Agent
The CloudWatch Agent is a command line–based program that collects logs from EC2 instances and on‐premises servers running Linux or Windows operating systems. The agent can also collect performance metrics, including metrics that EC2 doesn't natively produce, such as memory utilization. Metrics generated by the agent are custom metrics and are stored in a custom namespace that you specify.
Sending CloudTrail Logs to CloudWatch Logs
You can configure CloudTrail to send a trail log to a CloudWatch Logs log stream. Doing so lets you search and extract metrics from your trail logs. Remember that CloudTrail generates trail logs in JSON format and stores them in an S3 bucket of your choice, but it doesn't provide a way to search those logs. CloudWatch understands JSON format and makes it easy to search for specific events. For example, to search for failed console logins, you would filter the log stream in CloudWatch using the following syntax:
{$.eventSource = "signin.amazonaws.com" && $.responseElements.ConsoleLogin = "Failure" }CloudTrail does not send log events larger than 256 KB to CloudWatch Logs. Hence, a single RunInstances call to launch 500 instances would exceed this limit. Therefore, make sure you break up large requests if you want them to be available in CloudWatch Logs. Complete Exercise 7.3 to configure your existing CloudTrail to deliver trail logs to CloudWatch Logs.
CloudWatch Alarms
A CloudWatch alarm watches over a single metric and performs an action based on a change in its value. The action CloudWatch takes can include tasks such as sending an email notification, rebooting an instance, or executing an Auto Scaling action.
To create an alarm, you first define the metric you want CloudWatch to monitor. In much the same way CloudWatch doesn't graph metrics directly but graphs metric statistics over a period, a CloudWatch alarm does not directly monitor metrics. Instead, it performs statistical analysis of a metric over time and monitors the result.
Data Point to Monitor
Suppose you want to monitor the average of the AWS/EBS VolumeReadOps metric over a 15‐minute period. The metric has a resolution of 5 minutes. You would choose Average for the statistic and 15 minutes for the period. Every 15 minutes CloudWatch would take three metric data points—one every 5 minutes—and would average them together to generate a single data point to monitor.
You should set the period equal to or greater than the resolution of the metric. If you set a lower period, such as one minute, CloudWatch will look for a data point every minute, but because the metric updates only once every five minutes, it will count four of the five metrics as missing. This will result in the alarm not working properly.
If you use a percentile for the statistic, you must also select whether to ignore data points until the alarm collects a statistically significant number of data points. What constitutes statistically significant depends on the percentile. If you set the percentile to .5 (p50) or greater, you must have 10/1(1‐percentile) data points to have a statistically significant sample. For instance, if you use the p80 statistic, a statistically significant number of data points would be 10/(1‐.8) or 50. If the percentile is less than .5, you need 10/percentile data points to have a statistically significant sample. Supposing you were using the p25 statistic, you'd need 10/(.25), or 40 data points. If you choose to ignore data points before you have a statistically significant sampling, CloudWatch will not evaluate any of them. In other words, your alarm will be effectively disabled.
Threshold
The threshold is the value the data point to monitor must meet or cross to indicate something is wrong. There are two types of thresholds:
- Static Threshold You define a static threshold by specifying a value and a condition. If you want to trigger an alarm when
CPUUtilizationmeets or exceeds 50 percent, you would set the threshold for that alarm to >= 50. Or if you want to know whenCPUCreditBalancefalls below 800, you would set the threshold to < 800. - Anomaly Detection Anomaly detection is based on whether a metric falls outside of a range of values called a band. You define the size of the band based on the number of standard deviations. For example, if you set an anomaly detection threshold of 2, the alarm would trigger when a value is outside of two standard deviations from the average of the values.
Alarm States
The period of time a data point to monitor must remain crossing the threshold to trigger an alarm state change depends on the data points to alarm. An alarm can be in one of three states at any given time:
ALARMThe data points to alarm have crossed and remained past a defined threshold for a period of time.OKThe data points to alarm have not crossed and remained past a defined threshold for a period of time.INSUFFICIENT_DATAThe alarm hasn't collected enough data to determine whether the data points to alarm have crossed a defined threshold.
New alarms always start out in an INSUFFICIENT_DATA state. It's important to remember that an ALARM state doesn't necessarily indicate a problem, and an OK state doesn't necessarily indicate the absence of a problem. Alarm states track only whether the data points to alarm have crossed and remained past a threshold for a period of time. As an example, if the period is five minutes and the data points to alarm is three, then the data points to monitor must cross and remain crossing the threshold for 15 minutes before the alarm goes into an ALARM state.
Data Points to Alarm and Evaluation Period
There are cases where you may want to trigger the alarm if a data point to monitor crosses the threshold periodically but doesn't remain past it. For this, you can set an evaluation period that's equal to or greater than the data points to alarm. Suppose you want to trigger an alarm if the data points to monitor cross the threshold for three out of five data points. You would set the evaluation period to 5. The alarm would trigger if any three of the latest five data points exceed the threshold. The exceeding values don't have to be consecutive. This is called an m out of n alarm, where m is the data point to alarm and n is the evaluation period. The evaluation period can't exceed 24 hours.
To give an illustration, let's say you create an alarm with a threshold of >= 40. The data points to alarm is 2, and the evaluation period is 3, so this is a 2 out of 3 alarm. Now suppose CloudWatch evaluates the following three consecutive data points: 46, 39, and 41. Two of the three data points exceed the threshold, so the alarm will transition to the ALARM state.
Following that, CloudWatch evaluates the consecutive data points 45, 30, and 25. Two of the three data points fall below the threshold, so the alarm transitions to an OK state. Notice that CloudWatch must evaluate three data points (the evaluation period) before it changes the alarm state.
Missing Data
Missing data can occur during an evaluation period. This may happen if you detach an EBS volume from or stop an instance. CloudWatch offers the following four options for how it evaluates periods with missing data:
- As Missing This treats the period missing data as if it never happened. For instance, if over four periods the data points are 41, no data, 50, and 25, CloudWatch will remove the period with no data from consideration. If the evaluation period is 3, it will evaluate only three periods with the data points 41, 50, and 25. It will not consider the missing data as occurring in the evaluation period. This is the default setting.
- Not Breaching Missing data points are treated as not breaching the threshold. Consider a three out of four alarm with a threshold of <40, given the same data points: 41, no data, 50, and 25. Even though two values are breaching, the alarm would not trigger because the missing data is assumed to be not breaching.
- Breaching CloudWatch treats missing data as breaching the threshold. Using the preceding illustration, the alarm would trigger, as three of the four values would exceed the threshold.
- Ignore The alarm doesn't change state until it receives the number of consecutive data points specified in the data points to alarm setting.
Actions
You can configure an alarm to take an action when it transitions to a given state. You're not limited to just when an alarm goes into an ALARM state. You can also have CloudWatch take an action when the alarm transitions to an OK state. This is useful if you want to receive a notification when CPU utilization is abnormally high and another when it returns to normal. You can also trigger an action when an alarm monitoring an instance goes into an INSUFFICIENT_DATA state, which may occur when the instance shuts down. You can choose from the following actions:
- Notification Using Simple Notification Service The Simple Notification Service (SNS) uses communication channels called topics. A topic allows a sender or publisher to send a notification to one or more recipients called subscribers.
A subscriber consists of a protocol and an endpoint. The protocol can be HTTP, HTTPS, Simple Queue Service (SQS), Lambda, a mobile push notification, email, email‐JSON, or short message service (SMS, also known as text messages). The endpoint depends on the protocol. In the case of email or email‐JSON, the endpoint would be an email address. In the case of SQS, it would be a queue. The endpoint for HTTP or HTTPS would be a URL.
When creating an alarm action, you specify an SNS topic. When the alarm triggers, it sends a notification to the topic. SNS takes care of relaying the notification to the subscribers of the topic.
- Auto Scaling Action If you're using Auto Scaling, you can create a simple Auto Scaling policy to add or remove instances. The policy must exist before you can select it as an alarm action.
- EC2 Action You can stop, terminate, reboot, or recover an instance in response to an alarm state change. You might choose to monitor the
AWS/EC2 StatusCheckFailed_Instancemetric, which returns 1 if there's a problem with the instance, such as memory exhaustion, filesystem corruption, or incorrect network or startup configuration. Such issues could be corrected by rebooting the instance.You might also monitor the
StatusCheckedFailed_Systemmetric, which returns 1 when there's a problem that requires AWS involvement to repair, such as a loss of network connectivity or power, hypervisor problems, or hardware failure. In response to this, the recover action migrates the instance to a new host and restarts it with the same settings. In‐memory data is lost during this process.EC2 actions are available only if the metric you're monitoring includes the
InstanceIdas a dimension, as the action you specify will take place against that instance. Using an EC2 action requires a service‐linked role namedAWSServiceRoleForCloudWatchEvents, which CloudWatch can create for you when you create the alarm.
Although a single alarm can have multiple actions, it will take those actions only when it transitions to a single state that you specify when configuring the alarm. You cannot, for instance, set one action when an alarm transitions to an ALARM state and another action when it transitions to an OK state. Instead, you'd have to create two separate alarms.
Amazon EventBridge
EventBridge (formerly known as CloudWatch Events) monitors for and takes an action either based on specific events or on a schedule. For example, a running EC2 instance entering the stopped state would be an event. An IAM user logging into the AWS Management Console would be another event. EventBridge can automatically take immediate action in response to such events.
EventBridge differs from CloudWatch Alarms in that EventBridge takes some action based on specific events, not metric values. Hence, EventBridge can send an SNS notification as soon as an EC2 instance stops. Or it can execute a Lambda function to process an image file as soon as a user uploads it to an S3 bucket.
Event Buses
EventBridge monitors event buses. By default, every AWS account has one event bus that receives events for all AWS services. You can create a custom event bus to receive events from other sources, such as your applications or third‐party services.
Rules and Targets
A rule defines the action to take in response to an event. When an event matches a rule, you can route the event to a target that takes action in response to the event. For example, if you want to receive an email whenever an EC2 Auto Scaling event occurs, you could create a rule to watch for instances in an Auto Scaling group being launched or terminated. For the target, you could select an SNS topic that's configured to send you an email notification.
A rule can also invoke a target on a schedule. This is useful if you want to take hourly EBS snapshots of an EC2 instance. Or to save money, you might create a schedule to shut down test instances every day at 7 p.m.
AWS Config
AWS Config tracks the configuration state of your AWS resources at a point in time. Think of AWS Config as a time machine. You can use it to see what a resource configuration looked like at some point in the past versus what it looks like now.
It can also show you how your resources are related to one another so that you can see how a change in one resource might impact another. For instance, suppose you create an EBS volume, attach it to an instance, and then later detach it. You can use AWS Config to see not only exactly when you created the volume but when it was attached to and detached from the instance.
Note that this is different from CloudTrail, which logs events, and from EventBridge, which can alert on events. Only AWS Config gives you a holistic view of your resources and how they were configured at any point in time. In other words, EventBridge deals with events or actions that occur against a resource, whereas AWS Config deals with the state of a resource. AWS Config can help you with the following objectives:
- Security AWS Config can notify you whenever a resource configuration changes, alerting you to potential breaches. You can also see what users had which permissions at a given time.
- Easy Audit Reports You can provide a configuration snapshot report showing you how your resources were configured at any point in time.
- Troubleshooting You can analyze how a resource was configured around the time a problem started. AWS Config makes it easy to spot misconfigurations and how a problem in one resource might impact another.
- Change Management AWS Config lets you see how a potential change to one resource could impact another. For example, if you plan to change a security group, you can use AWS Config to quickly see all instances that use that security group.
The Configuration Recorder
The configuration recorder is the workhorse of AWS Config. It discovers your existing resources, records how they're configured, monitors for changes, and tracks those changes over time. By default, it monitors all items in the region in which you configure it. It can also monitor the resources of global services such as IAM. If you don't want to monitor all resources, you can select specific resource types to monitor, such as EC2 instances, IAM users, S3 buckets, or DynamoDB tables. You can have only one configuration recorder per region.
Configuration Items
The configuration recorder generates a configuration item for each resource it monitors. The configuration item contains the specific settings for that resource at a point in time, as well as the resource type, its ARN, and when it was created. The configuration item also includes the resource's relationships to other resources. For example, a configuration item for an EBS volume would include the instance ID of the instance it was attached to at the time the item was recorded. AWS Config maintains configuration items for every resource it tracks, even after the resource is deleted. Configuration items are stored internally in AWS Config, and you can't delete them manually.
Configuration History
AWS Config uses configuration items to build a configuration history for each resource. A configuration history is a collection of configuration items for a given resource over time. A configuration history includes details about the resources, such as when it was created, how it was configured at different points in time, and when it was deleted, if applicable. It also includes any related API logged by CloudTrail.
Every six hours in which a change occurs to a resource, AWS Config delivers a configuration history file to an S3 bucket that you specify. The S3 bucket is part of what AWS calls the delivery channel. Configuration history files are grouped by resource type. The configuration history for all EC2 instances goes into one file, and the history for EBS volumes goes into another. The files are timestamped and kept in separate folders by date. You can also view configuration history directly from the AWS Config console. You can optionally add an SNS topic to the delivery channel to have AWS Config notify you immediately whenever there's a change to a resource.
Configuration Snapshots
A configuration snapshot is a collection of all configuration items from a given point in time. Think of a configuration snapshot as a configuration backup for all monitored resources in your account.
Using the AWS CLI, you can have AWS Config deliver a configuration snapshot to the bucket defined in your delivery channel. By default, the delivery channel is named default, so to deliver a configuration snapshot, you would manually issue the following command:
aws configservice deliver-config-snapshot --delivery-channel-name defaultAWS Config can automatically deliver a configuration snapshot to the delivery channel at regular intervals. You can't set automatic delivery of this snapshot in the console but must configure the delivery using the CLI. To do this, you must also specify a JSON file containing at a minimum the following items:
- Delivery channel name (default)
- S3 bucket name
- Delivery frequency of the configuration snapshot
The file may also optionally contain an SNS ARN. Let's refer to the following file as deliveryChannel.json:
{"name": "default","s3BucketName": "my-config-bucket-us-east-1","snsTopicARN": "arn:aws:sns:us-east-1:account-id:config-topic","configSnapshotDeliveryProperties": {"deliveryFrequency": "TwentyFour_Hours"}}
The delivery frequency can be every hour or every 24, 12, 6, or 3 hours. To reconfigure the delivery channel according to the settings in the deliveryChannel.json file, you'd issue the following command:
aws configservice put-delivery-channel --delivery-channel file://deliveryChannel.jsonTo verify that the configuration change succeeded, issue the following command:
aws configservice describe-delivery-channelsIf the output matches the configuration settings in the file, then the configuration change was successful.
Monitoring Changes
The configuration recorder generates at least one new configuration item every time a resource is created, changed, or deleted. Each new item is added to the configuration history for the resource as well as the configuration history for the account.
A change to one resource will trigger a new configuration item for the changed resource and related resources. For instance, removing a rule in a security group causes the configuration recorder to create a new item for the security group and every instance that uses that security group.
Although you can't delete configuration items manually, you can configure AWS Config to keep configuration items between 30 days and 7 years. Seven years is the default. Note that the retention period does not apply to the configuration history and configuration snapshot files AWS Config delivers to S3.
Starting and Stopping the Configuration Recorder
You can start and stop the configuration recorder at any time using the web console or the CLI. During the time the configuration recorder is stopped, it doesn't monitor or record changes. But it does retain existing configuration items. To stop it using the following CLI command, you must specify the configuration recorder's name, which is default.
aws configservice stop-configuration-recorder --configuration-recorder-name defaultTo start the recorder, issue the following command:
aws configservice start-configuration-recorder --configuration-recorder-name defaultRecording Software Inventory
AWS Config can record software inventory changes on EC2 instances and on‐premises servers. This includes the following:
- Applications
- AWS components such as the CLI and SDKs
- The name and version of the operating system
- IP address, gateway, and subnet mask
- Firewall configuration
- Windows updates
To have AWS Config track these changes, you must enable inventory collection for the server using the AWS Systems Manager. You also must ensure AWS Config monitors the SSM: ManagedInstanceInventory resource type.
Managed and Custom Rules
In addition to monitoring resources changes, AWS Config lets you specify rules to define the optimal baseline configuration for your resources. AWS Config also provides customizable, predefined rules that cover a variety of common scenarios. For example, you may want to verify that CloudTrail is enabled, that every EC2 instance has an alarm tracking the CPUUtilization metric, that all EBS volumes are encrypted, or that multifactor authentication (MFA) is enabled for the root account. If any resources are noncompliant, AWS Config flags them and generates an SNS notification.
When you activate a rule, AWS Config immediately checks monitored resources against the rules to determine whether they're compliant. After that, how often it reevaluates resources is based on how the rule is configured. A reevaluation can be triggered by configuration changes or it can be set to run periodically. Periodic checks can occur every hour or every 3, 6, 12, or 24 hours. Note that even if you turn off the configuration recorder, periodic rules will continue to run.
Summary
You must configure CloudWatch and AWS Config before they can begin monitoring your resources. CloudTrail automatically logs only the last 90 days of management events even if you don't configure it. It's therefore a good idea to configure these services early on in your AWS deployment.
CloudWatch, CloudTrail, and AWS Config serve different purposes, and it's important to know the differences among them and when each is appropriate for a given use case.
CloudWatch tracks performance metrics and can take some action in response to those metrics. It can also collect and consolidate logs from multiple sources for storage and searching, as well as extract metrics from them.
CloudTrail keeps a detailed record of activities performed on your AWS account for security or auditing purposes. You can choose to log read‐only or write‐only management or data events.
AWS Config records resource configurations and relationships past, present, and future. You can look back in time to see how a resource was configured at any point. AWS Config can also compare current resource configurations against rules to ensure that you're in compliance with whatever baseline you define.
Exam Essentials
- Know how to configure the different features of CloudWatch. CloudWatch receives and stores performance metrics from various AWS services. You can also send custom metrics to CloudWatch. You can configure alarms to take one or more actions based on a metric. CloudWatch Logs receives and stores logs from various resources and makes them searchable.
- Know the differences between CloudTrail and AWS Config. CloudTrail tracks events, while AWS Config tracks how those events ultimately affect the configuration of a resource. AWS Config organizes configuration states and changes by resource, rather than by event.
- Understand how CloudWatch Logs integrates with and complements CloudTrail. CloudTrail can send trail logs to CloudWatch Logs for storage, searching, and metric extraction.
- Understand how SNS works. SNS uses a push paradigm. CloudWatch and AWS Config send notifications to an Amazon SNS topic. The SNS topic passes these notifications on to a subscriber, which consists of a protocol and endpoint. Know the various protocols that SNS supports.
- Know the differences between CloudWatch Alarms and EventBridge. CloudWatch Alarms monitors and alerts on metrics, whereas EventBridge monitors and takes action on events.
Review Questions
- You've configured CloudTrail to log all management events in all regions. Which of the following API events will CloudTrail log? (Choose all that apply.)
- Logging into the AWS console
- Creating an S3 bucket from the web console
- Uploading an object to an S3 bucket
- Creating a subnet using the AWS CLI
- You've configured CloudTrail to log all read‐only data events. Which of the following events will CloudTrail log?
- Viewing all S3 buckets
- Uploading a file to an S3 bucket
- Downloading a file from an S3 bucket
- Creating a Lambda function
- Sixty days ago, you created a trail in CloudTrail to log read‐only management events. Subsequently someone deleted the trail. Where can you look to find out who deleted it? No other trails are configured.
- The IAM user log
- The trail logs stored in S3
- The CloudTrail event history in the region where the trail was configured
- The CloudTrail event history in any region
- What uniquely distinguishes two CloudWatch metrics that have the same name and are in the same namespace?
- The region
- The dimension
- The timestamp
- The data point
- Which type of monitoring sends metrics to CloudWatch every five minutes?
- Regular
- Detailed
- Basic
- High resolution
- You update a custom CloudWatch metric with the timestamp of 15:57:08 and a value of 3. You then update the same metric with the timestamp of 15:57:37 and a value of 6. Assuming the metric is a high‐resolution metric, which of the following will CloudWatch do?
- Record both values with the given timestamp.
- Record the second value with the timestamp 15:57:37, overwriting the first value.
- Record only the first value with the timestamp 15:57:08, ignoring the second value.
- Record only the second value with the timestamp 15:57:00, overwriting the first value.
- How long does CloudWatch retain metrics stored at one‐hour resolution?
- 15 days
- 3 hours
- 63 days
- 15 months
- You want to use CloudWatch to graph the exact data points of a metric for the last hour. The metric is stored at five‐minute resolution. Which statistic and period should you use?
- The Sum statistic with a five‐minute period
- The Average statistic with a one‐hour period
- The Sum statistic with a one‐hour period
- The Sample count statistic with a five‐minute period
- Which CloudWatch resource type stores log events?
- Log group
- Log stream
- Metric filter
- CloudWatch Agent
- The CloudWatch Agent on an instance has been sending application logs to a CloudWatch log stream for several months. How can you remove old log events without disrupting delivery of new log events? (Choose all that apply.)
- Delete the log stream.
- Manually delete old log events.
- Set the retention of the log stream to 30 days.
- Set the retention of the log group to 30 days.
- You created a trail to log all management events in all regions and send the trail logs to CloudWatch logs. You notice that some recent management events are missing from the log stream, but others are there. What are some possible reasons for this? (Choose all that apply.)
- The missing events are greater than 256 KB in size.
- The metric filter is misconfigured.
- There's a delay between the time the event occurs and the time CloudTrail streams the event to CloudWatch.
- The IAM role that CloudTrail assumes is misconfigured.
- Two days ago, you created a CloudWatch alarm to monitor the
VolumeReadOpson an EBS volume. Since then, the alarm has remained in anINSUFFICIENT_DATAstate. What are some possible reasons for this? (Choose all that apply.)- The data points to monitor haven't crossed the specified threshold.
- The EBS volume isn't attached to a running instance.
- The evaluation period hasn't elapsed.
- The alarm hasn't collected enough data points to alarm.
- You want a CloudWatch alarm to change state when four consecutive evaluation periods elapse with no data. How should you configure the alarm to treat missing data?
- As Missing
- Breaching
- Not Breaching
- Ignore
- As Not Missing
- You've configured an alarm to monitor a metric in the
AWS/EC2namespace. You want CloudWatch to send you a text message and reboot an instance when an alarm is breaching. Which two actions should you configure in the alarm? (Choose two.)- SMS action
- Auto Scaling action
- Notification action
- EC2 action
- In a CloudWatch alarm, what does the EC2 recover action do to the monitored instance?
- Migrates the instance to a different host
- Reboots the instance
- Deletes the instance and creates a new one
- Restores the instance from a snapshot
- You learn that an instance in the
us‐west‐1region was deleted at some point in the past. To find out who deleted the instance and when, which of the following must be true?- The AWS Config configuration recorder must have been turned on in the region at the time the instance was deleted.
- CloudTrail must have been logging write‐only management events for all regions.
- CloudTrail must have been logging IAM events.
- The CloudWatch log stream containing the deletion event must not have been deleted.
- Which of the following may be included in an AWS Config delivery channel? (Choose all that apply.)
- A CloudWatch log stream
- The delivery frequency of the configuration snapshot
- An S3 bucket name
- An SNS topic ARN
- You configured AWS Config to monitor all your resources in the
us‐east‐1region. After making several changes to the AWS resources in this region, you decided you want to delete the old configuration items. How can you accomplish this?- Pause the configuration recorder.
- Delete the configuration recorder.
- Delete the configuration snapshots.
- Set the retention period to 30 days and wait for the configuration items to age out.
- Which of the following metric math expressions can CloudWatch graph? (Choose all that apply.)
- AVG(m1)‐m1
- AVG(m1)
- METRICS()/AVG(m1)
- m1/m2
- You've configured an AWS Config rule to check whether CloudTrail is enabled. What could prevent AWS Config from evaluating this rule?
- Turning off the configuration recorder
- Deleting the rule
- Deleting the configuration history for CloudTrail
- Failing to specify a frequency for periodic checks
- Which of the following would you use to execute a Lambda function whenever an EC2 instance is launched?
- CloudWatch Alarms
- EventBridge
- CloudTrail
- CloudWatch Metrics