
CHAPTER 6
Container Image CVEs
Systems of all types are subject to common vulnerabilities and exploits (CVEs)—known software bugs that provide attackers a foothold to take advantage of. Container images are no exception and need to be monitored for CVEs, but they additionally require a patching strategy in which either developers themselves or a centralized team take ownership to ensure that containers do not run in a production environment without meeting the tolerated in-house criteria. Each CVE is assigned risk categories using standardized ratings. It is common that an in-house standard might allow containers to spawn from images only when Critical vulnerabilities are not present. Or, indeed, to disallow both High and Critical vulnerabilities, for example.
Identifying issues is just a small part of the process involved when container images contain CVEs. A mature and well-formulated strategy needs to be agreed upon and enforced. It is not enough to disseminate the plan among developer teams, which might take the easy way out and ignore issues; the strategy requires enforcement to make a difference on a large, containerized estate. And besides checking for CVEs with proprietary and Open Source products, the strategy must also check for the compliance of a container image, for example, whether it was created to run as the insecure root user, as discussed in previous chapters. CVEs will undoubtedly also be lurking in abundance within container image registries.
In this chapter, we will examine what a CVE entails, in definition and content, and look at three popular tools that can scan container images to identify where vulnerabilities exist. Additionally, you will learn how to scan images against CIS Benchmarks, and when we look at the third tool, we will look at how to install and set up an exceptional Open Source image registry that automatically scans images for CVEs as standard.
Understanding CVEs
Understanding how CVEs are scored is of critical importance so that you can gauge whether to follow the standardized approach or create your own scoring system in-house. One should always examine CVE scanning results as well as the actual use of a container image to make a thorough assessment.
Each estate is unique, and it is important to bear in mind that software vendors only suggest the criticality of the patch according to their own criteria and without having access to how a company might use their software. One example scenario might be that your organization runs microservices within a specific technology stack. On the back end, which only staff have access to within an air-gapped network segment, popular web servers run as containers. When CVEs are announced for these web servers and a critical CVE is discovered, a panic occurs because of the servers’ public-facing nature. In this case, however, a maintenance window could be postponed until convenient, thanks to the fact that the CVE is not directly affecting production services that are client-facing, and the issue only affects back-end staff. The in-house scoring of such security issues would be specifically oriented to your own unique attack vectors.
The vulnerability scoring standard is called the Common Vulnerability Scoring System (CVSS) and is widely adopted for good reason. The specification is clear, well-thought-out, and updated by the CVSS Special Interest Group. You can find more information at www.first.org/cvss/specification-document about the current version, v3.1. The document explains that the scope is not just for software but hardware and firmware in addition. The standard defines three key groups of metrics. The first of these, the Base score, is related to a vulnerability's key characteristics and its severity. The Temporal metrics are focused on how a vulnerabilities severity may alter over a period of time, such as whether exploit code is available in the wild and successful compromises have been witnessed. Finally, the Environmental metric can adjust the other metrics if a specific computing environment is affected. The last thing to note is that CVSS scoring ranges from 0.0 to 10.0. One area of CVEs to pay attention to is the common language used throughout. For example, if a CVE can allow a remote compromise over the network, then the attack vector will be listed as “network,” and the Base Score will likely be increased as a result. Other common terminology might include denial-of-service (DoS) attacks in the common parlance and if a vulnerability might not actively cause a compromise directly but instead cause a service to fail permanently or intermittently. Figure 6.1 summarizes the CVE vulnerability levels.
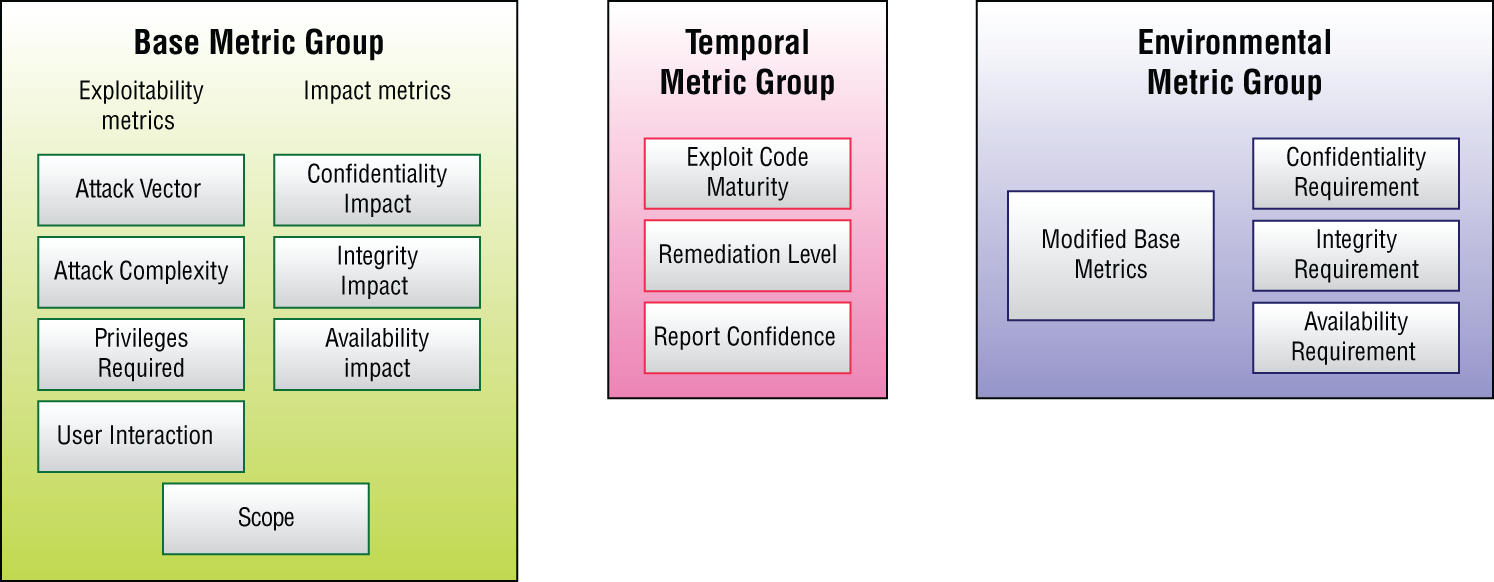
Figure 6.1: The Common Vulnerability Scoring System
Adapted from https://www.first.org/cvss.
Another useful resource for CVEs is the NVD database (nvd.nist.gov). The site is run by the U.S. government, and the data held is extremely helpful for automation purposes across a number of fields. You are encouraged to visit the home page and click one of the latest vulnerabilities to gain more insight into how the data is presented and how the common vulnerabilities lexicon is heavily abbreviated to include references such as “network” and “DoS” attack vectors for brevity. As you become more familiar with CVEs, you will see that this shorthand is extremely prevalent.
In addition, many vendors in the Cloud Native space use their own scoring methodologies; one popular vendor that does so is Red Hat. According to Red Hat, if Open Source software is shipped by multiple vendors, then CVSS Base Scores can differ from each vendor to account for different packaging methods. Combining, to name but a few, the security of built-in products, differences in configuration and software's intended use can make the scoring a moving target. To enable Red Hat's customers to make informed opinions about how serious a CVE might be, Red Hat assesses and aggregates the Base Scores to present its own scoring criteria that relates directly to its own products. This approach can be frustrating for some end users of software that operate their own in-house scoring system or strictly use the CVSS scoring directly, but it is a sane and logical approach you have to agree.
Let's continue now with less theory. There are a number of products that offer insight into what CVEs might be lurking within container images and image registries. It is safe to say, however, that not all CVE scanners are equal, and in fact even the best Open Source scanners on the market commonly report different results when scanning images. This can cause havoc if an agreed strategy is not in place and multiple scanners are used within one organization.
Note also that some CVE scanners also come with malware detection capabilities, in which patterns are matched after reverse-engineering a container's layers. However, this feature tends to be limited to proprietary tools, which require relatively expensive intelligence feeds for their near-real-time updates. In this chapter, we will look at three extremely popular static analysis tools, Trivy, Anchore, and Clair, each of which provides a valid choice for scanning your container images. We will then look at setting up an image registry with Harbor, which automatically scans images using Clair.
Trivy
The first scanner that we will look at is Trivy (github.com/aquasecurity/trivy), produced by the security company Aqua Security, which also creates kube-hunter that we looked at in Chapter 5, “Kubernetes Vulnerabilities.” We will start by looking at the various ways that we can install Trivy and then use a container to run it for ease.
For the package installation of Trivy, you would follow the install commands shown here, ideally putting the long lines on one line each, on Debian derivatives as the root user:
$ apt-get install wget apt-transport-https gnupg lsb-release$ wget -qO- https://aquasecurity.github.io/trivy-repo/deb/public.key| sudo apt-key add -$ echo deb https://aquasecurity.github.io/trivy-repo/deb $(lsb—release-sc) main | sudo tee -a /etc/apt/sources.list.d/trivy.list
Then, having added the Trivy repository to your package manager's sources, you should update the local package lists and install the trivy package as so:
$ apt-get update$ apt-get install trivy
There are also other installation methods, including Homebrew for Macs, compiling from source, and Arch Linux options. For Red Hat Enterprise Linux installations, you are encouraged to add the following content to this file:
$ cat /etc/yum.repos.d/trivy.repo[trivy]name=Trivy repositorybaseurl=https://aquasecurity.github.io/trivy-repo/rpm/releases/$releasever/$basearch/gpgcheck=0enabled=1
Then, once that file is saved, update your local package lists in the same way, but using yum and not apt with this command before installing Trivy afterward:
$ yum update$ yum -y install trivy
Getting Started
For our testing purposes we will use the containerized version to run Trivy in true Cloud Native style. In Listing 6.1, we can see the Dockerfile that creates the container image for reference so that, for security reasons, you can see the contents of the image.
It is possible to inspect all the files that comprise the image. We will just use the prebuilt container image for ease, however. To pull the image, run this command:
$ docker pull aquasec/trivy
We will run the next command to download the image from Docker Hub and spawn a container from it in order to scan the latest nginx for CVEs:
$ docker run --rm -v /var/run/docker.sock:/var/run/docker.sock-v $HOME/Library/Caches:/root/.cache/ aquasec/trivy nginx:latest
Following some slightly unusual output, if you have not pulled down the Trivy container image before, you will notice a pause while Trivy accesses the target image and then analyzes it.
You are warned with this error that using the latest tag is a relatively lazy practice and that you will have to use the --clear-cache option to freshly scan images if you scan them more than once.
You will need a modicum of patience, but the sophisticated Trivy produces impressive results, as partly shown in Figure 6.2.
We can tell that Trivy has spotted that the base layer is Debian and there are a large number of CVEs. For comparison, a little later in this chapter, we will run our other scanning tools over the same image. The eagle-eyed will have spotted that the container run command sets up a local machine volume called Library. If we check the file sizes of that directory with the du command, it is clear that, potentially, the act of scanning a large number of images would mean that a nontrivial amount of local diskspace is required, as shown here:
$ du -h Library/Caches/trivy153M Library/Caches/trivy/db76K Library/Caches/trivy/fanal153M Library/Caches/trivy/
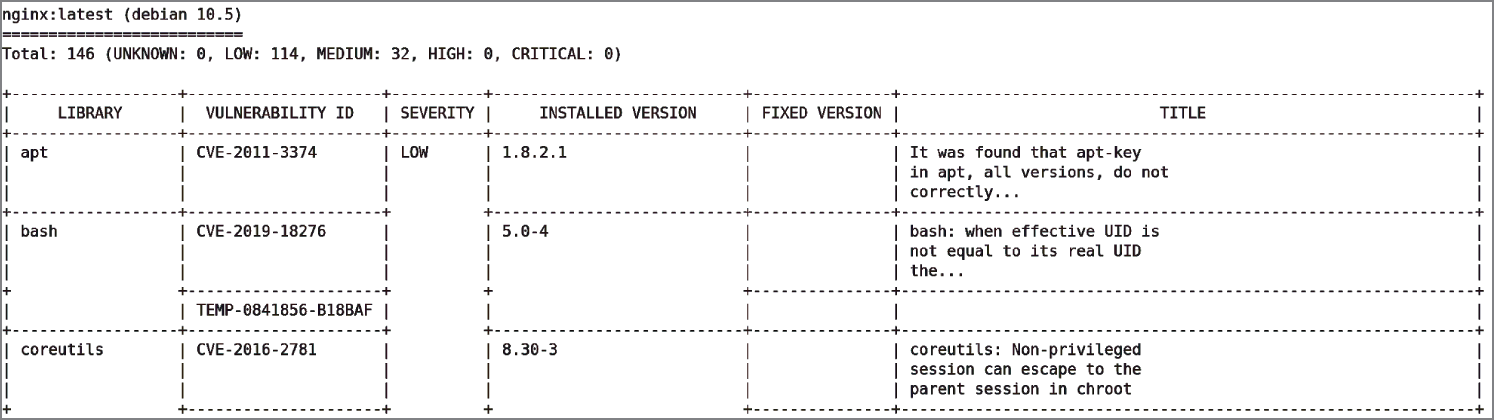
Figure 6.2: Trivy's assessment of the latest nginx container image
Other scanning tools, those particularly focused on scanning image enterprise-sized registries, need efficient ways of processing potentially tens of terabytes of image files. A common approach is to pull each image (one at a time), process it (mostly by inspecting package versions), save the metadata (whose size should be relatively nominal) somewhere such as a database, and then delete the local image immediately afterward. This way a single worker can pull, scan, and process large volumes of image data without requiring extra CPU or disk capacity or indeed overly stressing the image registry to any great extent.
The help file can be accessed to display the functionality of Trivy, with this command:
$ docker run --rm -v /var/run/docker.sock:/var/run/docker.sock-v $HOME/Library/Caches:/root/.cache/ aquasec/trivy --help
If you type i for image, followed by --help, then you are greeted with a number of image scanning options. It is recommended to at least glance through these to become familiar with the tool. That command for clarity is as follows:
$ docker run --rm -v /var/run/docker.sock:/var/run/docker.sock-v $HOME/Library/Caches:/root/.cache/ aquasec/trivy i --help
From the help output we can also see that Trivy lets you scan using the fs option for some local files, but, possibly more usefully, the option also allows you to scan images from within a container. The documentation suggests an approach like this, starting with running a simple container from an image:
$ docker run --rm -it alpine:3.11
Then, once inside the container, you can execute this first command to pull the Trivy install script down, run it, and install it to the directory /usr/local/bin, having installed the curl package first:
$ apk add curl$ curl -sfLhttps://raw.githubusercontent.com/aquasecurity/trivy/master/contrib/install.sh| sh -s -- -b /usr/local/bin
The output from the install.sh script, inside the container, looks like this:
aquasecurity/trivy info checking GitHub for latest tagaquasecurity/trivy info found version: 0.10.2 for v0.10.2/Linux/64bitaquasecurity/trivy info installed /usr/local/bin/trivy
We can then run this command:
$ trivy fs /
This will ask Trivy to scan the container image, while it is running, from within the container itself. The Alpine container in our example offered these headline results, which is comforting:
705405408b39 (alpine 3.11.6)============================Total: 0 (UNKNOWN: 0, LOW: 0, MEDIUM: 0, HIGH: 0, CRITICAL: 0)
We can compare that to a Redis image, using the following command to get a prompt once the container is running:
$ docker run --rm -it redis bash
Using this command shows that Redis is based on Debian:
$ cat /etc/os-releasePRETTY_NAME="Debian GNU/Linux 10 (buster)"[..snip]
In Debian we need to update the package list first as follows:
$ apt update
Then, we can install the curl package again:
$ apt install curl -y
After a little while, all the dependencies are installed for curl, and we can then run the install script command again:
$ curl -sfLhttps://raw.githubusercontent.com/aquasecurity/trivy/master/contrib/install.sh| sh -s -- -b /usr/local/bin
Finally, execute the scan again:
$ trivy fs /
Such an approach would be useful if embedded as part of CI/CD pipeline tests (more on this in a moment) or if certain containers were used as utility containers, for example, to provide access to the AWS CLI. Or suppose a container is used to embed a specific binary, which was easy to containerize; it would then be prudent to check these containers for CVEs each time the latest version of the binary was upgraded in the upstream repository.
Generally speaking, larger container images will be guilty of having more lines of code present, and that will therefore result in a greater risk and a higher number of CVEs. The secondary effect is therefore more admin time being required to remediate them. Smaller container images are always preferable for production workloads. The Redis scan's output is as follows:
bde86618030f (debian 10.7)==========================Total: 128 (UNKNOWN: 0, LOW: 90, MEDIUM: 6, HIGH: 30, CRITICAL: 2)
Note that this is the same operating system (OS) as the first test we ran against the nginx container image that we scanned. We can see that Redis totals 128 CVEs as opposed to nginx having 149 vulnerabilities that were discovered.
Besides the previous methodology, Trivy offers a simple approach for CI/CD automation. It is possible to embed a few lines within your Dockerfiles in order to run scans.
The code in Listing 6.2 shows how to do almost precisely what we did earlier when installing the curl package.
If we build an image from the Dockerfile (in this case using the docker build command), then we can scan images during the container image creation process effectively. Note, in Listing 6.2, that relative to the previous scan we are focusing on an older version of Alpine Linux on purpose for comparison.
In Figure 6.3 the results of the scan show that the older version of Alpine has a high vulnerability.
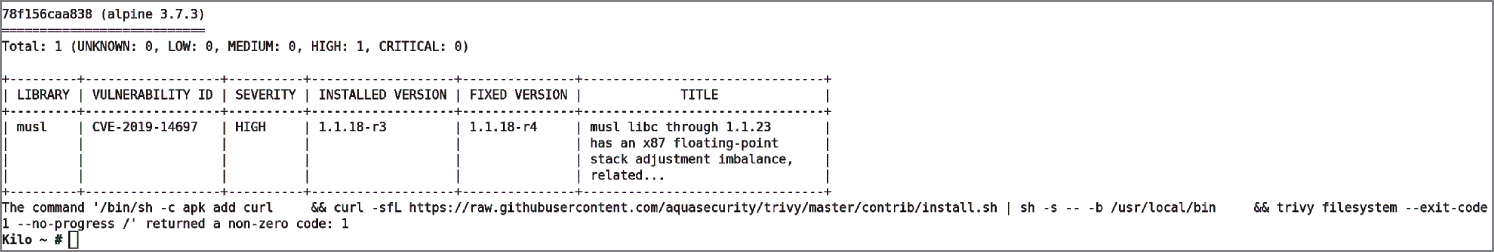
Figure 6.3: Older versions of images tend to flag more issues, as you'd expect.
By looking up the CVE mentioned here, CVE-2019–14697, we can see precisely what the problem is and ideally how to remediate that CVE. We can easily search for this CVE online. In this case, although the CVE website (cve.mitre.org/cgi-bin/cvename.cgi?name=CVE-2019–14697) also appeared near the top of the results, the first result using a popular online search tool is via NIST: nvd.nist.gov/vuln/detail/CVE-2019–14697. At the bottom of that NIST page, the “References to Advisories, Solutions, and Tools” section offers helpful suggestions for fixing the issues; it is worth a look to get used to how CVEs are reported and documented.
It is worth noting that not all vendors are equal when it comes to patching vulnerabilities and fixing issues within container images. There are some vendors that constantly iterate, adding and improving software using short development cycles. Others can take months and occasionally years to get around to it. When you are faced with mitigating an issue and make a change to an image in order to suit your own estate's security needs, be certain to carefully log the changes and check whether you have breached a vendor's license before doing so. Additionally, there is usually little point in remediating an issue if the vendor has done so already; you might just confuse the situation and cause other unforeseen security or stability issues in the future. Indeed, certain CVE scanners have clever insight, via intelligence feeds, into whether an upstream vendor fix is available to remedy a CVE and will only report CVEs when an upstream fix is made public by a vendor. This can be a risky business if you know some vendors only patch their images every few months or longer.
That said, when faced with having to remediate hundreds of CVEs on a containerized estate, spotting the note that an issue has been fixed already (upstream, by the vendor) can be a welcome relief. In Figure 6.3, such an entry is mentioned: it should be possible to remove this issue if you upgrade the package within your Dockerfile to version 1.1.18-r4.
For further automation methods, another nice addition to Trivy is being able to scan code repositories directly using the repo switch. The documentation provides you with an example repository to scan:
$ trivy repo https://github.com/knqyf263/trivy-ci-test
The output shows that the scanner looks for .lock files, which contain software versions that can be checked against for CVEs. Two such abbreviated outputs are as follows:
Pipfile.lock============Total: 17 (UNKNOWN: 2, LOW: 0, MEDIUM: 7, HIGH: 4, CRITICAL: 4)Cargo.lock==========Total: 8 (UNKNOWN: 8, LOW: 0, MEDIUM: 0, HIGH: 0, CRITICAL: 0)
Note that the repo switch with Trivy applies only to public code repositories.
We have barely scratched the surface of the features that Trivy can support.
The documentation contains a section on CI/CD and provides example Travis, GitLab CI, and CircleCI tests so that your build will fail if a vulnerability is discovered. Dependent on your preferred pipelining software it would be worth reading further about how to integrate the tool into your pipeline.
Exploring Anchore
The next tool we will look at is called Anchore (anchore.com/opensource). The Open Source version is designed for deep container image inspection and finding CVEs. In Anchore there is also functionality to enable the prevention of unwelcome, insecure images that are found with vulnerabilities being promoted into image registries. This is clearly the optimum way of dealing with scenarios where a registry exists in multiple environments, and CI/CD pipelines are used for testing prior to promotion of images into the production registry.
Anchore is clever enough to delve deeply into various types of files: from Ruby, Java, and Node. There is also the option to create custom policies so that pipelined builds will fail if policies are not complied with. Using such policies, it is also possible to prevent images being deployed into orchestrators such as Kubernetes, which is a valuable addition to Anchore's functionality.
The preferred installation method for Anchore is using Docker Compose. Created by Docker Inc., it is a tool that makes it possible to bundle multiple instructions into a single installation script to spawn multiple containers as interlinked services with relative ease. For clarity, you still have to create container images from Dockerfiles as usual. In other words, do not get this confused with a Dockerfile.
To download the docker-compose.yaml, which comes in at 146 lines in length, use this command:
$ curl https://engine.anchore.io/docs/quickstart/docker-compose.yaml> docker-compose.yaml
There are a few sections within the file whose purpose should become clearer when we create the containers noted within it. At the bottom of the file is a commented-out section that informs the user that removing the comments will fire up an instance of Prometheus to gather useful metrics from Anchore, some of which you may find useful.
To bring up the resources within the Compose file, once you have Docker Compose installed using these instructions https://docs.docker.com/compose/install, we run this simple command in the same directory:
$ docker-compose up -d
If you look closely during the process of services starting up, you will see that a PostgreSQL database and the Anchore Engine container images are pulled down locally, and then other resources are created. To check that the installation worked, try this command:
$ docker-compose ps
In Figure 6.4 we can see the names of the running containers on the left and other familiar information in the other column such as network ports being exposed on the right.
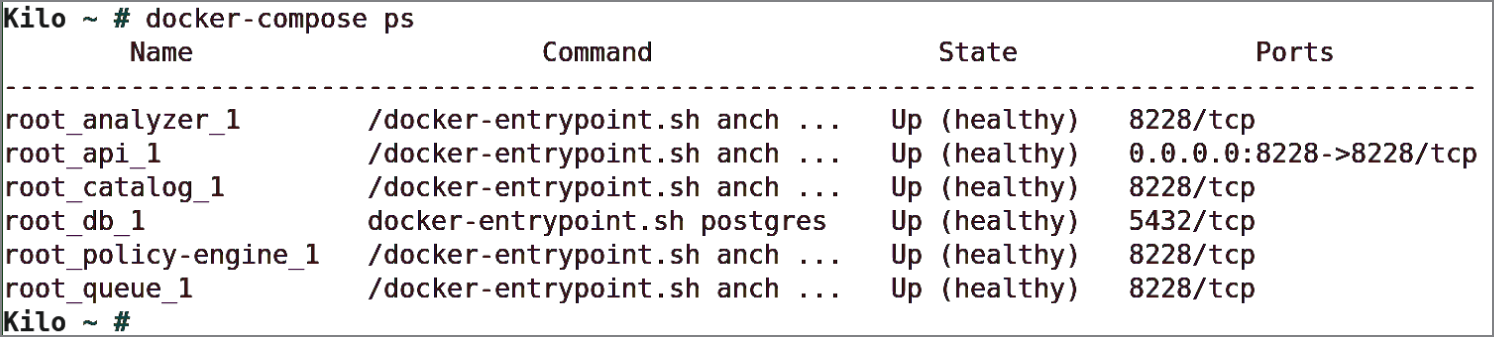
Figure 6.4: Anchore is up, courtesy of Docker Compose.
Another useful command that offers a sanity check on the status of the required Anchore Engine services is this:
$ docker-compose exec api anchore-cli system status
The output assures us that things are working as expected and provides version information, which is useful for troubleshooting:
Service apiext (anchore-quickstart, http://api:8228): upService catalog (anchore-quickstart, http://catalog:8228): upService simplequeue (anchore-quickstart, http://queue:8228): upService analyzer (anchore-quickstart, http://analyzer:8228): upService policy_engine(anchore-quickstart, http://policy-engine:8228): upEngine DB Version: 0.0.13Engine Code Version: 0.8.0
One more command that you should familiarize yourself with is checking that the latest vulnerability data has been synced to your local machine. The documentation warns that the initial run of Anchore Engine will take a bit longer to complete this process. On a slow machine with very slow connectivity, it can take hours as opposed to minutes. Use this command to check the vulnerability status:
$ docker-compose exec api anchore-cli system feeds list
Expect the output from that command to be lengthy as the sophisticated Anchore updates all of its latest threat information. A successful update will have a timestamp of sorts, heavily abbreviated here:
Feed Group LastSync RecordCount[..snip. . .]github github:python pending Nonenvdv2 nvdv2:cves pending Nonevulnerabilities alpine:3.10 2020–08–16[. . .snip. . .] 2016
We can see that Alpine Linux has updated its CVEs, but other syncs are still required.
You should wait until the rightmost column, depicting the number of records, is nonzero on each line of that command before proceeding. Thankfully, you will not have to wait for the initial period again as these records are cached and reused the next time Anchore is fired up.
The next command allows you to verify that the engine is ready to use; it will give feedback about the progress of the threat feed updates and stop you from proceeding if the threats have not synced yet:
$ docker-compose exec api anchore-cli system wait
After a little patience and CPU fan whirring, you can see lines of output further down the list completed as so:
vulnerabilities debian:10 2020–08–16T13:19:58.223993 23334
The last command we ran, the system wait command, will output this when the process has finished:
Feed sync: Checking sync completion for feed set (vulnerabilities)..Feed sync: Success.
It is easy to see why this process takes a while when you see that one OS alone has 23,334 issues to pay attention to.
We can now start using Anchore to scan the same nginx image that we tested using Trivy earlier, with this command:
$ docker-compose exec api anchore-cli image adddocker.io/library/nginx:latest
The slightly abbreviated output from that image add command begins with the following, showing not_analyzed
:
Image Digest: sha256:179412c42fe3336e7cdc253ad4a2e03d32f50e3037a860cf5Parent Digest: sha256:b0ad43f7ee5edbc0effbc14645ae7055e21bc1973aee5150Analysis Status: not_analyzedImage Type: docker
We can pull the image for analysis and check the status of the process with the following command:
$ docker-compose exec api anchore-cli image getdocker.io/library/nginx:latest | grep 'Analysis Status'
And, following the output showing Analysis Status: analyzed, we can then list its vulnerabilities this way:
$ docker-compose exec api anchore-cli image vulndocker.io/library/nginx:latest all
The output is too lengthy to display here. To sort through it to find the wheat in the chaff, we need to enter the next command, which shows us that the total number of unique CVEs is 61:
$ docker-compose exec api anchore-cli image vulndocker.io/library/nginx:latest all | awk '{print $1}'| sort -u | grep -v Vulnerability | wc
The following command demonstrates that we can list images with which we have run the add command. We can also show their scanning status:
$ docker-compose exec api anchore-cli image listFull Tag Image Digest Analysis Statusdocker.io/library/nginx:latest sha256:[..snip. . .] analyzed
In Figure 6.5 we can see the top of the output without counting the CVEs.
Of the findings related to the nginx: latest image, there are 4 CVEs with Unknown status, 52 Negligible (or Low) status, and the 2 Medium CVEs, as shown in Figure 6.5.
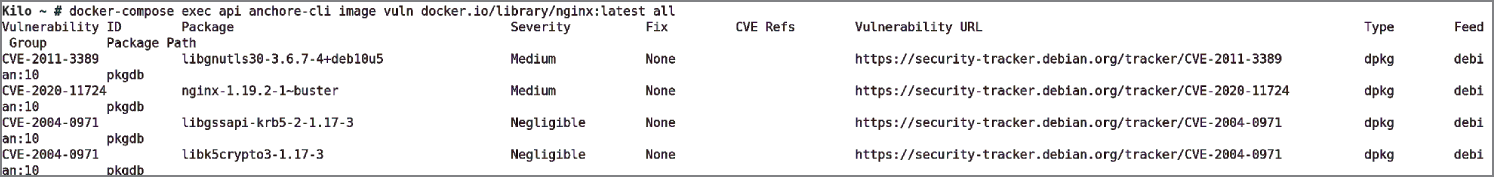
Figure 6.5: Only 2 medium-ranked CVEs have been found by Anchore, but 52 low, or negligible, CVEs have been discovered.
If we compare that to the CVEs that Trivy discovered, which totaled LOW: 107, MEDIUM: 7, HIGH: 32, CRITICAL: 3, we can see the difference in results between Trivy and Anchore. As suspected, they differ in a nontrivial way. When scanning container images, it is worth repeating that as part of your strategy you should pin your colors to the mast of one variety of scanner, one that you trust will output reliable results. It does no harm to test images using other scanners periodically of course in order to test the performance of your scanner of choice. Using multiple scanners causes moving-goalposts syndrome, however, which can soak up time unnecessarily.
As a result of the blatant difference in vulnerability findings between tools, it is advisable that you employ multiple CVE scanning tools initially and really understand their output to help improve your image scanning strategy. Creating in-house policies is one way to track previous issues that you have resolved and additionally makes it quicker to respond, by adjusting or copying existing rules, when new issues arise.
Anchore describes how it goes about dealing with vulnerability scanning as the following process:
- Pull the image down from the relevant image registry.
- Delve deeply into the image using analysis techniques and save generated metadata for future reference in the database.
- Check the results of the analysis against any custom policies.
- Periodically synchronize the threat feeds and recalculate any pertinent changes in the vulnerabilities found from the upstream feeds.
- Inform users of new findings and policy matches that might be useful.
The last two steps, in which Anchore updates threat feeds and informs users of changes, are periodically run on a schedule to keep results as fresh as possible. New CVEs are discovered over time, so regular updates are an important part of maintaining a robust security posture.
You are encouraged to use the noncommercial version of Anchore in either of two distinct ways. First, you can run it interactively, on an ad hoc, as-needed, basis, so that manual scans are performed by querying the APIs. Alternatively, you can use what is called watch mode. Here, you configure various registries, and any repositories (which can also be granularly separated by image tags) that receive new images are then automatically subject to the methodical querying process listed earlier.
By offering two such pieces of functionality, the vendor aims that all your image scanning needs are suitably met. You can have a constant, round-the-clock monitoring system running on image registries, with manual scans also available, which could potentially be incorporated into CI/CD pipelines.
The Open Source version is most easily accessed via the command line. Here you can extract any of the following information:
- Metadata from scanned images
- Files within the images
- Vulnerability data
- Historically discovered image information
- Whether images match any configured policies
Policies are an important part of preventing tainted images from being promoted upstream into production image registries. The key piece of information to expect from a policy's rules being tested is whether the status is PASSED or FAILED. The latter might involve a number of STOP errors, and both can equally show WARN findings. The intricate details of the tests that a policy comprises can be found here: docs.anchore.com/current/docs/overview/concepts/policy/policy_checks. The list is impressive and shows, for example, that reverse-engineered Docker files can sometimes be checked if the image layers can be inspected sufficiently. In Table 6.1, we can see some of the criteria that policies can be matched against.
Table 6.1: Policy Matching Criteria That Anchore Can Use Within Its Policies
| CRITERIA | PURPOSE |
|---|---|
| Dockerfile inspection |
Reverse engineered or supplied Dockerfile checking using checks such as FROM and exposed network port instructions |
| File checking | Searching within included files for regex, certificates, and loose, insecure file permissions |
| Password files | Inspects /etc/passwd for blacklisted users, groups, and shells |
| Packages | Tests whether a package must exist within the image or not, for example |
| Vulnerabilities | Matches certain packages, CVSS scores, or if a fix is available, for example |
| Licensing | Blacklists unwanted licenses being included |
| Ruby | Looks for Ruby Gems and if it is official, for example, or does not meet a specific version |
| Node and npm | Trusts various version and blacklist others amongst other criteria |
| Secrets | Hunts for sensitive data such as access and secret keys for AWS; checks using regular expressions on files and directories too |
| Metadata | Compares matches for OS, distribution or hardware, or image size |
| Always | Stops the processing in its tracks if certain unwanted images or other resources are found within an image |
| Retrieved Files | Looks for specific configuration files, for example, and if the file contains content, match against that |
| Malware | Flags any malware findings found within an image |
As Table 6.1 demonstrates, the granular approach to policies that Anchore provides makes them exceptionally powerful. The features are certainly worthy of accolade when it comes to Open Source functionality, especially considering that functionality comes from a commercial vendor.
Finally, there is also a Jenkins plugin that has a dedicated page (plugins.jenkins.io/anchore-container-scanner) in the documentation. Note that older versions may suffer from storing the credentials (used to access the API) in plain text and should be deprecated in favor of the newer versions. The plugin looks useful and can be run within Freestyle or Pipeline jobs and, once run, provide the expected “pass” or “fail” status depending on whether the image meets preconfigured rules. You are encouraged to check this page for more information on the subject:
www.jenkins.io/doc/book/managing/plugins/#from-the-web-ui
You will need to run this command to get further help about the policies used in Anchore:
$ docker-compose exec api anchore-cli policy --help
Listing 6.3 displays what to expect from its output.
If we change the --help to list at the end of the previous command, then we can see which policies Anchore is aware of. The output is as so:
Policy ID Active Created Updated2c53a13c-1765[..snip. . .] True [. . .snip. . .] 2020–08–16T13:10:05Z
Another nice feature from Anchore is the Policy Hub. We can list what is available in the Policy Hub like this, with more detail displayed in Table 6.2:
$ docker-compose exec api anchore-cli policy hub list
Table 6.2: The Policies Available from the Policy Hub
| POLICY NAME | PURPOSE |
|---|---|
anchore_security_only
|
A single policy to help demonstrate whitelisting and blacklisting images’ packages using their name |
anchore_default_bundle
|
A stock policy bundle that is a mixture of checking Dockerfiles and best-practice warnings |
anchore_cis_1.13.0_base
|
Based on parts of the CIS 1.13.0 benchmark where some customization is required by the user |
Using one of the policy names displayed within Table 6.2, we can now install the CIS Benchmark policy as so:
$ docker-compose exec api anchore-cli policy hub installanchore_cis_1.13.0_base
And, having done that, rerunning this command will confirm it installed as hoped:
$ docker-compose exec api anchore-cli policy list
The CIS policy is much more compliance-orientated and not CVE-related. It is an excellent addition to firming up your image scanning strategy.
Let's add another image to Anchore and run a scan against that using the CIS-based policy to check its compliance. Start with the add image command as we saw before:
$ docker-compose exec api anchore-cli image adddocker.io/library/redis:latest
If we append | grep Analysis Status to the end of that command, we will see that the image has not been analyzed just yet.
Or, programmatically within a CI/CD pipeline, you can use this command to wait for the analysis to complete as mentioned earlier:
$ docker-compose exec api anchore-cli image waitdocker.io/library/redis:latest
Once that command returns with an analyzed status, we can then run the scan against the CIS policy that we installed a moment ago:
$ docker-compose exec api anchore-cli evaluate checkdocker.io/library/redis:latest—policy anchore_cis_1.13.0_base—detail
And, unfortunately, for the example Redis image, the output is extensive and too much to list here, although NEGLIGIBLE results are by far the majority of the findings luckily.
The top of the output confirms that if that image was built within a CI/CD pipeline based on that policy it was checked against, it would have received a fail status.
Image Digest: sha256:cd28cf26cc2d9960c964917d2aa97ea2110a050dfed8c8Full Tag: docker.io/library/redis:latestImage ID: 1319b1eaa0b7bcebae63af321fa67559b9517e8494060403d083bb350Status: failLast Eval: 2020–08–16T16:32:55ZPolicy ID: anchore_cis_1.13.0_baseFinal Action: stopFinal Action Reason: policy_evaluation
Further down the output on the left side we can see that the Gate column relates to the criteria listed within Table 6.1. Examples within the CIS policy include dockerfile, files, and vulnerabilities.
It should be clear now how useful such policies can be when it comes to improving your image scanning. To add user-specific tweaks to policies, you can find the JSON file containing a policy, copy the bundle that includes the policy, and add the new policy bundle to suit your requirements.
Clair
Another popular Open Source scanner is Clair (github.com/quay/clair). Touted as a static analysis tool, its raison d'etre is entirely based around scanning container images.
Although it is a battle-hardened piece of software used within many CI/CD pipelines, at the time of writing, the tool is being repackaged. This is because the company that created it, CoreOS (coreos.com) was acquired by Red Hat in 2018. CoreOS is famous for a number of products such as the rkt (coreos.com/rkt) runtime and the pervasive etcd (etcd.io), the distributed key:value store found in most Kubernetes distributions. As a result of this acquisition, CoreOS's product portfolio has been, and is apparently still, being integrated with Red Hat's, and Clair is being refactored as a result. To keep abreast of updates in this space, follow this page: www.redhat.com/en/topics/containers/what-is-clair.
As a stand-alone CVE scanner, Clair consists of three components, and it can be spun up using Docker and Docker Compose. The innards include a PostgreSQL database, the Clair server, and the Clairctl scanner. The scanner hooks into the server and has the ability to output reports in HTML after scanning has finished. If you are interested in exploring Clair further, this page will give you the route to do so using Docker Compose: searchitoperations.techtarget.com/tutorial/How-to-scan-Docker-images-for-vulnerabilities-with-Clair. If you compile components locally, then you are likely to need Go v1.11+ as a minimum. There are releases that you are encouraged to look at while Clair's integration continues in the meantime, here: github.com/quay/clair/releases.
Secure Registries
For completeness, to finish the nginx CVE scanning result comparisons, we will choose a different approach to seeing Clair in action. The approach that we will use also affords us the chance to look at an outstanding piece of Open Source software called Harbor (goharbor.io). The Harbor marketing strapline is as follows: “Our mission is to be the trusted Cloud Native repository for Kubernetes.”
For any organization that does not want data to be stored publicly because of security concerns, a localized image registry is a key component in a container image strategy. The benefits include higher image-pull speeds, thanks to faster connectivity, and greater control over how the API and front end of a registry are made accessible.
Harbor is a fully functional, extensible, and aesthetically pleasing container image registry with a difference. Its features include fine-grained access control permissions per repository, repository quotas, tag retention policies, image signing capabilities, automated or manual vulnerability feed updates, and built-in CVE scanning, which can be scheduled or manually triggered. It also offers an API, a UI, and the ability to replicate images stored within other registries to assist when you migrate to using it as your main registry. We will look at some of those features in a little more detail shortly.
The installation process begins with two options. We will look at the Ubuntu 18.04 automated installation approach (the slightly older Long Time Support [LTS] version), as opposed to the piecemeal approach. Take note that, as you would expect for a self-hosted registry, disk space needs to be provisioned correctly (or be dynamically resized); and for Harbor to run smoothly, four CPU cores and 8GB of RAM are encouraged. Results gleaned from using less CPU and RAM suggest this is a sensible specification that should not be deviated from; otherwise, you risk unexpected results such as automated scanning not completing or out-of-memory errors showing up in the logs. We will go for 160GB of disk space, in addition to the suggested CPU and memory.
If you are using a cloud server with the suggested Ubuntu version installed, the process is as follows using the root user.
To begin, we will take a raw copy of this GitHub gist: gist.githubusercontent.com/kacole2/95e83ac84fec950b1a70b0853d6594dc/raw/ad6d65d66134b3f40900fa30f5a884879c5ca5f9/harbor.sh.
Then we will create a file named something like install_harbor.sh, save it in the root user's home directory, and make it executable:
$ chmod +x install_harbor.sh
The installation instructions (https://goharbor.io), which may change subtly over time, are not what to follow at this stage. Instead, you should first execute the script with this command:
$ ./install_harbor.sh
After you have waited patiently for a few minutes while watching Docker output, you will be dutifully informed that the installation is complete. However, we have not quite finished, and you should now enter the harbor directory and look for the harbor.yml.tmpl file. First, rename the file as follows:
$ cd harbor$ mv harbor.yml.tmpl harbor.yml
Now we need to edit it a little. There is a relatively simple way of securing the Harbor installation using TLS certificates (under the https section within that file), but for our purposes we will continue with HTTP only. It should be obvious which three lines you need to comment out for HTTPS to be ignored at this point. The second and third lines just relate to certificate and private key paths. Look for the mention of https, and the lines are easy to spot.
Having made those edits, we will restart the installation script using these commands:
$ cd .$ ./install_harbor.sh
Rather than stopping at the same point as before, you should be pleasantly surprised at how quickly the previous sections of the installation complete and then watch as more Docker output is displayed to help finalize the installation.
When it is completed, you are shown the following with either your IP address or server hostname, depending on your choice at the start of the installation:
Please log out and log in or run the command 'newgrp docker'to use Docker without sudoLogin to your harbor instance:docker login -u admin -p Harbor12345 123.123.123.123
We will ignore that instruction but instead go into the UI by visiting this address in a browser (replacing the IP address of hostname for the installation from here on in): 123.123.123.123.
Using the login and password, we should be presented with an impressive-looking dashboard. Under Projects on the left side, we will choose + New Project on the right side, click it, and call our project cloudnativesecurity
.
Then, from a different machine (as if we were developing on that machine and pushing images up to a registry remotely), we will run these commands to emulate a developer's experience:
$ docker login -u admin -p Harbor12345 123.123.123.123Login Succeeded.$ docker pull nginx:latest$ docker tag nginx:latest123.123.123.123/cloudnativesecurity/nginx:latest$ docker push 123.123.123.123/cloudnativesecurity/nginx:latest
After a few minutes, depending on your bandwidth, the pushed image should be available in our full-featured registry. Clearly, we need to avoid using the admin user and change its default password as soon as possible. Still under Projects on the left, if we enter the cloudnativesecurity repository and to see Clair in action, click the nginx image and then Scan, we can see the result shown in Figure 6.6.
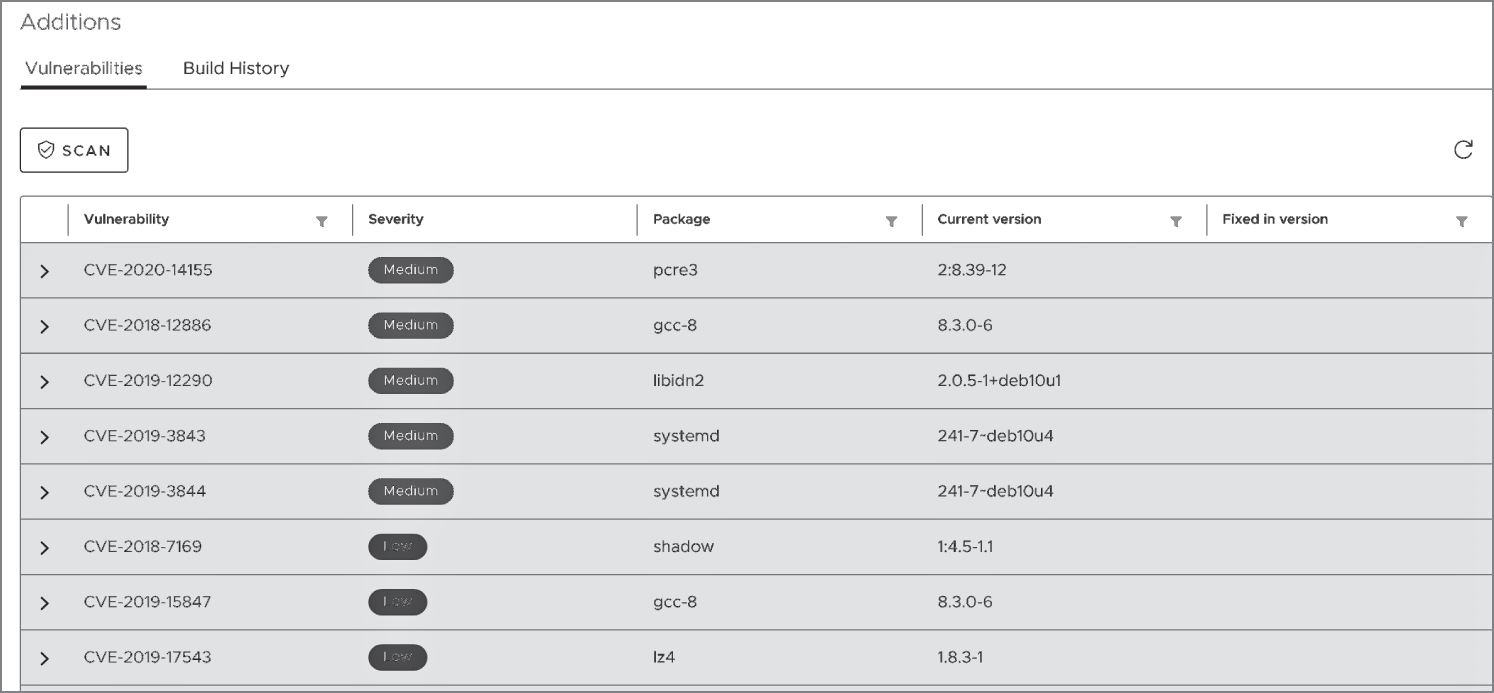
Figure 6.6: Harbor has the excellent Clair CVE scanner built-in.
As Figure 6.6 shows, Clair has determined that nginx has a number of CVEs, some of which are classed as Medium severity.
In Figure 6.7 we can see a suitable summary of the types of CVEs that were found.
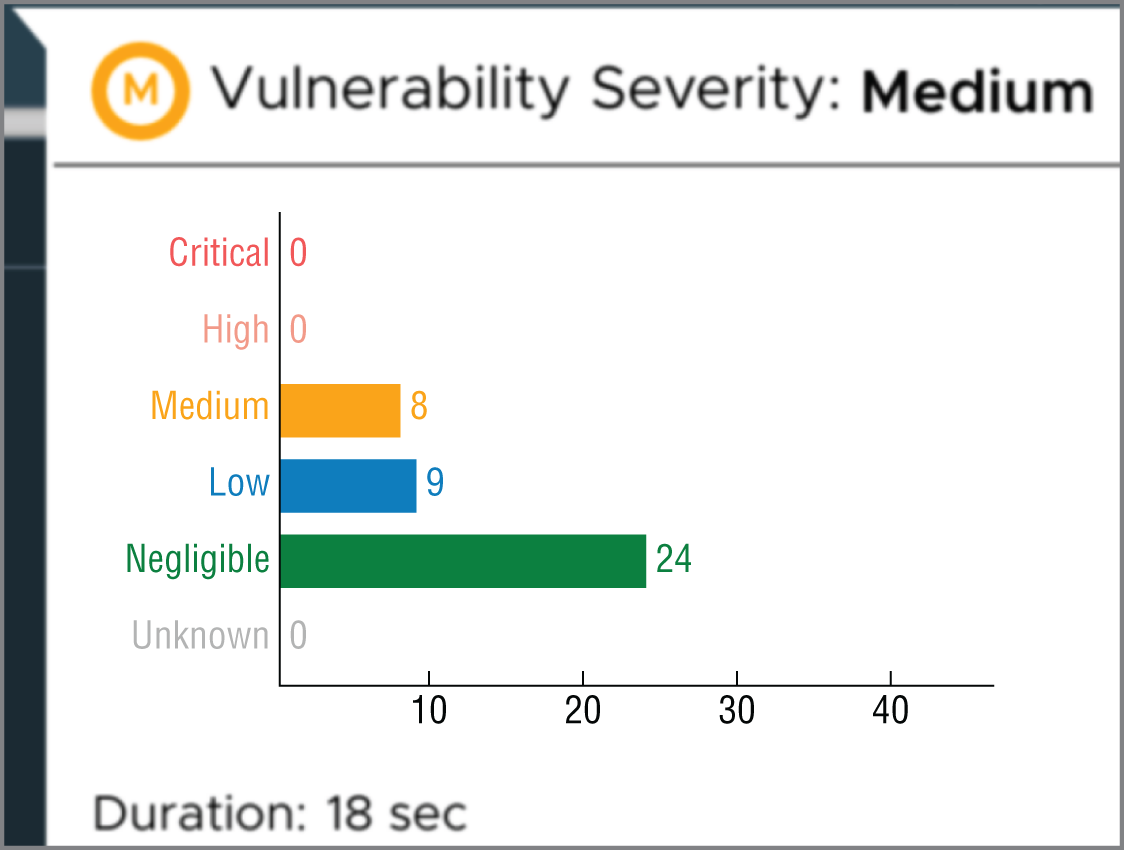
Figure 6.7: Different scanning results again for the nginx container image
As Figure 6.7 demonstrates, there are yet again differing results from our CVE scanners earlier in the chapter.
In addition to linking to the relevant CVE websites for each issue, another nice touch from Harbor is the ability to clearly inspect the layers of each image in the UI. In Figure 6.8 we can see a reverse-engineered Dockerfile, with various Dockerfile instructions such as COPY, ENV, and CMD.
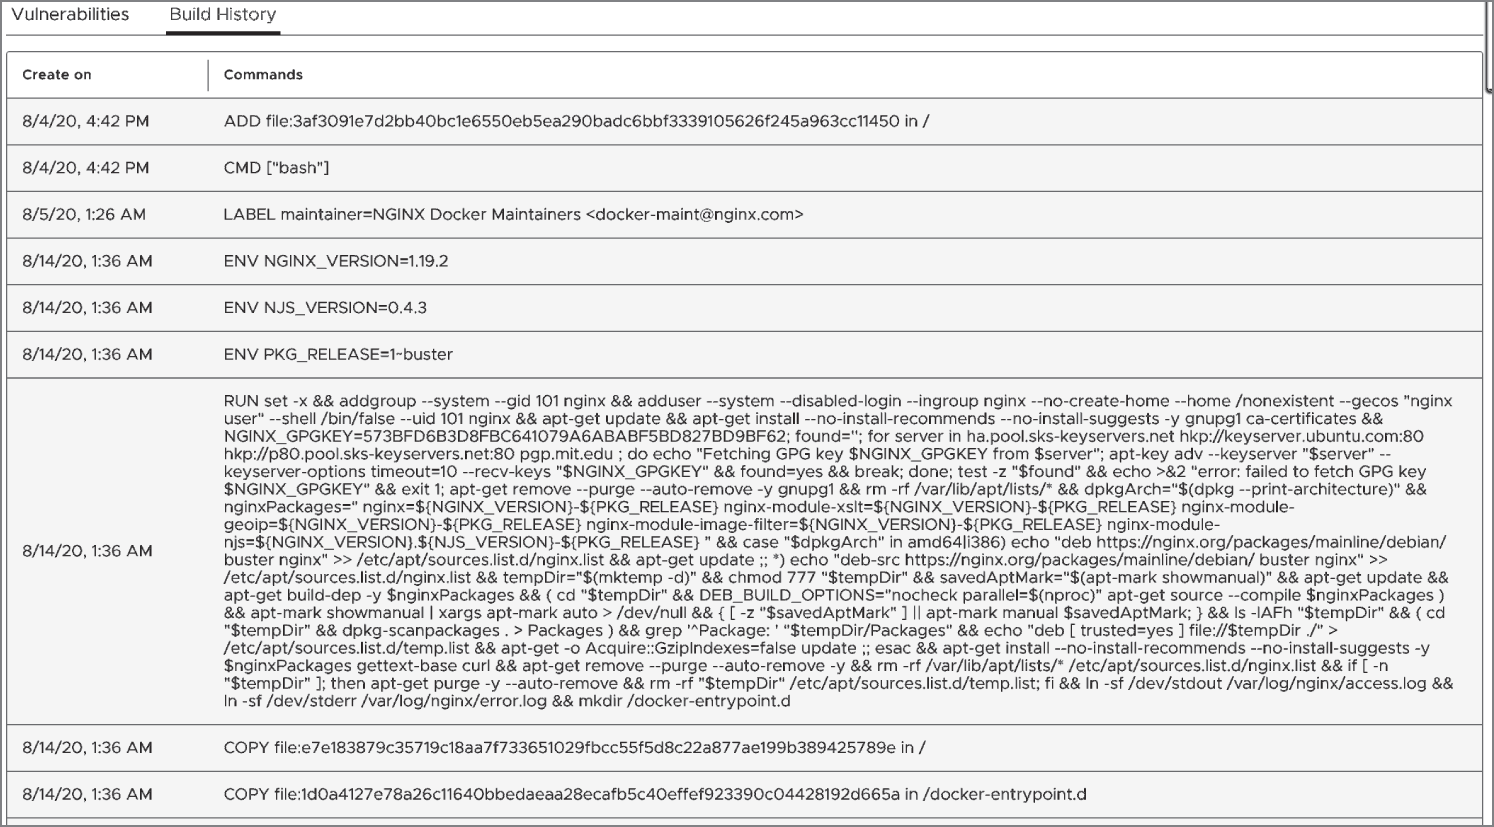
Figure 6.8: Harbor lets you inspect the layers of your images with ease.
Thoroughly inspecting the layers of each image should make the remediation of CVE issues easier to understand. Focusing on a layer at a time means the resolution can be much more methodical. Although some images contain obfuscated binaries, this approach is time-saving; and with the fixable flag in the summary of CVEs, you can immediately see which CVEs the upstream vendor has made it much easier to fix by providing a package version upgrade in the container image.
You are encouraged to spend some more time with Harbor, not only for its built-in CVE scanning capabilities, which are extensible and can hook into other scanners with relative ease, but to get used to the other features that are plentiful.
Starting with a repository, such as the one we created called cloudnativesecurity, you could do worse than to create a less-privileged user and associate it with the repository. Having done that and allocated a specific quota to the repository, you could experiment with creating a custom label with a name such as MustFix and apply it to an image. And, having gotten more used to that functionality, you could look at automatically pruning certain image tags, after a specific retention period for the purposes of good housekeeping.
Summary
In this chapter, we looked at three particularly useful tools for scanning container images. The first, Trivy, is the newest of the three and appears to be gaining traction due to its simplicity. The second, Anchore, is well established and equally sophisticated.
With the third tool, Harbor, we took the functionality a little further and extolled the virtues of the type of features that you should look for within a secure image registry. Having the ability to store and scan container images automatically with such a well-refined Open Source tool means that Harbor is also well worth a closer look at. The considered features in addition should make the tool future-proof and a valuable asset to any Cloud Native estate.
As mentioned throughout the chapter, the tools each gave a different result when we scanned the same nginx image. And, no doubt, other scanning tools would also have a different perspective. For this reason, it is advisable to try different tools that suit your needs. As we have seen, Open Source tooling can be utilized within CI/CD pipelines for greater visibility into the vulnerability and compliance issues that your container images suffer from very effectively.