
Chapter 9
A SUSTAINABLE BANK BUSINESS MODEL: CAPITAL, LIQUIDITY AND LEVERAGE
The global financial crisis has had the effect of making all participants in the banking industry – from regulators, central banks and governments to bank boards, directors and trade associations – undertake a fundamental review of the principles of banking. Issues such as capital and liquidity management as well as systemic risk became the subject of renewed focus. In practical terms, legislators realized that they needed to address the issue of the ‘too-big-to-fail’ bank, and this issue remains unresolved.
From the point of view of bank practitioners, the most important task is to address the issues of capital, liquidity and risk management and work them into a coherent strategy that is designed to produce sustainable returns over the business cycle. In this chapter we discuss these topics and consider how bank strategy can be formulated to handle the changed requirements of the post-crisis age. The contents are laid out as follows:
- bank business models
- strategy
- corporate governance
- liquidity risk and the liquid asset buffer.
We conclude with a view on sustainable banking.
The new bank business model
The basic bank business model has remained unchanged ever since banks became an integral part of modern society. Of course, as it more of an art than science, the model parameters themselves can be set to suit the specific strategy of the individual bank, depending on whether the strategy operates at a higher or lower risk–reward profile. However, the basic model is identical across all banks. In essence, banking involves taking risks followed by effective management of that risk. This risk can be categorized as follows:
- managing the bank’s capital;
- managing the liquidity mismatch – a fundamental ingredient of banking is ‘maturity transformation’, the recognition that loans (assets) generally have a longer tenor than deposits (liabilities).
If we wished to summarize the basic ingredients of the historical bank model, we might describe it in the following terms:
- Leverage – a small capital base is levered up into an asset pool that can be 10 to 30 times greater (sometimes even higher).
- The ‘gap’ – essentially, funding short to lend long – is a function of the conventional positive-sloping yield curve and dictated by recognition of the asset–liability mismatch noted above.
- Liquidity – an assumption that a bank will always be able to roll over funding as it falls due.
- Risk management – an understanding of credit or default risk.
These fundamentals remain unchanged. The critical issue for bank management, however, is that some of the assumptions behind the application of these fundamentals have changed, as demonstrated by the crash of 2007–2008. The changed landscape in the wake of the crisis has resulted in some hitherto ‘safe’ or profitable business lines being viewed as risky. Although favourable conditions for banking may well return in due course, for the foreseeable future the challenge for banks will be to set their strategy only after first arriving at a true and full understanding of economic conditions as they exist today. The first subject for discussion is to consider what a realistic, sustainable return on the capital target level should be and to ensure that it is commensurate with the level of risk aversion desired by the board. The board should also consider the bank’s capital availability and what amount of business this could realistically support. These two issues need to be addressed before the remainder of the bank’s strategy can be considered.
Bank strategy
The most important function that a bank’s board can undertake is to set the bank’s strategy. This is not as obvious as it sounds. It is vital that banks have a coherent, articulated strategy in place that sets the tone for the entire business, from the top down.
In the first instance the board must take into account the current regulatory environment. This includes the requirements of the forthcoming Basel III rules. A bank cannot formulate strategy without a clear understanding of the environment in which it operates. Once this is achieved – before proceeding with a formal strategy – the bank needs to determine what markets it wishes to operate in, what products and what class of customer. All its individual business lines should be set up to operate within the main strategy, once markets and customers have been identified.
In other words, a bank cannot afford to operate by simply meandering along, noting its peer group market share and RoE and making up strategy as it goes along. This approach, which again is evidently what many banks do indeed follow – however inadvertently – results in a senior management and board that is not fully aware of what the bank’s liabilities and risk exposures are.
The first task is to understand one’s operating environment. Then, it is to incorporate a specific target market and product suite as the basis of its strategy. Concurrent with this, the bank must set its RoE target, which drives much of the bank’s culture and ethos. It is important to get this part of the process right at the start. Prior to the crash, it was common for banks to seek to increase revenue by adding to their risk exposure. Assets were added to the balance sheet, or higher risk assets were taken on. In the bull market environment of 2001–2007 – allied to low funding costs as a result of low base interest rates – this resulted in ever higher RoE figures, to the point where it was common for even Tier 2 banks to target levels of 22% to 25% RoE in their business appraisal. This process was of course not tenable in the long run.
The second task – following on immediately from the first – is to set a realistic RoE target and one that is sustainable over the entire business cycle. This cannot be done without educating board directors as well as shareholders, who must appreciate the new, lower RoE targets. Managing expectations will contribute to a more dispassionate review of strategy. Just as importantly, risk-adjusted RoE should also be set at a realistic level and not be allowed to increase. Hence, the board and shareholders must accept that lower RoE levels will become the standard. This should also be allied to lower leverage levels and higher capital ratios.
Concurrently with the above process, a bank must also ask itself where its strengths lie and formulate its strategy around that. In other words, it is important to focus on core competencies. Again, the experience of the crash has served to demonstrate that many banks found themselves with risk exposures that they did not understand. This may have been simply the holding of assets (such as structured finance securities) whose credit exposures, valuation and secondary market liquidity they did not understand, or embarking on investment strategies such as negative basis trading without being aware of all the measurement parameters of such strategies.1 To implement a coherent, articulate strategy properly, a bank needs to be aware of exactly what it does have (or does not have) expertise for undertaking, and not operate in products or markets in which it has no genuine knowledge base.
Allied to an understanding of core competence is a review of core and non-core assets. Bank strategy is not a static process or document, but rather a dynamic one. Regular reviews of the balance sheet need to be undertaken to identify any non-core assets, which can then be assessed to determine whether they remain compatible with the strategy. If they are not, then a realistic disposal process would need to be drawn up. In the long run, this is connected with an understanding of where the bank’s real strengths lie. Long-term core assets may well differ from core assets, but this needs to be articulated explicitly. The decision on whether an asset is core or non-core, or short-term core or long-term core, is a function of the bank’s overall strategy – based on its expertise – and what markets and customers it wishes to service. This will be embedded in the strategy and the bank’s business model. This drives the choice of products and business lines to which the bank feels it can add value.
Leverage ratios
We discuss banks’ capital structures on p. 268. There is no doubt that the new model for banking assumes higher capital ratios and buffers for all banks during the next 10 years. The higher level of capital will be substantial in some cases because under the proposed ‘Basel III’ rules trading business will be required to hold up to three times as much capital as vanilla banking business. It is also evident that many bank jurisdictions will, in addition, implement leverage ratio limits.
A leverage ratio is the total value of a bank’s assets relative to its equity capital. The financial crash highlighted the extent of risk-taking by certain banks when measured using leverage ratios. As a measure of the ratio of assets to owners’ equity, they are an explicit indication of risk exposure. Lehman Brothers’ leverage ratio increased from approximately 24 in 2003 to over 31 by 2007. Such aggressive asset growth generated tremendous profits during the boom years, but exposed the bank to such an extent that even a 3% or 4% decline in the value of its assets was capable of completely eliminating its equity. As we are all aware, this duly happened.
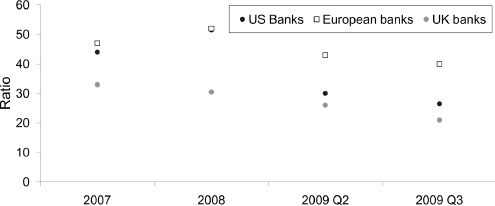
The Basel Committee on Banking Supervision (BCBS) and some national regulatory authorities are going to introduce a limit on leverage ratios as an added safety measure alongside capital requirements. In the aftermath of the crash it is accepted that bank leverage ratios have to adjust downwards, and the prevailing sentiment today dictates that boards should be wary of a business model that ramps up the ratio to an excessive level. Figure 9.1 shows levels during 2007–2009; prudent management suggests average levels will be much lower than these figures during the next 10–15 years. This is business best practice, because lower average leverage ratio levels also contribute to greater systemic stability.
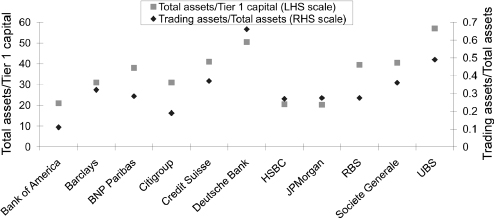
Bank management will have to adjust to the concept of an explicit ratio limit, the rationale for which is clear. The experience of the last and previous crises has shown that during a period of upside growth banks’ risk models tend to underestimate their exposure; this has two consequences: first, the bank takes on ever-greater risk as it targets greater revenue and profit during a bull market and, second, the amount of capital set aside is below what is adequate at the time the crash occurs. Figure 9.2, which shows a sample of ‘bulge-bracket’ banks, suggests that banks focused on trading assets as they expanded their balance sheets.
Figure 9.2 Selected bank ratio of total assets to Tier 1 capital and trading assets to total assets.
Source: Bank of England (2009).
In such an environment, capital ratio requirements are insufficient to safeguard against instability, and it becomes necessary to monitor leverage ratios. Hence, in the post-crash environment banks need to adjust their business strategy to allow for this constraint.
As we noted above in the case of Lehman’s, excessively high leverage results in a higher sensitivity of the balance sheet to trading and/or default losses. Limiting the amount of leverage acts as an additional risk control measure, backing up the safety net provided by a regulatory capital buffer. In advance of the introduction of a standardized ratio – as part of a future Basel III – banks can address this issue themselves as part of their prudential capital and risk management.
Note that a number of jurisdictions already employ a leverage ratio limit, although there is no uniform definition (see Table 9.1). It is likely that the new Basel III rules will incorporate a limit, along with a common definition of capital and an agreed measure of all assets, both on balance sheet and off balance sheet.
Table 9.1 Summary of selected regulatory leverage ratio limits
| Canada | Tier 1 and Tier 2 capital must be at least 5% of onbalance-sheet assets plus qualifying off-balance-sheet assets |
| Switzerland | Tier 1 capital must be at least 3% of on-balance-sheet assets less Swiss domestic lending for bank holding companies, and at least 4% for individual institutions |
| United | States Tier 1 capital must be at least 3% of on-balance-sheet assets for strong bank holding companies and at least 4% for all other bank holding companies |
| Source: Bank of England (2009). | |
Capital structure
The efficient management of capital is a vital function of bank senior management. In the aftermath of any recession, capital is of course a scarce commodity. However, this fact itself leads to one of the lessons learned from the crisis: the need for ‘countercyclical’ capital management. In other words, boards should treat capital as scarce at all times, and build up capital bases even as a bull market is helping to generate higher profits. The level of capital needs to be sufficient to cushion the fallout from ‘stress events’, which are the outlier events that normal distribution models of finance do not capture.
Contingent capital instruments can convert to equity whenever the issuing bank’s capital ratio falls below a pre-specified level. Going forward, this should be the only ‘sophisticated’ financial instrument in the bank’s capital structure. It will assist efficient capital management, as well as investor transparency, if a bank’s capital is just held in the form of simple instruments: essentially, common equity and retained profits (reserves). Of course, long-dated debt instruments can also form part of capital, but again it is more transparent if these are vanilla instruments.
Capital on its own is an insufficient protection against firm failure. This is why bank management must take additional measures, over and above capital buffers, to safeguard the institution in the event of systemic stress or other market crash events, because the capital base in isolation will be insufficient to preserve the firm as a going concern. Hence, leverage ratio limits and robust liquidity management is as important as capital buffers. A report from the Bank of England (2009) has suggested that, on average, a Tier 1 capital ratio of 8.5% would have been needed by banks to avoid falling below the Basel minimum of 4% during the last crisis. This suggests that the current requirement is far too low to act as a genuine risk-based capital reserve. Of course, a financial crisis will affect different banks in different ways; the Bank of England report goes on to state that even if all the banks in its study sample had indeed possessed a Tier 1 ratio of 8.5%, as many as 40% of these banks would still have breached their 4% limit during the crash. For some firms the ‘hindsight’ sufficient level of capital was as high as 18%.
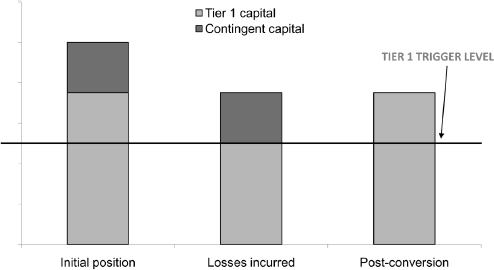
The implications of the Bank of England report are clear: minimum capital requirements must be higher and banks need to build an element of flexibility into their capital structure, perhaps by means of the contingent capital instruments discussed in Chapter 5. Contingent capital is any instrument that would convert into common equity on occurrence of a pre-specified trigger. This is illustrated in Figure 9.3. An issue of bonds by Lloyds Banking Group in 2009, called ‘enhanced capital notes’, was of this type. Such instruments enable a bank to purchase catastrophe insurance from the private sector rather than the public sector via the lender of last resort. They also allow a bank to hold a Tier 1 equity reserve at a lower cost than equity itself, in theory at least.
Figure 9.3 Illustration of contingent capital note triggering
Core competence: ‘know your risk’
Regulatory authorities noticed a considerable decline in cross-border lending flows in the aftermath of the Lehman bankruptcy (see Bank of England, 2009). This is significant. During the bull market of 2001–2007, international lending volumes had expanded steadily (see Figure 9.4), as banks grew their balance sheets and sought higher yield opportunities elsewhere.

It is evident that during and after the bank crisis, when interbank market liquidity had dried up, banks pulled back from overseas markets, irrespective of whether these were deemed peripheral or not, and concentrated on core markets. This reflects informational advantages in core markets compared with overseas and non-core markets. The UK corporate lending sector is a case in point: between 2002 and 2009, the lending volume from UK banks fell by approximately 16% (the figure between 2006 and 2009 was a decline of 14%). However, the equivalent figures for foreign subsidiaries was a fall of 10.5% and 20% while for foreign branches the decline was even more dramatic, at 17% and 46%.2 Foreign banks would, on average, have less depth and breadth in their corporate relationships, while branches would be expected to have even less developed relationships in the domestic market.
The lessons for the bank business model are clear: during an expansionary phase, it is important to remain focused on areas of core competence and sectors in which the bank possesses actual knowledge and strength. Concentrating on areas in which the bank carries competitive advantage makes it less likely that loan origination standards will decline, resulting in lower losses during an economic downturn. There is also a technical reason for ensuring that overseas lending standards are maintained strictly and limits set carefully because it is often undertaken in foreign currency. A bank’s ability to fund such lending is more dependent on external markets and wholesale counterparties relative to domestic lending, thus making the bank more vulnerable to a market downturn. For example, the cross-currency swap market in US dollars came under pressure resulting in higher swap prices, following the Lehman default, and many banks struggled to obtain dollar funding.
Liquidity risk management
In the aftermath of the crisis the UK’s Financial Services Authority published Consultative Paper 08/22 and Consultative Paper 08/24 in 2008, the recommended requirements of which were formalized in its Policy Statement 09/16 in October 2009. These documents have set a standard for bank liquidity management that is expected to be mirrored, in part if not wholly, in other jurisdictions around the world. As such they hint at a new facet of the basic bank business model that concentrates on the liabilities’ side of the balance sheet. In essence the FSA has recognized that the crisis of 2007/2008 was as much a liquidity crisis as a capital loss crisis and has acted to mitigate this risk going forward.
Liquidity management: the new model
The basic tenets of the FSA’s proposals are grounded in market logic. Their content is expected to become business best practice in due course, and bank boards and senior management need to incorporate these tenets in their operating models. The salient points include
- the number of mismatch (gap) limits are increased, as is supervisory oversight;
- increased international co-operation between regulators;
- bank-liquidity-reporting obligations and their frequency are increased;
- certain behavioural adjustments that were previously allowed are now revoked or reduced; for example, intra-group committed liquidity facilities no longer count as automatic funding self- sufficiency;
- other behavioural adjustments are to be reviewed on a case-by-case basis – for example, the treatment of deposit ‘stickiness’;
- new requirements to hold buffers of truly liquid assets – this is discussed on p. 276;
- new requirements to increase the average tenor of funding and diversify the sources of funds.
The main implication of these requirements is increased cost and, all else being equal, lower RoE. Other implications for this new business model include
- greater level of governance responsibility by senior management and the board;
- improved liquidity risk management capability (including better use of stress-testing and improved contingency-funding plans);
- decreased reliance on short-term wholesale funding;
- greater incentive for a bank to attract retail time deposits and longer term wholesale deposits;
- higher amount and quality of liquid asset stocks (including a higher proportion held in government bonds) – the liquid asset buffer;
- in theory, slower expansion of bank lending during favourable economic times.
The main implication for banks is increased likelihood of their surviving a liquidity stress event.
Another aspect of the new bank model required by regulators is more in-depth and realistic stress-testing. Jurisdictions will differ in detail. Taking the FSA papers as an example, however, banks should implement the following stress tests:
| (1) | Under the banner of name-specific shocks |
| –Is there a risk of an unforeseen name-specific shock? | |
| –Is there a chance the market perceives the firm to be potentially insolvent in the short term? | |
| –What would be the long-term impact of a multi-notch downgrade in credit rating? | |
| (2) | Under the banner of market-wide dislocation |
| –Is there a risk of unforeseen short-term market-wide dislocation that gradually evolves into long-term market-wide liquidity stress? | |
| –Are there widespread concerns about the solvency of the financial sector? | |
| –Is there uncertainty about the value of financial assets? | |
| –Is there a risk of certain asset classes remaining illiquid for a long period? | |
| (3) | A combination of (1) and (2). |
Using the FSA template as a guide, a bank should stress-test the following main risk drivers:
- wholesale funding risk
- intra-group funding risk
- intra-day liquidity risk
- cross-currency liquidity risk
- retail funding risk
- size and quality of liquidity buffer
- wholesale (unsecured) lending and retail loans
- off-balance-sheet liquidity risk
- continuation of business
- diversification of funding sources.
Responsibility for formulating the stress tests, ensuring that they are carried out robustly and at the required frequency, and reporting the results to the board, lies with the chief risk officer. Under business best practice culture, this person will report direct to a NED on the board.
Basel Committee proposals and the net stable funding ratio
The Basel Committee for Banking Supervision (BCBS) published extensive proposals for a revamp of certain aspects of the Basel rules – termed ‘Basel III’ – for implementation from the end of 2012. In this section we consider the implications of its contents for bank liquidity-funding arrangements and liquidity reporting.
A significant aspect of Basel III is a new liquidity measurement metric known as the net stable funding ratio (NSFR).
The stated objective of the NSFR is to encourage more medium-term funding; the metric itself highlights the level of long-term funding compared with short-term liabilities. At this stage, no limit for the NSFR has been set, and such a limit is unlikely; however, regulators are expected to compare each bank’s figure against its peer group average and range. At the time of writing, the exact calculation of the metric has not been specified; the author agrees with either of two suggestions put forward by the British Bankers Association (BBA) as part of its response to the BCBS proposals.
Certainly, the NSFR is not a metric on which one could set a ‘one-size-fits-all’ limit. As such, it is expected that supervisors will view it as part of a set of other metrics before determining regulatory compliance. However, bank senior management need to be aware of it, and structure their liabilities within an acceptable bound for regulatory compliance.
The BBA has suggested either of the following definitions for calculation of the NSFR:
- Capital plus term funding with residual maturity over 1 year plus non-wholesale funding divided by assets not marketable within 1 year:
![]()
- Given that the problem during the crisis was one of overreliance on short-term (<1 year) wholesale funding, an alternative calculation of the metric could be by using a formula of the form:
![]()
In essence. the purpose of the NFSR is to control the level of maturity transformation that an institution undertakes.
With regard to liquidity measurement reporting, the BCBS has proposed a consistent set of monitoring metrics for all firms. The purpose of this is to assist supervisors across jurisdictions in looking at liquidity risk in global banks, and creating a common language, thereby reducing the risk of misinterpretation of information by bank boards and regulators. It will also have the added advantage of reducing system costs in reporting the liquidity risk being run by such entities.
We discussed a range of reports in Chapter 8. Some of these are in the BCBS list, including:
i Loan-to-deposit ratio.
ii Cumulative liquidity model – a forward-looking model of inflows, outflows and available liquidity, accumulated for a 12-month period. It recognizes and predicts liquidity stress points on a cash basis. This will also include 1-week, 1-month and 3-month liquidity ratios.
iii Liquidity risk factor (also known as maturity transformation) – the average tenor of assets to average tenor of liabilities.
iv Inter-entity funding report for group and consolidated banking entities.
v Pricing data.
vi Currency analysis.
vii Retail and corporate funding levels.
viii Long-term-funding/core-funding ratio.
ix Liquid asset buffer.
x Survival horizon.
xi Domestic quantitative ratios.
xii Systems and controls questionnaire or qualitative self-assessment.
In addition, there are a number of other reports that the author considers to be useful:
i A funding concentration report indicates the extent of reliance on single sources of funds – for example, the top-five biggest single sources, by sector and individual firm/customer. It also ascertains whether the limits set by the bank exceed more than, say, 10% of funds from one single source.
ii Report on the amount of funding capacity that exists after taking into account the headroom required to survive a stress event (whether firm specific or market wide), on the extent to which existing liabilities and assets are rolled over and on the amount of new business put on, over a given period of time. We call this metric the ‘surplus funding capacity’ of a bank.
iii A weekly qualitative report that provides a descriptive summary of any material detrimental changes to the above metrics – for example, it explains significant changes in the 1-week and 1-month liquidity ratios, the cash and liquidity gap in the cumulative liquidity model, the liquidity risk factor, intergroup borrowing/lending position, etc.
A bank that reports using the full suite of metrics listed above will be able to give a transparent picture of its liquidity position, which is essential to ensuring orderly regulatory supervision.
Bank senior management and boards must incorporate the constituent elements that make up the BCBS proposals, as they will form an essential part of the new bank model during the next 10 years.
The liquid asset buffer
If one reviewed bank balance sheets from the 1950s through to the 1990s, it was common practice to observe that – on the asset side – part of it would be comprised of government bonds. That this practice fell into disuse reflects the thinking of the last 10–15 years: that market liquidity could be taken for granted and bank ‘liquidity’ portfolios could be held in the form of higher yielding bank bonds (MTNs and FRNs).
Under the FSA’s Policy Statement 09/16, a ‘liquid asset buffer’ (LAB) is now mandatory for all UK-regulated banks. It is to be recommended as a standard part of all bank business models – irrespective of jurisdiction – because of the obvious risk mitigation impact of doing so. Because sovereign bonds pay less than other securities, the implication of this change is clear: RoE will be lower.
Using FSA requirements as a template, a bank should adopt the basic operating model for its LAB by:
- Requiring all branches to hold buffers of liquid assets. The expectation behind this thinking is that LAB assets will retain both value and liquidity in a stressed environment. The evidence for this is strong: in October and November 2008, the only assets that remained liquid, and acceptable for repo, were G7 sovereign securities. Bank CDs, FRNs, corporate bonds and structured finance securities all became illiquid and/or were no longer acceptable as collateral.
- Making the central bank eligibility of the LAB asset irrelevant.
- By funding the LAB by long-term (90 day) funds including retail and wholesale funds – and not funding in repo. This is to ensure that the bonds can act as a true buffer of liquidity, able to be sold or repoed if funding becomes stressed for the bank.
The LAB for most banks in Western jurisdictions would be expected to be comprised of the following (this is direct from the FSA document):
‘Highly liquid, high-quality government debt instruments such as gilts, plus bonds rated at least Aa3 issued by the countries of the European Economic Area (EEA), Canada, Japan, Switzerland and the United States; reserves held with the Bank of England’s reserve scheme and with the central banks of the U.S, the EEA, Switzerland, Canada and Japan. Designated multilateral development banks including
– African Development Bank
– Asian Development Bank
– Council of Europe Development Bank
– European Bank for Reconstruction and Development
– European Investment Bank
– Inter-American Development Bank
– International Bank for Reconstruction and Development
– International Finance Corporation
– Islamic Development Bank
– Nordic Investment Bank.’
It is fairly clear that the LAB at a bank must ideally hold only high- quality assets, or otherwise be comprised of cash deposits at the central bank. Because many eligible bonds held in an LAB would pay lower than LIBOR, banks will want to hold such bonds that are longer dated so as not to lose money on the portfolio, if they are funded shorter tenor in a positive-sloping yield curve environment.
The FSA expects a firm to turn over its liquidity buffer on a regular basis, either through the sale of assets or via repo. As we noted above, the portfolio cannot be funded in repo. It must be funded using unsecured funds, retail deposits or term funds – that is, over 90-day maturity. The size of the buffer is a key point. The exact proportion of a bank’s balance sheet that has to be held in the form of an LAB is a function of the type of institution and the structure of its funding.
The FSA’s calculation suggests that a bank will have to hold the aggregate total of its 3-month funding base as a liquid buffer. In other words, the more longer term funds a bank has, the smaller its buffer. Essentially, the calculation of how much of a buffer a bank needs to hold is a function of how much short-dated (0–90 day) wholesale funding a bank has. The higher the short-dated wholesale funding of a bank, the larger its LAB.
Conclusions and recommendations
A neutral observer of the world’s economic system would conclude fairly quickly that financial markets, and banks, are indispensable parts of the economy and societal well-being. It is vital therefore that any regulatory system should incorporate the means of enforcing stability in the banking market. It should also allow for financial market innovation because it has been largely through this that many of the benefits of finance have been made available to the wider population. But the key priority is effective regulation so that – even if individual banks are forced into liquidation – market stability is maintained. In other words, regulation must not only seek to preserve stability but also recognize that the main business of banks involves taking risk: the act of maturity transformation, the cornerstone of banking, creates risk exposure.
Bank senior management and boards should accept that the institutions they run are pivotal parts of society and that in the post-crisis era they will be closely regulated. Contributing to the stability of the market is as important an objective for a board as is achieving shareholder RoE targets. To this end, an understanding and appreciation of market stability is vital. In the first instance, increasing bank capital levels is a necessary though not necessarily sufficient means of ensuring a stable banking system: liquidity management is just as important. In this regard, the UK FSA’s requirement that all UK-regulated banks must maintain an LAB is correct. Forcing every bank to invest a proportion of their assets in cash, central bank deposits and liquid AAA-rated sovereign securities is the best insurance protection against future liquidity crises.
We believe all banks should adopt this approach. The exact proportion of the balance sheet that should be placed in the LAB is a function of the liquidity gap that the bank runs as well as the diversity and security of its funding arrangements. One form of LAB is best business practice, and all banks should seek to put it in place. In itself this is not a new suggestion; a truly liquid portfolio was commonplace in banks around the world 15 or 20 years ago. However, banks started to unilaterally relax their own requirements and remove liquidity portfolios, or move them into assets that were not truly liquid (such as bank FRNs), to the point where such portfolios had become rare even in supposedly conservative institutions such as the UK’s building societies. It is evident that the prevailing orthodoxy has now gone full circle.
Bank boards should seek to simplify their capital structures in the interests of transparency and investor comfort. The simplest structure may well be the most efficient, with a liability base comprised of pure equity, retained profits, senior unsubordinated bonds and deposits. Deposits are part of a country’s deposit guarantee scheme, so such a structure leaves no ambiguity about what stakeholders are at risk should the bank fail.
The nature of bank liquidity management has been transformed, although many of the ‘new’ requirements in regimes – such as those implemented by the FSA – are more of a return to basics than actual new practices. The new bank business model for the next 10 or 20 years will incorporate these practices, with boards recommended to pay close attention to their banks’ liability structures. The basic tenets of the new liability model is less reliance on wholesale funding, less reliance on short-term funding, a more diversified funding base, and genuine self-sufficiency in funding. Under this new model, banks will be considerably less likely to suffer failure at the time of the next market crash or systemic stress event.
REFERENCES
Bank of England (2009) Financial Stability Report, Issue No. 26, December.
Choudhry, M. (2007) Bank Asset and Liability Management, John Wiley & Sons (Asia) Pte Ltd.
1 Without naming the banks, the author is aware of institutions that purchased ABS and CDO securities under the belief that the senior tranche, rated AAA, would not be downgraded even if there was a default in the underlying asset pool, presumably because the junior note(s) would absorb the losses. Of course, this loss of subordination does erode the initial rating of the senior note – with a consequent markdown in market value. Another institution, according to anecdotal evidence received by email, entered into negative basis trades without any consideration for the funding cost of the trade package. This resulted in losses irrespective of how the basis performed. In this case, it is clear that the trading desk in question entered into a relatively sophisticated trading strategy without being sufficiently aware of the technical implications.
2Source: Bank of England (2009).