
1
The Master Plan
You’ll encounter three types of diagrams in electricity and electronics literature. Each style serves a unique purpose. When you buy an electric or electronic device or system, it should (in the ideal case) come with an operating and maintenance manual that includes all three types of diagrams.
• A block diagram gives you an overview of how the individual circuits in a system work together. You’ll see each circuit represented as a “block” (rectangle or other shape, depending on the application). Interconnecting lines, sometimes with arrows on one or both ends, show how the circuits combine to form the whole system, and how currents and signals flow among those circuits. Figure 1-1 is a simple example.
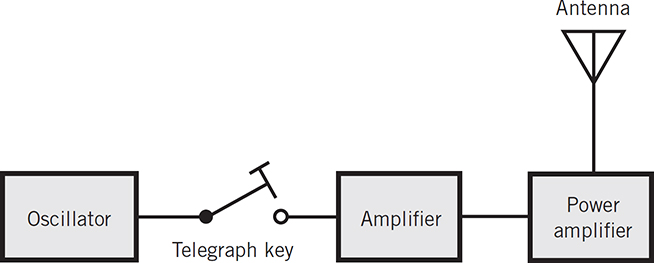
FIG. 1-1 Block diagram of a radio transmitter that can send signals in Morse code.
• A schematic diagram (often simply called a schematic) shows every component in a circuit. Each component has its own special symbol. Lines between the components reveal how they connect together, and to a source of power, so they perform a specific function or operation. This book deals mostly with schematics. Figure 1-2 is a simple example.
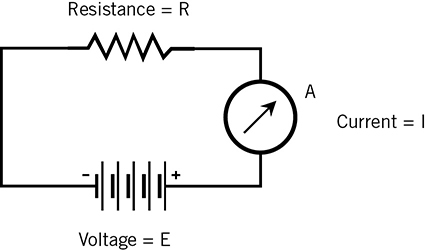
FIG. 1-2 Schematic that includes a battery, a resistor, and an ammeter (labeled A).
• A pictorial diagram (sometimes called a layout diagram) shows the physical arrangement of the components on a circuit board or chassis so you can identify them for installation, testing, or replacement. Some such “diagrams” are actual photographs. Keep in mind, however, that pictures rarely reveal the electrical events that occur in a circuit or system. Figure 1-3 is a simple example.
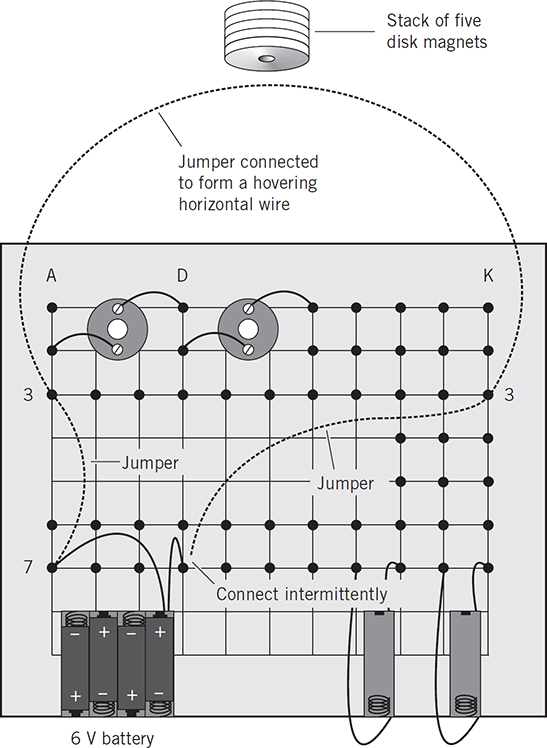
FIG. 1-3 Pictorial drawing that shows the physical layout of a test circuit for magnetism experiments.
Block Diagrams
A block diagram can help you understand how a system works, and can help you troubleshoot it when it malfunctions. Each block has a label that describes or names the circuit it represents, but it doesn’t explain the workings of the circuit, nor does it depict the individual components. When you gain a general understanding of how a system operates by examining its block diagram, you can consult each of its circuit schematics for more details. Consider two examples.
• You want to design an electronic device to perform a specific task. You can simplify the process by drawing a block diagram that shows all the circuits you’ll need to complete the project. Then you can expand each block into a schematic. In the end, you’ll have a complete schematic that replaces all the blocks and shows the whole device in detail.
• Alternatively, you can approach the task the other way around. Imagine that you have a complicated schematic, and you want to use it to troubleshoot a device. Because the schematic shows every single component, you might find it difficult to determine which part of the device has the problem. A block diagram can help you envision how each circuit works in conjunction with the others. Once you’ve found the troublesome circuit with the aid of the block diagram, you can examine its schematic and do tests to isolate the faulty component.
Schematic Diagrams
A schematic acts as a “map” of a circuit, showing all of the individual components and how they interconnect with one another. According to one popular dictionary, the term schematic means “of or relating to a scheme; diagrammatic.” Therefore, you can call any drawing that depicts a scheme (electronic, physiological, geographic, or whatever) a schematic diagram.
One of the most common types of schematic is a road map for use in motor vehicles. The map might show all the navigable paths of travel inside a town, within a state or province, or across multiple states or provinces. Like a schematic of an electronic circuit, a road map shows all the landmarks relevant to a geographic region. In electronics, a schematic allows a technician to extrapolate the components and interconnections when testing, troubleshooting, and repairing a small circuit, a large device, or a huge system.
Suppose that you want to drive your truck from one place to another. Your road map shows all the landmarks between these two locations. By comparison, a schematic shows all the components between any two points in an electronic circuit. But both diagrams indicate more than mere points. You need to know more than which towns lie between two fixed locations to get an idea of the overall nature of the region. You could write down the names of the various towns or landmarks along a chosen route, but such a list couldn’t take the place of a good road map. From an electronics standpoint, you could do the same thing by compiling a list of the components in certain circuit, such as:
• Two 120-ohm resistors
• One 1000-ohm resistor
• One PNP transistor
• Two 0.47-microfarad capacitors
• 90 centimeters of hookup wire
• One 6-volt “lantern” battery
• One switch with a built-in circuit breaker
This list tells you the “ingredients” of the circuit, but nothing in a functional sense. You know all the components necessary to build the circuit, but you don’t know what it will do when you put it together! In fact, you might combine these components in several different ways to make circuits that do different things.
A schematic must not only show all the components in a circuit, but also how these components work with each other. A road map connects towns and other points of interest with lines that represent streets and highways. A line that indicates a secondary road differs from a line that represents a four-lane highway. With practice, you can learn to tell at a glance which sorts of lines indicate which types of roads. In electronics, a schematic uses a solid line to indicate a plain electrical conductor such as a wire or foil run; other types of lines (or sets of lines) represent cables, logical pathways, shielding enclosures, and wireless links. Whenever you draw an interconnecting line or set of lines, you portray some relationship between the connected components.
Schematic Symbology
A schematic uses symbology to reveal the anatomy of a system. On a road map, many of the symbols are lines to indicate roadways. But of course, a single black line that portrays State Route 522 doesn’t resemble the appearance of this highway as you drive along it! You need only know the fact that the line symbolizes State Route 522. You can make up the other details in your mind. If you always had to see pictorial drawings of highways on paper road maps, those maps would take up thousands of times more space than the folded-up papers that you keep in your vehicle.
On a well-produced road map, you’ll find a key to the symbols. The key shows each symbol and explains in simple language what each one means. If a small airplane drawn on the map indicates an airport and you memorize this fact, then each time you see the airplane symbol, you’ll know that an airport exists at that particular site as shown on the map. Symbology depicts a physical object (such as an airport) in the form of another physical object (such as an airplane image).
A road map contains many different symbols. Each symbol is “human engineered” to make sense in your mind. For instance, when you see a miniature airplane on a road map, you’ll probably know that this location has something to do with airplanes, so you won’t need a detailed explanation. If, on the other hand, the mapmaker used a beer bottle to represent an airport, anyone who failed to read the key would probably think of a saloon, not an airport! Because a map needs many different symbols, a good mapmaker tries to make sure that the symbols make sense.
Logical thinking will only take you to a certain point in devising schemes to represent complicated things, especially when you get into the realm of electronic circuits and systems. For example, a circle (or sometimes an ellipse) normally forms the basis for a transistor symbol, a silicon-controlled rectifier (SCR) symbol, and an electric outlet symbol. Additional symbols inside the circle reveal which type of component it represents.
In the olden days of electronics, engineers used circles containing various electrode symbols to represent vacuum tubes. (Sometimes they still do!) Transistors have evolved to replace vacuum tubes in most situations, so the schematic symbol for a transistor also starts with a circle. Electrode markings go into the circle as before, but transistor elements differ from tube elements, so transistor circles contain different markings than tube symbols did. Transistors perform many of the same functions as vacuum tubes did (and sometimes still do!) so their symbols look somewhat alike, but they’re far from identical.
Inconsistencies arise in schematic symbology, so electronics-related diagrams can get a lot more sophisticated and subtle than any road map you’ll ever see. For example, you can portray an SCR as a circle with a diode symbol inside and an extra line coming out of it. But an SCR performs a function that differs from what a tube or transistor does. An electric outlet can serve as another example. It doesn’t work anything like a tube or transistor or SCR, but the basis for the symbol is a circle, just like the circle for a tube or transistor or SCR. You’ll learn more about schematic symbols in Chapter 3.

FIG. 1-4 At A, the schematic symbol for a PNP bipolar transistor including a circle. At B, the same symbol without the circle.
Component Interconnections
Consider a single, commonplace electronic component: a PNP bipolar transistor. This device has three electrode elements, and although many different varieties of PNP bipolar transistors exist, you draw all their symbols in pretty much the same way. You might find a PNP bipolar transistor in any one of thousands of different circuits! A good schematic will describe:
• How that particular component fits into the circuit.
• Which other components work in conjunction with it.
• Which other circuit elements depend on it for proper operation.
A PNP bipolar transistor can act as a switch, an amplifier, an oscillator, or an impedance-matching device. If a PNP bipolar transistor functions in some circuit as a radio-frequency (RF) amplifier, you can’t conclude that a PNP bipolar transistor can operate as an RF amplifier only, and nothing else. For example, you could pull the thing out of the RF amplifier circuit and put it into another circuit to serve as the “heart” of an audio-frequency (AF) oscillator.
Imagine that you decide to drive your car from Baltimore, Maryland to Los Angeles, California. Even if you’ve made the trip several times in the past, you probably don’t recall all the routes that you’ll need to take and all the towns and cities that you’ll pass along the way. (They might have changed, anyway, if you haven’t made the trip for some time!) An up-to-date road map will give you an overall picture of the whole trip. Because all the trip data exists in a form that you can scan at a glance, the road map plays a critical role in allowing you to envision the entire trip rather than each and every piece, one at a time. A schematic does the same thing for a “trip” through an electronic circuit. And, like road maps, schematics can evolve over time as engineers make improvements to the original design.
Continuing with the road map and the coast-to-coast trip as an example, imagine that you’ve memorized the entire route from Baltimore to Los Angeles. Assume also that one of the prime highways along the way has gone under construction, forcing you to take an alternate route. Without a road map, you’ll have no idea what other roads exist in that area, which alternate route to take, and which detour will keep you on course as much as possible and eventually return you to the original travel route with a minimum of delay and inconvenience.
An electronic circuit has many “highways” and “byways.” Occasionally, some of these routes break down, making it necessary to seek out the problem and correct it. Even if you can visualize the circuit in your head, you’ll find it impossible to keep in your “mind’s eye” all the different electrical paths that exist, one or more of which could prove defective. When I write of visualizing the circuit, I don’t mean the schematic equivalent of the circuit, but the circuit’s actual components and interconnections, known as the hard wiring.
A schematic gives you an overall map of a circuit and shows you how the various routes and components interact. When you can see how the complete circuit depends on each individual route and component, you can diagnose and repair any problem that might arise. Without such a view, you’ll have to “shoot in the dark” if you want to get a malfunctioning circuit working again. You might even introduce a new problem instead of resolving the original one!

FIG. 1-5 A rather complicated schematic. When you’ve finished this book, you’ll think it’s simple! (Don’t worry about the component designators right now.)
A Visual Language
Every word in English or any other verbal language is a complex symbol made from simpler elements called characters. Let’s take the word “stop,” for example. Without a reference key, this sound means nothing. A newborn infant hears noise coming out of your mouth, that’s all! But through learning the symbology, this word acquires meaning because the child, who has begun to speak and understand, can compare “stop” to other words, and also to actions. You can even say that the word “stop” is a sort of symbology within symbology. Your intent, when using the word “stop,” can also be expressed by the phrase “Do not proceed further.” This phrase also constitutes symbology, expressing a mental image of a desired action.
If people could communicate by mental telepathy, then no one would need language or the symbols that it comprises. Thinking happens faster than anyone can speak or read or write. Brain processes are the same from human to human, regardless of what language any particular person employs when speaking, reading, or writing. A newborn baby speaks and understands no language. But whether that baby was born in America, South Africa, China, India, or wherever, the same thought processes take place.
A baby knows when it’s hungry, in pain, frightened, or happy. It needs no language to comprehend these states. But the baby does have to communicate right from the start. For this reason, all newborns communicate in the same language (crying and laughing, mostly). As babies comprehend more of their environment through improved sensory equipment (eyes, ears, nose, fingers), they collect more data. Then the various languages come into play, with different societies using different verbal symbols to express mental processes. The human brain nevertheless carries on the same nonlinguistic thought processes as before, because thinking in terms of symbols alone would take too much time and “brain storage.”
The brain helps a human to transpose complex thoughts into language and vice-versa, just as a computer translates programming languages into electronic impulses and vice-versa. Imagine that a child is about to step in front of a speeding automobile. If your brain had to handle millions of data elements symbolically, you would spend a lot of time waiting for your brain to deliver the correct processed information, and that child would probably get killed before you could take any action. Rather, your brain scans all the data received by your sensory organs in quick time and then sums it up into a single symbol for communication. A good audible (and hopefully loud) symbol in the above-mentioned case is “Stop!” You, seeing a child about to walk into heavy traffic, might shout that word and produce in the child’s brain the appropriate sequences of processes.
Not all languages involve spoken words. You’ve doubtless heard of sign language, whereby a person’s arms and hands move to communicate ideas. If you’ve done any amateur (“ham”) radio communication, especially if you got your “ham” license back in the time when I got mine (the 1960s), you know the Morse code as a set of communication symbols. In most instances, a language comprising only visual symbols or audio symbols is not as efficient for us humans as one composed of visual and audio symbols combined. Using the symbol “stop” again, you can utter this word in many different ways. The word in itself means something, but the way we say it (our “tone of voice”) augments the meaning. You can’t do all that with the printed or audible characters S, T, O, and P in plain text or in Morse code.
We humans have arrived at universal methods of modifying visual symbols. For example, we often use color in conjunction with the visual symbol for a spoken word. Think of a “stop” sign. It’s red, right? People tend to associate red with the word “stop” or “danger.” Or think of a “yield” sign. It’s yellow, representing something that demands attention, but in a less forceful way than red does; you “proceed with caution.” When a traffic light turns green, you can “go!” (But considering how some fools drive nowadays, you’d better use caution all the time if you want to live very long.)
Schematics don’t lend themselves to any form of oral (audible) symbology either. When you see the symbol for, say, a field-effect transistor (FET) in a schematic diagram, you don’t hear the paper or computer say, “Field-effect transistor, for heaven’s sake, not bipolar transistor!” You have to make sure that you read the symbol correctly. If you want to build the circuit and you mistakenly put a bipolar transistor where an FET should go, then you can’t expect the final device or system to work. Something might burn out, so that when you recognize your error and bipolar transistor with an FET, you’ll have to troubleshoot the whole circuit before you can use it. You might even have to start all over again and replace every single component!
Your senses along with your central processor (your brain) render you less than proficient at mentally conceiving all the workings of electronic circuits by dealing with them directly. You must accept data one small step at a time, compiling it in hardcopy form (through symbology) and providing a hardcopy readout. You can liken this method to “connect-the-dots” drawings in children’s school workbooks. Individually, the dots mean nothing, but once they’re arranged in logical form and connected by lines, you get an overall picture. The dots’ relationships to each other and to the sequence in which they’re connected tell you all you need to know.
The remaining chapters in this book start with the symbols for individual electronic components, then move on to simple circuits, and finally show you a few rather complicated circuits. Schematic symbols and diagrams are designed for humans, so human logic plays a prime role in determining which symbols mean which things. In that respect, the creation and reading of schematic diagrams resembles mathematics, and in particular, old-fashioned plane geometry!