

CHAPTER 12
Project Control
The primary reason for doing a project plan (including the schedule) is to achieve control of the project. Remember the definition of control? If you have no plan, you can’t possibly have control, by definition!
I also think it is important to understand that we are not implying the use of personal power to control a project. The kind of control we are talking about is that of guidance, as in the example of piloting an airplane. You establish a destination and put together a flight plan on how to reach it, and as you fly, you keep track of how well you are following your flight plan. And as the wind blows you off course, you correct for those deviations to bring the plane back on track.
It is also useful to remember that there is usually more than one individual working to deliver project results, and each of them must have a personal plan to guide his or her work, so that collectively the team will steer the project to hit the target. One way to think of this is that, to achieve macrocontrol, you must do it through microcontrol, and as I pointed out elsewhere, this does not mean micromanaging. Every individual contributor must be exercising self-control, or your project will eventually be out of control.
MEASURING PROGRESS
If you are going to control a project, you need to know two things: where you are supposed to be, and where you are. The plan tells you where you are supposed to be. As for where you are, that comes from your project information system—which in many organizations is nonexistent.
This system must provide information on all four project constraints. Remember, the relationship between them is given by the formula
C = f(P, T, S)
where P is performance, T is time, S is scope, and C is cost. (And f means function.)
So, if you want to know the true status of the project, you must know what costs have been incurred to date, whether the work meets the functional and technical requirements (that is, performance), whether the work is on schedule, and whether the scope of work done is at the right level.
Again, remember that in this equation, the cost is for labor only. As I have said before, you care about the cost of materials, capital equipment, and other project requirements (such as travel or insurance), but they do not belong in this equation; they are tracked separately.
The easiest of the four variables to ascertain is cost. You may not have a system in place to provide that information, but if you wanted to get it, you could do so by having everyone record the hours spent on the project, multiply those hours by the hourly labor rate that they are paid, and then add them up.
It is harder to obtain data on the right-hand side of the equation. To illustrate, let’s begin with a simple example. Say you are building a brick wall. It is supposed to be a foot thick, 10 feet high, and 100 feet long by today’s date. When it is finished, it will be a foot thick, 20 feet high, and 200 feet long.
The nice thing about brick walls is that you can measure them. So you take a scale out to the wall and determine that it is indeed 1 foot thick and 100 feet long. You inspect the mortar between the bricks, and it looks nice and clean and uniform. In addition, you check to see if the wall is perfectly vertical, and it is. This tells you that the quality of work done (functional and technical performance requirements) is okay. Next, you measure the height of the wall and find that it is only eight feet high. This tells you that the scope is not correct—the workers have accomplished only 80 percent of what they were scheduled to do up to now. (Note that we are not measuring the percentage of total work that will eventually be done. We are measuring whether the status of the work is correct as of today, so we compare actual performance to what the plan says should have been completed by today.)
That being the case, we also know that the workers are behind schedule. How far behind? Well, if you assume that work is linear over time (which it isn’t, but we will assume that it is for now), and they have been working on the job for 10 days, then they have accomplished what they should have done by day 8. Therefore, they are about two days behind schedule.
This isn’t totally correct because work is almost never linear. But it is a fair approximation for a wall of this height. This is tangible work, which is much easier to measure than knowledge work.
Writing software is knowledge work, and if you were checking progress on a software task and the programmer had estimated that she would have written about 10,000 lines of code by today’s date, but she has only written 8,000 lines, we might assume she is 80 percent complete. But is she?
Who knows? She may find that the code she has written won’t work and she’ll have to start over. Or she may actually be finished because she found a way to write the code using fewer lines than she originally anticipated.
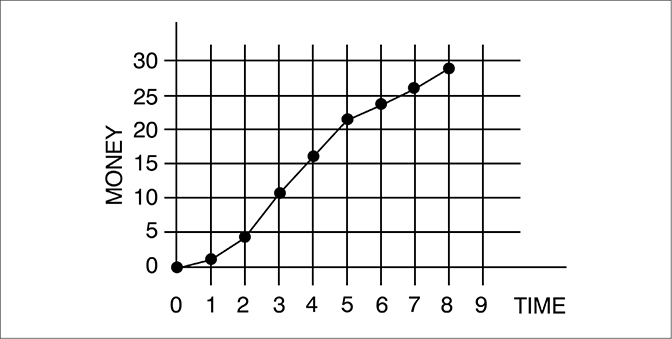
In addition, knowledge work usually proceeds along a progress curve like the one shown in Figure 12.1. Note that very little progress is made for a long period, then the work accelerates quickly, and then near the end it slows down again. We call these S-curves, because they have a shape similar to an italicized letter S.
Figure 12.1 Progress Curve for Knowledge Work
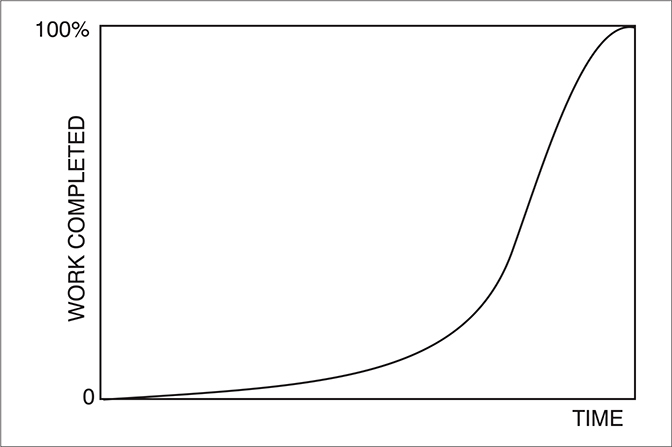
This is sometimes a source of great anxiety for senior managers who do not understand the nature of this progress curve. They expect work to be more linear, so when a knowledge worker seems to be “going nowhere” for a long time, managers may get very concerned and start putting pressure on the person to get the job done. The net result of this pressure may very well be to slow the person down. As one of my engineers told me once, when our manager was putting pressure on him to speed up, “Putting two jockeys on one horse won’t make him run faster.”
So how do we measure the progress of knowledge work?
With difficulty.
If you remember the guidelines that I presented in the scheduling chapter (Chapter 9), they establish that knowledge tasks should have durations no greater than one to three weeks. Furthermore, I said that the increments must have markers that tell you they have been completed. These markers are called exit criteria. For software or engineering design, the exit criteria may be that the design has been reviewed by one’s peers, who have reached consensus that it should perform correctly once it is completed. Of course, this is a judgment on their part, and they could collectively be wrong, but it is the best we can do with work of this nature.
If the task is to conduct a test, the exit criteria may be raw data that verifies that the part meets the technical and functional specifications. Or, in an environmental cleanup project, we may have a situation where oil has seeped into the ground, and at this stage of the project, the oil in a certain area has all been removed. That makes it binary. The oil has or has not been removed. As you can imagine, though, we don’t know how far into the ground the oil has seeped, so the ultimate time it will take to complete the cleanup may be difficult to estimate.
In some cases, the exit criteria take the form of a checklist (such as pilots use to ensure that all of their instruments and controls are functioning correctly before they take off). In others, it is a judgment by someone in the organization, as when a marketing vice president approves the aesthetics of a design.
It is hard to know if P and S are correct, and if these cannot be determined, then you don’t know how you are doing schedule-wise. For that reason, I have been told that there is no point in trying to measure progress in knowledge work.
I can’t agree with that. If you don’t know where you are, you can’t have control. My suggestion is that we simply must recognize the limitations of our ability to measure exactly where we are. If we are building a brick wall, we may hold tolerances of ±5 percent.
For knowledge work, the tolerances are more typically ±20 to 25 percent, and if there is a lot of research involved, we could have a situation where the tolerance may be –100 to +20 percent on schedule. In other words, we must accept very large tolerances on poorly defined or intangible work.
THE PITFALLS OF REPORTING SCHEDULE ONLY
Estimates are that several million individuals have purchased some form of scheduling software. So far as I know, all the major programs allow you to report progress using a bar chart schedule. The reports typically look like the one in Figure 12.2. Small bars are run through the larger schedule bars to show how far along the work has progressed. For noncritical tasks, the smaller bars are black, and for the critical path, which is usually shown with a solid black bar, the progress bar will be white. (Some programs allow you to print the critical path in red, so it stands out.)
Figure 12.2 Schedule Showing Progress
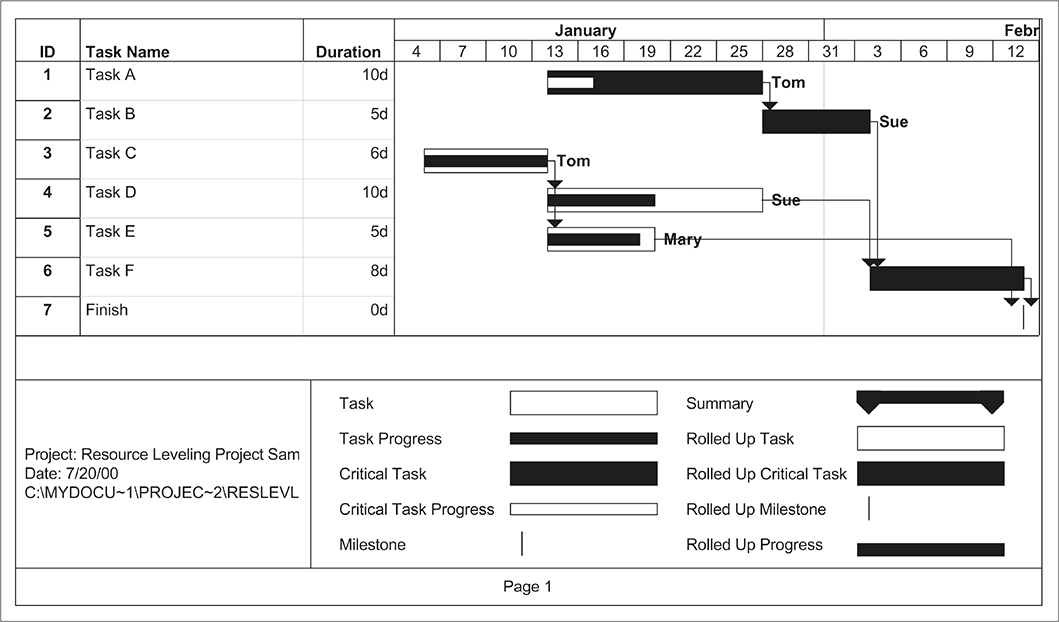
In Figure 12.2, weekends are shown by vertically shaded areas indicating that no work is done on these days. (The shading does not show in this figure because of reproduction issues.) If a project is scheduled to work seven days a week, the shading would be removed. The “time-now” date is shown as a vertical solid line shown on the 19th. You will note that the 19th is a Monday. The usual convention is to report progress for the previous seven days on Monday morning.
According to this report, Activity A, which is a critical path task, is behind schedule by one day. (This is difficult to see on this figure; however, since the progress bar does not touch the solid line, it is showing that the activity is behind schedule.) This immediately tells us that the project is in jeopardy of slipping a day unless something can be done to get this activity back on track, since a delay on the critical path will delay the completion date correspondingly. This is one of the main advantages of knowing which path is critical. If activities on the critical path slip, the end date will slip so it is clear where action must be taken to prevent missing that date.
Activity B is scheduled to start at a later date, so no progress is shown for it. Activity C is complete, Activity D is one day ahead of schedule, and Activity E is right on target. So says the report.
What is missing from this report is information about cost, performance, and scope. Since all that is shown is schedule progress, we must take for granted that performance and scope are correct if the schedule is where it is reported to be. But there is nothing we can infer about cost.
To see why this is a problem, assume that Activity D is a software development task. The work was supposed to take 40 hours (we will assume 100 percent productivity of the programmer). The person doing the work, indicated on the report as Mary, says that she is right on schedule. She has given you this information at 8:30 on Monday morning. You feel very comfortable with her work. You are concerned only about that critical path activity. Something must be done about it.
At 8:45 a.m., Tom comes by and has a brief conversation with you. “I really felt sorry for Mary last week,” he confides.
“How so?” you ask.
“Oh, didn’t you know? She had a terrible time with the code she was writing. Instead of the 40 hours she expected the work would take, she actually put in nearly 80 hours to get the job done.”
“Really?” you say, pondering the situation. “Well, I’m sorry to hear that she had so much trouble, but she’s salaried, so it doesn’t affect my budget. Everything is fine.”
Wait a minute! Is that true?
No way!
If Mary missed her estimate by 100 percent last week, perhaps her estimates for subsequent weeks are off in a similar way. If so, how many 80-hour weeks can she work before she burns out and starts making errors and missing deadlines? This is a sure sign of potential trouble, and you must do something about it right away. (In fact, how many errors did she make last week? If she worked 80 hours instead of 40, there is a good likelihood that she made a lot of errors. That means that the progress she reported is not correct, as she will have to correct those errors in the future, so the scope of work actually done is less than reported.)
So, you go talk to Mary.
“I understand that you had problems with your code last week,” you say.
Mary seems a bit surprised that you know about this, but she agrees. “Yes. It turned out to be a lot harder than I expected.”
“Well, do you think this will continue to be true?” you ask.
There are two possibilities—yes or no.
If she says yes, then you must do something right away. There are only a few possibilities. You can get some help for her if that is possible. You can reduce the scope of the remaining code that must be written. Or you can accept that the task is going to take a lot longer to complete than the original estimate, in which case it may use up all its float and end up on the critical path. You may also decide between you that Mary is not the right person for this job and replace her.
If she says no, it was a one-time occurrence and she is confident that the remaining work will go according to plan, then you tell her to keep you posted. If the work does turn out to be as difficult this week as it was last week, you want to do something before Mary gets herself—and your project—into serious trouble.
Notice what has happened here. Without knowing how much effort (cost) Mary put into the work, you have no indication that there is a problem. This leads to an immutable law of tracking progress: unless you have an integrated cost-schedule tracking system, you don’t have a clue where your project is! It is simply not enough to let people report schedule progress alone.
Knowing cost allows you to figure out what is going on. If the work is on schedule and fewer hours were required than estimated, then people are working more efficiently than you expected. If work is on schedule and more hours have been expended than planned, this is a sign of trouble. If work is behind schedule and total hours worked are less than planned, then people are not doing what they are supposed to, and you need to find out why. And so on.
We still have no good way to measure scope or quality, so these will have to be estimated or evaluated using the best approach possible for the work in question. This means that the accuracy of our control system will not be very good, but we must have some way of tracking progress, and this is the best we can do.
TRACKING PROGRESS USING EARNED VALUE ANALYSIS
The earned value system is derived from standard cost systems that are used to measure performance in manufacturing. An industrial engineer determines (estimates) how long a manufacturing procedure should take and multiplies the time by the labor rate for that operation. This becomes the standard cost for that operation. Work is then tracked, and the time required to do the step is multiplied by the existing labor rate at the time the step is done. This is the actual cost of the operation, also called actual cost of work performed, or ACWP (or simply AC). Note that the labor rate could change between the time the standard cost is established and when the operation is performed, so you could have a variance caused by a change in labor rate. You can also have a variance because the actual time required for the step is different from what was determined by the industrial engineer in the beginning. Thus, it is a composite variance. Finally, we measure what proportion of the work is completed in the standard time. If it is exactly what should have been done, the operation is 100 percent efficient. If the time taken is less, then efficiency is greater than 100 percent, and the converse is true as well.
The earned value system was adopted by project management practitioners as a way of measuring progress, and it is considered to be the best system designed to date. However, the earned value system for tracking projects has detractors. The most common complaint is that you can’t measure knowledge work, and I wholeheartedly agree. You can’t; however, you must pretend you can or else you can’t possibly achieve control of knowledge projects, and this category probably is the largest in the world at present. As I have said previously, we simply must accept that the precision of our measures will be much less than is possible for well-defined or tangible work, but at least we have some indication of how we are doing before a disaster occurs.
As I just stated, the earned value system provides three measures that allow us to determine project status. These are measures of what is supposed to be done, or planned value (PV); what has been done, or earned value (EV); and the amount of effort or cost that has been expended to do the work, or actual cost (AC). (I should say at this point that the original system used four-letter acronyms for these measures—as I did above—but the system was simplified by changing them to two letters, as I’ve used here. Unfortunately, numerous books and articles use the four-letter versions, so you may find it hard to follow these other sources unless you know how to translate. So, as I continue this discussion, I will provide translations for you.)
To see how earned value works, we will start with a very simple example.
Assume for a moment that you have guests coming to stay with you for a few days, and you want to make a good impression by having a spotless house. You don’t have time to do all the cleaning yourself, so you call a cleaning service and ask what they will charge to clean the house from top to bottom. An agent of the service comes out to your house and gives you a quote.
“We should be able to thoroughly clean your house with one worker in 40 hours,” the agent tells you. (The numbers in this example are not meant to be realistic, only to illustrate the procedure. Thus, 40 hours are too many, and the labor rate quoted next may be too high.)
“How much will that cost?” you ask.
“Our billing rate is $20 per hour,” says the agent, “so it will cost you approximately $800.”
“Is that a fixed price?”
“No, we charge by the hour. If it takes a little less, you will pay less, and conversely.”
“Okay, let’s do it,” you say.
The agent agrees to have someone at your house by eight o’clock Monday morning. You make a note that the job will cost about $800. This number is called the budgeted cost of work scheduled (BCWS) to be done—or, to use the new term, this is planned value (PV).
On Monday morning, around 7:00, the phone rings. It is the agent.
“I have a problem,” she tells you. “The guy we were going to send over to clean your house had an accident this weekend and can’t make it. However, I have another person available, but we bill him at $22 an hour. Is that okay?”
“You have me at a disadvantage,” you say. “I have to get the house cleaned, so go ahead and send him over.”
So the alternative worker comes out to your house and starts the job. You must leave town on business, so you don’t talk with the worker until you return on Friday. He is just wrapping up for the week.
“How did it go?” you ask.
“I’m afraid I didn’t quite finish,” he says.
“Well, how much did you get done?” you ask.
He thinks for a moment. “As near as I can tell, I got about 80 percent of it done,” he says.
Notice those words. As near as I can tell.
In other words, he is estimating where he is!
As former president George H. W. Bush used to like to say, estimating is one of those kind, gentle words that really substitutes for the fact that you are guessing. That’s right, an estimate is a guess.
Let’s think about this. Control is exercised by comparing where you are (which you know only by guessing) to where you are supposed to be (which is another guess) and then taking action to correct for differences between the two. Does this sound like witchcraft and magic to you? It does to me. Does it give you a good sense of truly being in control? Probably not.
Nevertheless, as I’ve said earlier, even though this is not precise, it’s better than doing absolutely nothing.
Most important, the example shows the difficulty of measuring progress even on tangible work. How do you know how much of the house has been cleaned? Can you measure it on a square-foot basis? What about cleaning walls or dusting furniture? The truth is, you have no choice but to estimate progress, compare it to the scheduled work (also estimated), and do your best to correct for deviations.
Fine. How do we assign a value to what has been done?
Well, if we compare what has been done to the original target, how much should it have cost you to do 80 percent of the total job? The BCWS (PV) was $800 worth of work. If the worker has done only 80 percent of that, it should have cost me $640, calculated as follows:
BCWP = 0.80 × BCWS = 0.80 × 800 = $640
Or using two-letter codes, we have:
EV = 0.80 × PV = 0.80 × 800 = $640
The term earned value (BCWP, or EV) means that the worker has contributed $640 of value to cleaning the house. Of course, he was supposed to have done $800 worth of work, so he did not perform according to plan.
The fact that the worker did less than was supposed to be done is bad enough, but then it occurs to you that he has worked 40 hours at a higher labor rate ($22 per hour) than you originally budgeted for, so the actual cost of the work performed (ACWP, or AC) is $880.
This is not good. Not only did you get less than you were supposed to get, but you have paid more for it as well.
The status of this task is determined using the following equations:
Schedule variance (SV) = BCWP – BCWS (or EV – PV)
Cost variance (CV) = BCWP – ACWP (or EV – AC)
Budget variance (BV) = BCWS – ACWP (or PV – AC)
Using these formulas, we arrive at the following variances:
Schedule variance = 640 – 800 = –$160 worth of work
Cost variance = 640 – 880 = –$240
Budget variance = 800 – 880 = –$80
In conventional accounting practice, a negative variance is always unfavorable, so this means that the job is behind schedule by $160 worth of work. To convert that to time, you divide by the original $20 per hour labor rate, and you see that the person is eight hours behind schedule. That makes sense. If he only did 80 percent of the work and it was supposed to take five days, he has done what should have been done in four days, so he is one day (or eight hours) behind.
But notice the cost variance. Why is it $240? Because you have spent $80 more for the work than originally budgeted, and you have gotten $160 less work done than you were supposed to get. So your cost variance in this case is the sum of the budget and schedule variances, and since the number is negative, you are overspent by $240.
Here is an important point. We have already seen that if you look only at the schedule, without knowing the cost, you have no warning that a project may be heading for trouble. In the same manner, if you were tracking only your budget variance, you would know that you were spending too much, but that alone does not show the true picture. Not only are you spending too much, but you are getting much less than you should for what you are spending. This also confirms the need to know both cost and schedule to form a true picture of project status.
It is also instructive to notice how this job got into trouble. You failed to check on progress during the week. Rather, you waited until Friday afternoon to find out that the worker was not on target. Had you checked progress around midweek and found that the work was already falling behind, you might have been able to get the worker to spend some overtime to get it finished by Friday afternoon. Now all you can do is pay for work on Saturday or have the person come back next week to finish the job.
This suggests a guideline: the rate at which you monitor progress must be proportionate to the total time the work will take. A task that is supposed to take a week should probably be monitored daily. That doesn’t mean that the project manager should do this—the individual(s) doing the work should monitor their own progress and should be told how much leeway they have before they must take steps to get back on track.
Budget Variance and Spending Variance
It may sound trivial, but it is important to differentiate between budget and spending variance. In the housekeeping example, you are behind schedule and spending more than originally budgeted, so you have a composite of budget and schedule variances that add up to spending variance. In the end, this project will most likely be late and overspent.
RESPONDING TO DEVIATIONS
In tracking a project, you must always ask three questions:
1. What is the status?
2. When there is a deviation, what caused it?
3. What should be done about any deviations that exist?
If we apply these questions to the housecleaning example, the answer to the first question is that you are behind schedule and overspent. When it comes to the second question, however, is it clear that you don’t know the cause of the deviations? It could be that this person is not as efficient as he should be, or it could be that the estimate was wrong in the first place.
How would you figure it out?
Suppose you bring back this same worker week after week to clean the house, and he can never get it all done in 40 hours. Does this prove that it is the person?
No. It could be impossible for anyone to do the work in 40 hours.
Then suppose we alternate between two workers. If neither of them can clean the house in 40 hours, we are convinced that the estimate was optimistic. However, if one of them can clean the house in 40 hours and the other cannot, then it is clearly the person.
Or is it?
Well, clearly, one person can work faster than the other, but it is important to remember what we said about estimating back in Chapter 8. All estimates are person specific. It makes no difference what someone else can do. If you want to know when a project will end, you must estimate for the individuals doing the tasks.
Simply put, there are a very few runners who can run a mile in less than four minutes. So it would be totally unreasonable for you to expect an average person to run the mile in four minutes just because somewhere there is someone who can do it.
Given these facts, you can’t answer the second question now. All you can do is move on to the third one, which asks what you want to do about deviations. To answer this question, you have to look at your options: ignore the deviation, take corrective action to get back on track, or change the plan to accept the deviation.
In the housecleaning situation, you have only a limited number of choices—have the person work overtime on Saturday at premium pay or return on Monday to finish the job at regular pay. If you can wait until Monday, that will be the cheaper option.
Otherwise, you may have no choice but to pay premium wages. Of course, there is a third option, which is to leave the 20 percent as is, but that isn’t a very attractive choice. None of the preferred options fits with the second choice. Both are examples of changing the plan. And of course, it is too late to ignore the deviation.
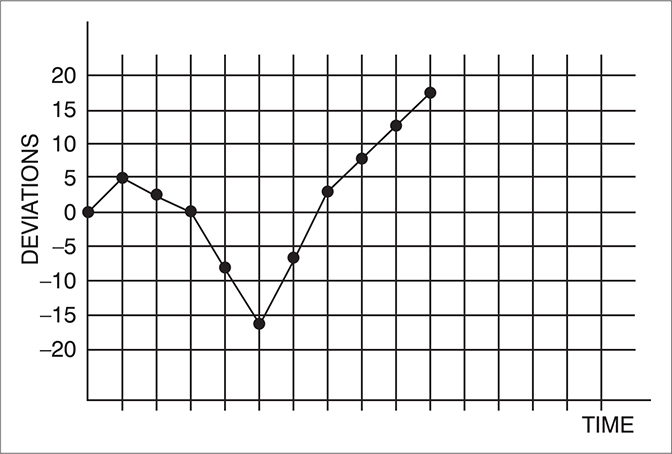
When would it be okay to ignore a deviation? When it is smaller than the tolerances you can hold and does not show a trend that will eventually take it out of bounds. Consider the deviation chart in Figure 12.3. This chart is showing a project in which tolerances of ±20 percent are the best that can be maintained. During the first few weeks of the project, the deviations vary randomly within those boundaries. Then there is a definite trend that suggests that the project will break the 20 percent boundary if nothing is done to get it back on track. Corrective action must be taken, or, if nothing can be done to get back on track, the plan may have to be revised.
Figure 12.3 Deviation Graph for a Project
In examining deviations, you must always go back to the equation that relates the constraints to each other, namely,
C = f(P, T, S)
If you are trying to get back on schedule, you can increase costs (add labor), reduce scope, or reduce performance requirements. All of these can be considered a change to the original plan, except that you may not formally revise the published plan. In the case of reducing scope or performance, you probably have no choice but to revise the plan. If you can increase resources without going over budget, you may be able to leave the plan alone.
Let me reiterate, just so no one misses it. There are only four responses you can make when a project is off track. You can ignore the deviation. You can take corrective action to get back on target. You can change the plan. And you can cancel the job altogether. Cancellations happen when the project has slipped so much that it is no longer viable—it will be too late, too expensive, or nonfunctional.
Now, before we continue to the next section, to recap, here are the two-letter and four-letter acronyms:
BCWS = PV
BCWP = EV
ACWP = AC
Because the two-letter versions are now used by PMI® on their PMP exam, we will use these throughout the remainder of this chapter.
USING GRAPHS TO TRACK PROGRESS AND FORECAST TRENDS
To get an overall assessment of project status, we can plot earned value data graphically. These graphs will also allow us to forecast where the project will end up in terms of both schedule and spending.
Consider the bar chart in Figure 12.4. There are only three activities. As you can see, Task A spends $800 a week for labor, Task B spends $3,000 per week, and Task C spends $2,400 a week. On the first line below the bar chart, you see the weekly spending figures, which are obtained by summing the spending on each bar for the week. The final line shows the cumulative spending for this project to be $28,800 at the end of the job. Note that these figures represent the PV for the project. If these are plotted, we simply transform the bar graph into a line graph, which shows the dollar value of the cumulative work to be done over time. Since the bar graph is a major component of the project plan, the line graph is also, and is, in fact, called a baseline plan. This plot is shown in Figure 12.5.
Figure 12.4 Bar Graph for a Small Project
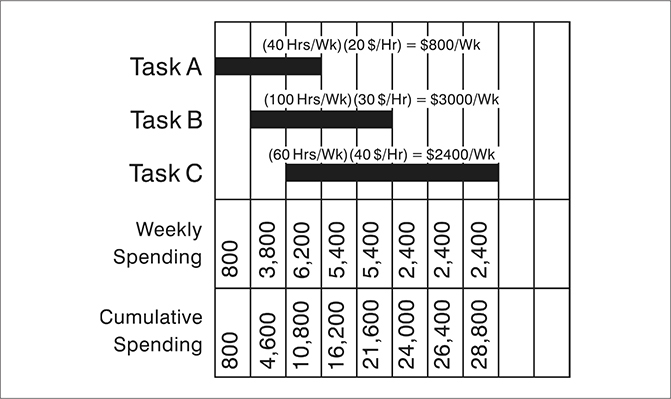
Figure 12.5 Cumulative Spending for the Three-Task Project
Once this curve has been plotted, we can compare progress to it so that deviations from plan can be spotted. To show this, I am going to use a new curve, one for a larger project than the simple three-task example.
First Case: Behind Schedule and Overspent
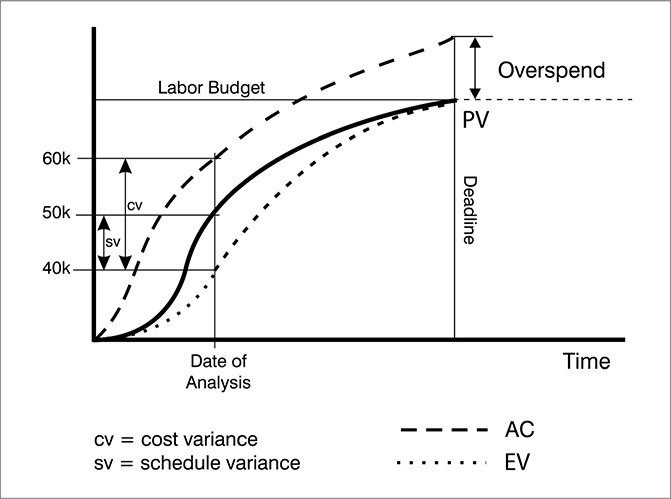
For this project, I have total cumulative spending of about $90,000. To show progress, I need to find out how much has been accomplished and how much it has cost. To do this, I go around and find out from each contributor how much work he or she has done, expressed as EV, and I add up the total value of everyone’s work. As you can see from the graph in Figure 12.6, people were supposed to have done $50,000 worth of work by the date in question. This was supposed to be 1,000 hours of work at a loaded labor rate of $50 per hour. When I total what they have actually accomplished, I find that they have only done $40,000 worth of work. In addition, when I collect their time reports, they have put in 1,200 hours of labor at a loaded labor rate of $50 per hour. Thus, the AC for the project work is $60,000.
Figure 12.6 Plot Showing Project behind Schedule and Overspent
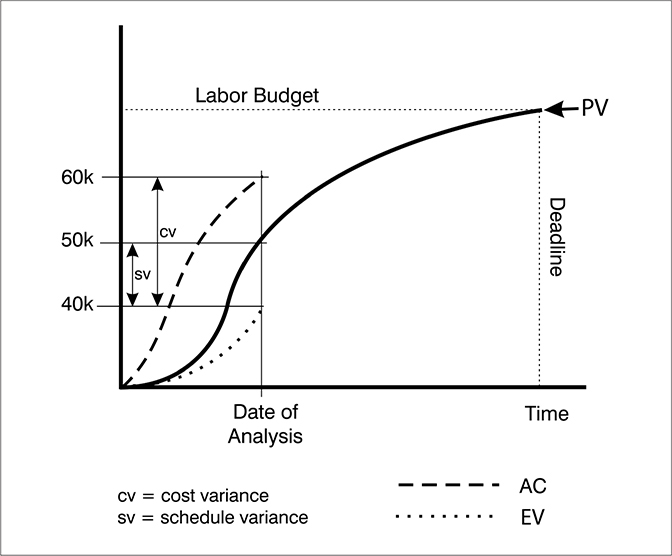
Returning to our progress questions, we first ask, what is the status of the project? We saw previously that the schedule variance is given by
SV = EV – PV
I suggest that you begin with schedule variance, because cost variance doesn’t always make sense until you know what has happened to your schedule.
For this project, the schedule variance is –$10,000 worth of work. This is calculated as follows:
SV = 40,000 – 50,000 = –$10,000
If you divide $10,000 by $50 per hour, you find that the project is 200 hours’ worth of work behind schedule. What this means in calendar time depends on the number of hours per day that are scheduled to be worked. However, you can tell the schedule variance by looking at the horizontal axis. This is shown in Figure 12.7.
Figure 12.7 Schedule Variance Shown on Horizontal Axis
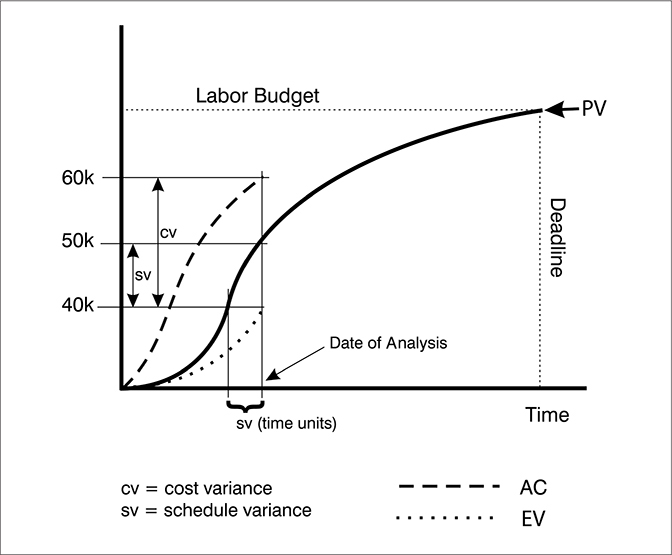
Notice that the schedule variance is shown both as a –$10,000 deviation on the vertical axis and as a time deviation on the horizontal axis. We have done $10,000 less work than was scheduled. We have also spent $60,000 to do the work, so the cost variance is $20,000. This is calculated as
CV = EV – AC
CV = 40,000 – 60,000 = –$20,000
Since a negative variance is unfavorable, we are $20,000 overspent. That is, we have spent $60,000 to accomplish only $40,000 worth of work. As you can see from the graph, the cost variance is the sum of the budget variance of $10,000 and the schedule variance of $10,000. We have spent $10,000 more for labor than scheduled, and we have gotten $10,000 less work done than scheduled. This is the worst state in which a project can be, but unfortunately it happens.
The second question we must answer is, what is the cause of the deviation? As was true for our housecleaning example, we don’t know. It could be that people weren’t as efficient as they should have been, or it could be that the estimate was optimistic to begin with. And, since we don’t have the ability to compare this project to another one, we can’t answer the question by comparing workers. All we can do in this case is do a review to determine if there were any factors that caused the work to take longer than expected, then try to project from there. We can also ask what to do based on those projections.
This is the third question—what should we do about the deviation? To answer that question, we need to have some idea of what is going to happen to the project. That is, where will it end up? If we had some way to extrapolate the EV and AC curves in Figure 12.7, we might be able to determine the end state.
You might do a linear regression to extrapolate these curves, but if you are on the very steep part of the PV curve, fitting a linear projection to the EV and AC curves can be very misleading. It would be better if you reestimated where the curves are heading, but I am going to pretend that we can fit a nonlinear projection to each curve, which would give the result shown in Figure 12.8.
Figure 12.8 Project with EV and AC Extrapolated
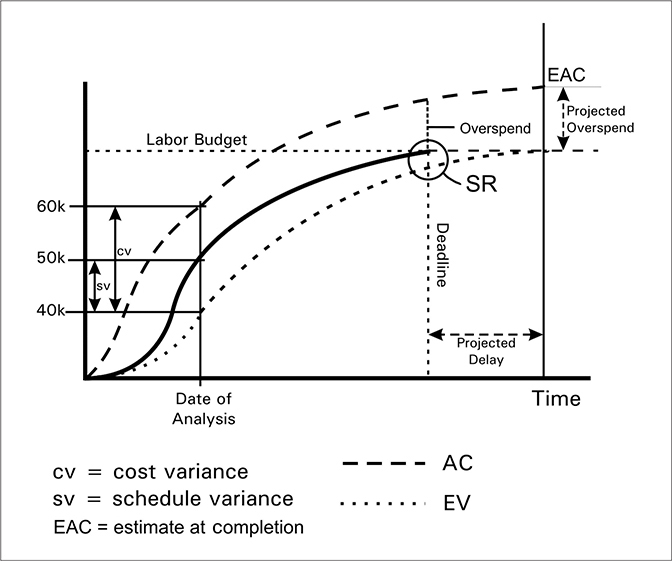
To extrapolate these curves, assume that if all the work is to be completed, the EV curve must eventually hit the BAC line (budget at completion). As you can see from the figure, it will do so later than originally targeted, so the project will be late. Second, the AC curve must hit the finish point for the project, so extrapolating it gives a new estimate at completion (EAC), as shown in the figure. Note that the difference between this new EAC and the original BAC indicates how much the project will go over budget.
Based on these projections, the project is going to be seriously late and overspent unless something can be done to get it back on target. What to do?
First, consider the worst case—that the project can’t be salvaged. It is going to be late and overspent. The question in this case is whether it is still viable. If it is product or software development and we estimate lost sales (because it is late) and increased development costs, we may find that the return on investment (ROI) is no longer at an acceptable level. If that is the case, unless something can be done to get it back on target, it may be prudent to cancel the job and get on with another project that will bring an acceptable return. If the ROI is unacceptable, the only reason we would continue the project would be if it is mandated by contract. If the product were a loss leader or one that was needed for position in the marketplace, then ROI wouldn’t be a factor and we might continue the job despite the projections.
But is there anything that can be done to recover? Perhaps. Notice that if the scope were reduced, the project could be finished by the original completion date, although it would still be overspent. This is shown as SR in Figure 12.8. If that is an acceptable trade-off, we would agree on a scope reduction, meaning that the plan would be revised, and we would continue.
Suppose, however, that you are told that it’s unacceptable to reduce scope, and it is not permissible to be late. You must bring this project in on time.
This means that you must somehow make the EV curve turn upward so that it intersects the PV curve at the deadline. This is shown in Figure 12.9. Also note that you will most likely incur even greater cost to make this happen, because you’ll probably have to throw resources at the project to complete it on time.
Figure 12.9 Project Ending on Time but Overspent
Of course, you can finish the project on time and on budget if you are dealing with salaried people who don’t get paid overtime. That is, you can appear to do so. But is that true? Is nonpaid overtime really free?
You can be sure it is not. You will pay in terms of lost productivity, increased rework, field failures, employee absenteeism, stress-related illness, or turnover. In a job market in which unemployment is only a few percent, people can find new jobs easily and may very well leave if unpaid overtime hours mount. And the cost to replace professionals in the United States today is in the range of $100,000 to $200,000. So your unpaid overtime can turn out to be very expensive!
As a final question, you may ask if there isn’t something that can be done to get the project completely back on track without going way over budget.
I can assure you that it would take a miracle.
I’ll cite the 15 percent rule: if you are 15 percent of the way into a project on the horizontal timeline and you are in trouble, you are going to stay in trouble. This means that if a project is supposed to take 100 weeks to complete, and you are in trouble at the end of week 15, you are going to stay there. Period!
How can I be so confident of this? Aren’t there any exceptions?
To answer these questions, consider a study that found that of 800 defense contract projects that were in trouble at the 15 percent mark, not a single one ever recovered (Fleming and Koppelman, 1996).
I know, I know. You’re thinking that this is typical of defense contracting.
But I can assure you that it applies to your projects as well, even if you aren’t in defense contracting.
How can I be sure?
Easy. Where did the PV curve come from?
The bar chart schedule.
Where did the schedule come from?
Forecasts—which are estimates. And we all know that if the weather forecast for tomorrow can’t be trusted, there is no need to believe the forecast for six weeks out. In other words, if the near-term forecast (just 15 percent into the project) isn’t right, why would it be any better at the end of the job?
This is a good-news, bad-news story. The good news is that you can forecast a losing project very early so that you can perhaps cancel it and cut your losses early on. The bad news is that even if it is doing well at the 15 percent point, it won’t necessarily continue to do so.
Second Case: Ahead of Schedule and Spending Correctly
To illustrate another combination, consider the situation shown in Figure 12.10. This time the EV curve shows that $60,000 worth of work has been done and that the AC is also $60,000. The PV target on this date was $50,000. The status is ahead of schedule, and the cost variance is zero.
Figure 12.10 Project Ahead of Schedule and Spending Correctly

Be careful to distinguish between budget variance and cost variance, as I cautioned earlier. The project is above budget by $10,000, but that is because it’s ahead of schedule. In words, the workers have done $60,000 worth of work (EV) and spent $60,000 (AC) to do it. A simple way to keep this in mind is that when EV is larger than PV, you have done more than scheduled, so you are ahead of schedule. If you have done less, you are behind.
The second question we must answer is, what is the most likely cause of this variance? Unlike the first one, where the project was behind schedule and overspent, this variance has a generic cause. Remember, this is labor cost. When you are ahead of schedule and spending correctly, it means that you have applied more resources to the project than you had intended, but they are working at expected efficiency.
In a shared-resource environment, that should raise a red flag. Where did you get extra resources? You don’t exactly have them sitting around in the hall waiting for something to do.
There are two possibilities. Either you stole them, or somebody got into trouble and couldn’t use some people and so sent them to you.
In a construction project, there is another possibility. The schedule had some weather delays built into it for safety, but the weather has been beautiful, so the work has been progressing ahead of schedule.
Now, before I refer you to the third question, I must tell you that I can predict your response. You are going to think, “Is he crazy?” Let’s see if I’m right.
The third question is, what do you want to do about the deviation?
See, I was right. You’re thinking, “Wait a minute. I’m ahead of schedule and spending correctly, and he wants to know what I’m going to do about it? Like nothing, man! Hide it maybe. I’m sure not going to slow down.”
Before you go too far with that thinking, you have to ask if being ahead of schedule can cause problems later on. And the answer is yes.
Suppose you deliver a product before the customer is ready for it. You may have to pay to warehouse it. You may also have to wait to get paid for it.
Speaking of pay, suppose the project is a construction job. Contractors usually want progress payments for their work, so they send you bills totaling $60,000. Your controller may kill you. Your plan said that you were going to do $50,000 worth of work, but the contractors have done $60,000. Although the difference may be small, the controller may have cash flow problems and tell you to slow down.
Darn. What a thankless job! Just when you thought you were doing something good, everyone starts trashing you.
It’s a matter of degree, you understand. If you are a little bit ahead, nobody will get excited. In fact, we all know that it is always better to be ahead than to be behind. But there are definitely situations where being ahead can be a problem. I know of a company that finished some equipment ahead of time and shipped it. It was delivered to a new facility—where the customer hadn’t finished building the loading dock. The manufacturer had to warehouse it temporarily and pay the rental charges.
Third Case: Behind Schedule and Spending Correctly
The next scenario is shown in Figure 12.11. In this case, EV is at $40,000, and so is AC. The target PV is still $50,000. What is the status? The project is behind schedule, but it has no cost variance. What is the most likely cause? Lack of resources. You may be waiting for supplies, or too little labor may be being applied to the project.
Figure 12.11 Project behind Schedule and Spending Correctly
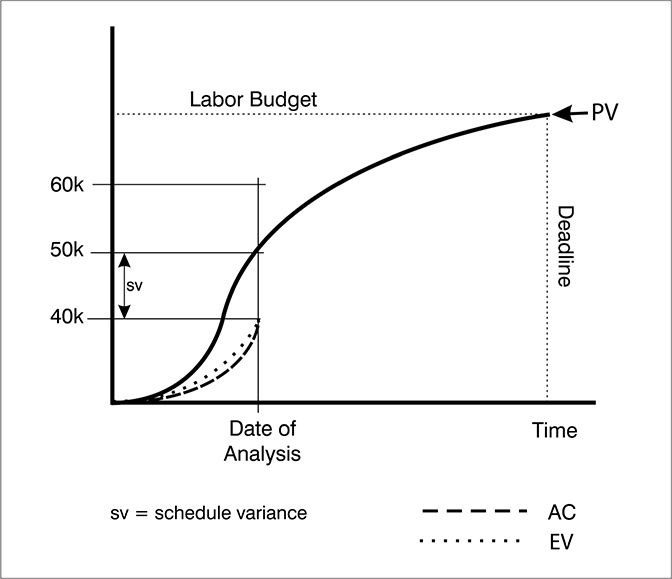
What do you want to do about it? Usually, you want to catch up. However, you can almost be sure that to catch up, you will have to blow your budget. It is usually better to stay on schedule than to try to recover once you get behind.
Final Scenario
Examine Figure 12.12. What is the status?
Figure 12.12 Project Ahead of Schedule and Underspent
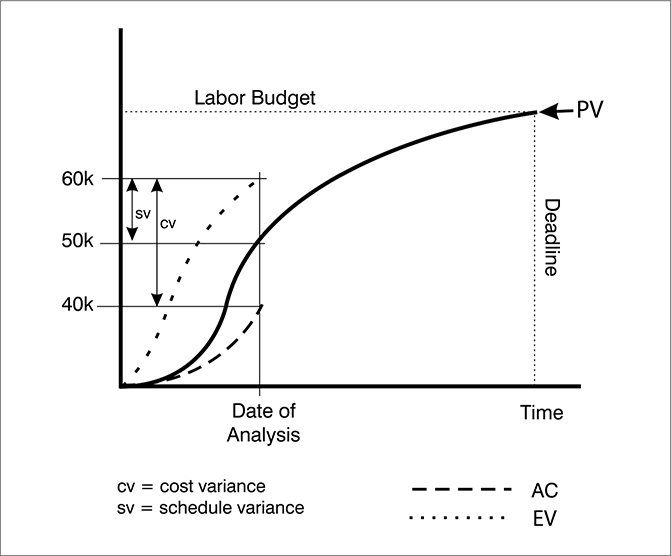
The project is ahead of schedule and underspent. How much? The work is $10,000 ahead (EV is at $60,000), and spending is $20,000 less than expected. In other words, you have spent only $40,000 to accomplish $60,000 worth of work. Sounds great, doesn’t it?
Not so fast.
What is the most likely cause of this variance? There are two possibilities. One is that the estimate was very conservative—to the point of sandbagging. The other is that you had a very lucky break. You can bet that sandbagging is far more likely than a lucky break.
Question three asks you what to do about it. I know what you’re thinking: Leave it alone. Hide it maybe. You sure aren’t going to slow down, and if you were to give the money back, they would expect you to do the same thing next time. Nobody in his right mind would do either—or would he?
I submit that you should give some of the money back and reschedule the project. If you don’t, the organization will lose the opportunity to make good use of the money until the project ends, and that opportunity cost can be significant.
Remember our first project scenario in which the job was behind schedule and overspent? We said that the project could be canceled if it is no longer viable, but it could be viable but still be canceled simply because there is no money to fund it. However, there would be money to fund that project if we freed it up from this one, which is under budget.
Notice that I said you should give some of the money back. As I have explained elsewhere, all work varies. There is some tolerance that we must accept as normal variation. If it is plus or minus 15 percent, then give all but 15 percent of the money back. Keep some in reserve to cover the variation. This is proper control of variance.
Again, I know what you’re thinking. If you give it back and then hit a rock later on, you won’t be able to get it back. This is true in many organizations. What I am advocating is that the organization must change the way it treats project budgets. They must all be examined once a quarter, with adjustments made in either direction. That way people will be willing to give back extra money, as they know that they will be able to get it back later if they need it.
In more companies than I care to count, the solution to this problem is simply to tell members of the overspent project to quit charging time to it. They are told to charge to the underspent project instead. That way, both projects will come in on budget.
In defense contracting, if you get caught doing this, you could go to jail. It is illegal, because earned value is used to determine when progress payments should be made to a contractor, and if you charge for work you haven’t done, you are lying, and this is illegal.
Most seriously, this tactic destroys our ability to detect a troubled project and do something to help it. Or, if the project is too far gone to be saved, we could cancel it. But we can’t tell that it is bad off if no one charges time to it.
In addition, this practice, called cross-charging, contaminates both history databases. Next time you do similar projects, you will underestimate one and overestimate the other. And you will be in trouble again.
Instead, an aboveboard adjustment to both project budgets should be made. The funds should be transferred from one to the other. This does not contaminate your databases and is acceptable.
USING SPREADSHEETS TO TRACK PROGRESS
The graphical method of tracking progress is effective at showing trends and visually presenting an overview of a project, but it is not very effective at determining the true state of the job. The reason is that the graph presents composite data for the project, and that data is not good for seeing problems that exist with individual tasks.
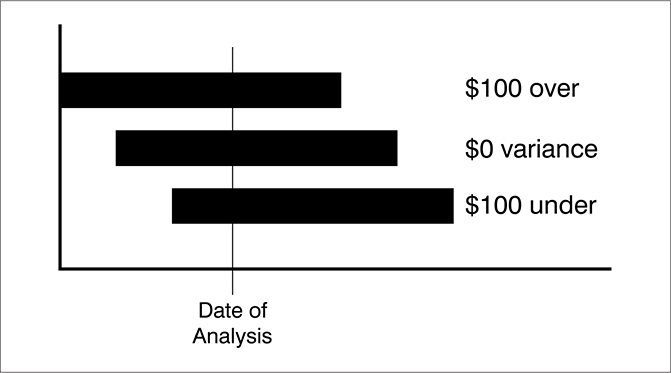
Consider the situation shown in Figure 12.13. There are three tasks going on in parallel. One is $100 overspent, the second is right on target, and the third is $100 underspent. What you see on the bottom line will be a zero variance in spending, because one deviation cancels the other. This would tell you that the project is fine when it is not. To really track progress, you need to look at every task, and the best way to do that is with a spreadsheet.
Figure 12.13 Three Tasks in Parallel
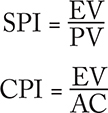
Most scheduling programs today allow you to report progress using earned value analysis and present it in spreadsheet format. However, not all of them have one feature that I find very useful, and that is the critical ratio. This is a performance index that is the product of two individual ratios. One is the schedule performance index (SPI), and the other is the cost performance index (CPI). These are shown as follows:
Before continuing, I think it is helpful to review the meaning of these equations. First of all, EV, or earned value, is a measure of what you got. The amount of work you were supposed to get is PV. SPI is simply work efficiency, or the fraction of work done. Finally, AC is the actual cost of work performed, so the CPI can be thought of as spending efficiency.
If the two ratios are multiplied together, you get a combined index called the critical ratio (CR):
CR = SPI × CPI
Like all ratios that indicate performance, the SPI and the CPI will have a value of 1.0 if the work is going exactly as planned. If the work is going better than planned, the ratios will be greater than 1.0, and if it is going worse than planned, they will have values of less than 1.0. When you multiply the two together, one of them may be slightly above 1.0 and the other slightly below 1.0, and the CPI can still be 1.0. As an example
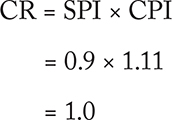
A spreadsheet that uses the critical ratio to indicate progress and suggest actions to be taken is shown in Figure 12.14. Note that the critical ratio is calculated in the next-to-last column, and that the last column is headed “Action Required,” which has the following meaning (this spreadsheet can be downloaded from my website free of charge).
Figure 12.14 Spreadsheet for Tracking Progress
A manufacturing process can be monitored by measuring the process outputs and plotting those measures on a deviation graph. If those measures fall randomly around the centerline, the process is in control. When the deviations cease to be random, there is a probability that the process is either out of control or about to go out of control. The tests for nonrandomness are beyond the scope of this book; a good reference is Walpole (1974).
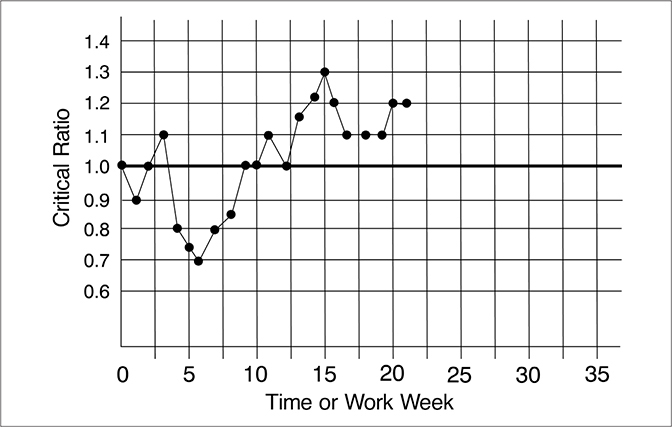
Critical Ratio Greater than 1.0
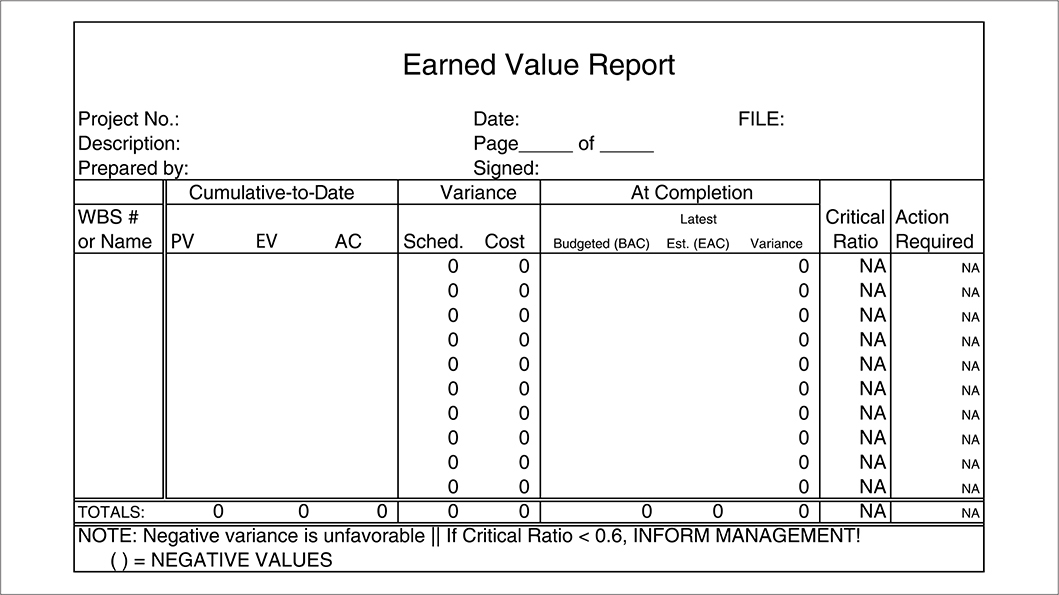
A similar idea has been developed for keeping track of the critical ratio over time. The control limits are shown in Figure 12.15. If the critical ratio is between 0.8 and 1.2, we consider the deviation to be acceptable. If it falls between 1.2 and 1.3, we are told to check the task (or project), and if the ratio goes above 1.3, we are told to “red flag” it. This means that the ratio is seriously out of line.
Figure 12.15 A Critical Ratio Control Chart
However, I said earlier that ratios greater than 1.0 mean that work is going better than planned. So why would a critical ratio above 1.3 be cause for concern?
Have you heard the saying, if something seems to be too good to be true, it probably is? The first concern is whether the data is actually valid, or people are deceiving themselves. If the data is valid, then what is going on?
In all likelihood, the project is way ahead of schedule and underspent when the critical ratio goes this high. Wonderful, you say!
Well, maybe.
But this is the last situation we examined in the section on tracking progress graphically, and we said that the project should be rescheduled and some of the money given back. So the critical ratio is flagging you that something should be done about the project.
Critical Ratio Less than 1.0
When the CR is between 0.8 and 0.9, it is in the check range. If it is below 0.8, it becomes a red flag, and if it drops below 0.6, we are told to inform management. The reason is that this project is really sick, nigh unto death. For a critical ratio to be around 0.6, the project is most likely far behind schedule and seriously overspent. It is a good candidate to be canceled (if that is an option), and cancellation decisions are usually made by senior management—so we are being told to inform them so that they can decide what to do.
Of course, this applies only to the overall project critical ratio. If a single task has a critical ratio of around 0.6, you wouldn’t tell senior management about it. It is you, the project manager, who should be alarmed and act. Chances are that if this task had any float, it probably doesn’t have much left; if it becomes critical and slips any more, it will impact the finish date for the project. You need to act immediately.
The spreadsheet shown in Figure 12.14 has an “if” formula in the Action Required cell to test the critical ratio against the specified limits, and it displays the words Okay, Check, or Red Flag in the cell so that you can scan the right-hand column and see your trouble spots immediately. In addition, you can set up conditional formatting of the cell to highlight it in red, yellow, or green to correspond to Red Flag, Check, or Okay, respectively. You can then distribute color printouts that make it very easy for people to spot problems.
Forecasting Final Cost and Schedule Results
There are a couple of ways to forecast results for a project. One is to replan based on what has been learned to date. Another is to calculate forecast results using earned value data. Perhaps the best would be to do both.
The most common and most accepted of the statistical forecasting methods is to use the cumulative CPI estimate at completion (previously labeled EAC on the projection graphs). The formula for making this projection is
![]()
If we go back to the first project status example we used, in which the project was behind schedule and overspent, and ask what the EAC will be, we would get the following. The original BAC (budget at completion) is about $90,000. The current EV is $40,000 and the AC is $60,000, so the CPI is therefore 0.533 (the numbers in the equation are expressed in thousands):
![]()
This calculates to an EAC of $153,800. If nothing is done to bring spending in line, the project is going to be overspent severely! The only problem with this formula is that it is a more or less linear projection that depends on the slope of the curve at the present time for its forecast. It is better to reestimate each task and forecast from those estimates, but this is a quick way to find out how much trouble you are in.
ALTERNATIVES TO EARNED VALUE
As far as I am concerned, there is no completely adequate alternative to earned value tracking. I showed at the beginning of the chapter that unless you know both how much effort has gone into a project and where the schedule is, you can’t tell whether you have problems. However, there are some approaches that can be used in lieu of earned value if you simply can’t find a way to measure EV, for example.
Using Run Charts
One of these is the run chart. You can plot any four of the project variables (P, C, T, S) using this approach. The chart in Figure 12.16 shows a plot of a fraction of work completed each week for a hypothetical project called “Echo.” To plot the fraction of work completed, you divide the amount of work completed to date by the amount of work scheduled to be completed. This could be called percent of scheduled work actually completed and is equivalent to the ratio EV/PV. From this chart, you can see that there is a downward trend starting in week 3. People are clearly having trouble. Then they somehow begin to recover, and there is an upward trend that peaks in week 15, then falls back a bit. Since the work following week 12 is being performed at a faster rate than scheduled, it is likely that the project will finish early, possibly by week 21, rather than as scheduled in week 23. This chart is highly unlikely to occur in reality, because the team is in a lot of trouble early on, but it illustrates the approach.
Figure 12.16 A Run Chart for Project Echo
There are two guidelines for interpreting run charts to detect meaningful systemic changes:
1. Since it is expected that there would be approximately the same number of points above the average line as there are below it, a good rule of thumb is that if there is a run of seven consecutive points on one side of the average, something significant may be happening, and it would probably be a good idea to call “time out.”
2. A second test is to see whether a run of seven or more intervals is steadily increasing or decreasing without reversals in direction. As such a pattern is not likely to occur by chance, thereby indicating something needs to be investigated (Kiemele & Schmidt, 1993, pp. 2–25).
To track quality, you might want to record rework hours. It is likely that most projects will incur from 5 to 40 percent rework. If you are improving your project management process, you should see a decline in rework. A run chart that tracks hours spent on rework is shown in Figure 12.17.
Figure 12.17 A Run Chart for Project Echo Showing Rework
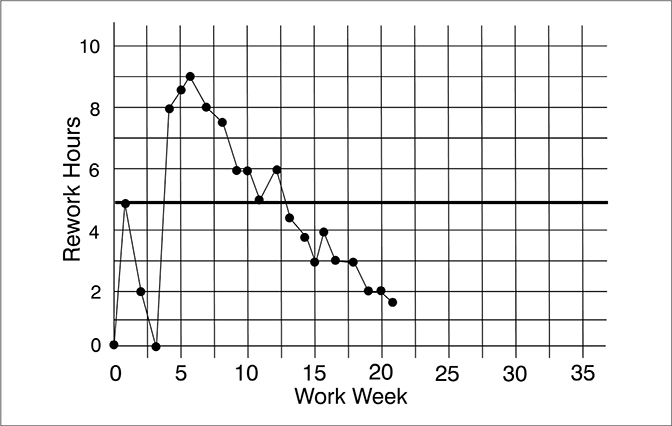
If you compare Figure 12.16 with Figure 12.17, you will notice that the curve showing rework hours is almost a mirror image of the progress curve. This suggests that one reason that the team was not making good progress prior to week 10 is that they were making numerous errors, which had to be corrected. After week 10, the team had reduced the rework significantly, and their progress reflects this. These figures would be for a very small team.
Other indicators of project quality might be documentation changes, engineering changes, design revisions, customer complaints, test failures, number of software bugs, and so on.
It is also useful to track the number of scope changes in a project, but you need to capture the impact of a scope change for this to be meaningful. You might be able to absorb a dozen small scope changes with almost no impact on the project, while a single larger change in scope might nearly sink the project. Since scope changes result in additional work, you can track their impact by looking at the dollar value of the extra work required (or the number of working hours if you don’t have dollar figures). You can also show impact by any resulting slip in schedule.
The other issue that should be addressed is the cause of the scope change. If the cause was, say, new environmental regulations that no one could foresee, then the scope changes are probably legitimate. On longer-duration projects, the world is going to move around before you can finish the project. Competitors may bring out products that necessitate changes in your design if you are going to continue to compete. This is understandable, although sometimes you should go ahead and freeze a design without the competitive feature, release it, and then start a new project to add that feature. It all depends on how critical that feature is for product sales.
On the other hand, if changes were required because not enough time was spent up front in defining the project, they are wasteful and should be avoided in the future.
Guidelines on Tracking Progress
Although it seems obvious, there is very little need to go to the trouble of tracking progress unless you keep accurate records. If you don’t want to use the information for control, but rather want to make your project look good, then why bother to collect data? Just write down what you want people to see and save yourself a lot of effort.
There are two major sins committed in tracking progress. One is to let people record their time once a week. I know. I did this 40 years ago when I didn’t know any better. We had to record time to the nearest quarter-hour, and we turned in the reports on Monday morning.
Even when I was younger, I could never remember what I had done the previous Monday. Now I can’t remember what I did yesterday. So when my time report was due, I guessed at it the best I could, but you can be sure that it was highly inaccurate. That means that the database was a fiction—one that would subsequently be used to estimate future projects. It was useless!
The only reasonable way to record work is to do it daily. It doesn’t take that long. If it takes longer than five minutes, you are being obsessive. I don’t think it makes sense to record time in increments much less than a half-hour. If you work an eight-hour day, that is 16 entries into your time log. It should take less than 15 seconds to write each one down, so that is about four minutes. (Okay, you’re slow; allow yourself 10 minutes, but that’s it.)
The second deadly sin is to not track unpaid overtime. In some organizations, salaried personnel are allowed to report only 40 hours a week, because that’s all they are paid for. That is a payroll issue, not a project one. For project purposes, you need to know exactly how many total hours are spent on a task so that your database will reflect actual hours for use in future estimating. In addition, if you strip off the overtime, you can’t tell that you have problems, as was shown at the beginning of this chapter.
PROJECT CHANGE CONTROL
One major cause of project time and cost overruns is scope creep. Stakeholders ask for “small” changes. They aren’t very significant, so you absorb them. The problem is, five-cent changes add up to dollars, and the next thing you know, the project has grown considerably larger than it started out to be. Feature creep is also a cause of scope creep. The interesting thing is that the very people who ask for all the changes develop very convenient amnesia at the end of the project. To protect yourself and everyone else, you must control changes to the project.
This is done through a formal project change approval process. When someone asks for a change to the project, you should let that person know the impact if the change is made. What will it do to schedule, cost, or performance? Then ask if the individual really wants to accept the impact. If she says yes, then you initiate a formal change procedure.
This procedure requires that a change be approved by more than just the person who asked for it. The change may impact the inventory of parts that have already been purchased for the project. It may affect market introduction of a new hardware or software product, which could have a severe impact on sales. It may affect tooling. So a formal change process requires that an approval board review all of these possible effects and sign off on them.
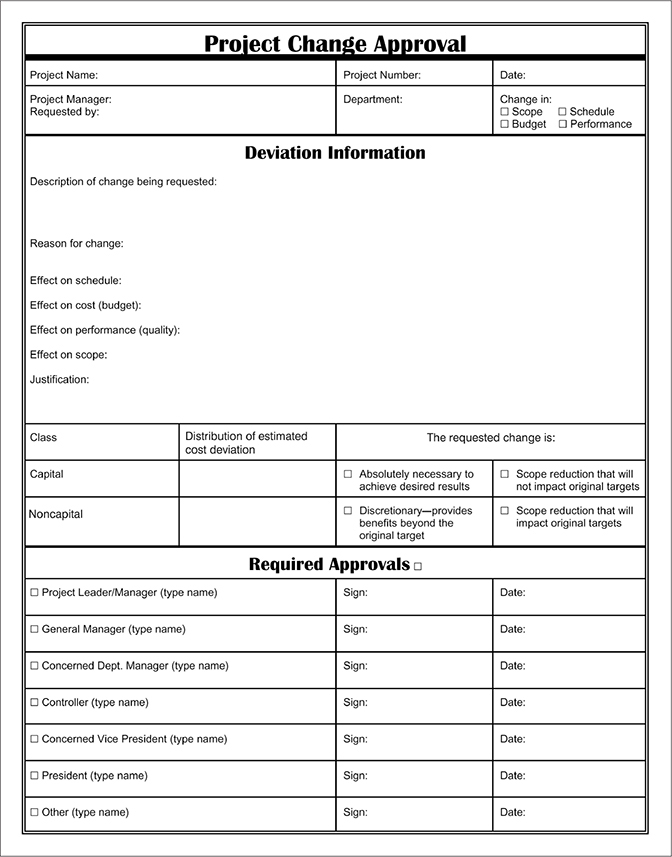
The form shown in Figure 12.18 can be used to control changes to a project. Note that tick boxes are placed in front of signatories so that, unless the box is checked, that person does not have to approve the change. The rule is that only those individuals who have a need to review the change should sign the form. That way, you cut down on the endless rounds of approvals that can delay the process.
Figure 12.18 Project Change Approval Form
 IN SUMMARY