Chapter 4
Practices for SitPM
Several sources describe so-called project life cycles to select from. The use of the word in this context can be misunderstood. It is not used to describe phases that the project will inevitably go through, but is used instead to explain approaches to managing a project. In Chapter 3, I described project types, which means a typification to help understand what specific projects are. In this chapter, several topics may seem to be repeated, especially the tension field between predictable and Agile projects. There is nevertheless a fundamental difference, because in this chapter, the question is not what the project is, but how you approach and manage it.
In Chapter 3, you were an observer, trying to understand; now, you become an actor. When you are assigned to a project, you have only a few options to select from: yes, no, and maybe a “yes, but . . .”. Often, there is not an option to say no. After that moment of assignment, you are responsible for how you manage the project, your decisions and actions, as well as their outcomes, intended and unintended. There are of course some “Zombie” projects, in which project managers have no chance whatsoever to be successful. It is mainly the beginners in project management who are assigned to these Zombie projects; people who still lack the experience that with all the effort and acumen that they will invest, they are bound for failure.
This chapter relates to all other projects, in which project managers have a chance to meet their duties and have great projects. You need to understand which practices can lead to success and which ones cannot. Robert Wysocki* used a four-quadrant model to describe lifecycle approaches, see Figure 4-1.
The dotted grey arrow describes how, in his understanding, uncertainty grows from the bottom left quadrant to the top right. The approaches that he recommends depend on the quadrant in which a certain project is located:
Traditional. Well-defined projects, in which the project goal is specified and the solution to achieve this goal is also known—in most cases, because the solution can be derived from other, similar projects. This is the classic concept of a highly predictable project.
Agile. The goal is clear, but the solution that leads to achieving the goal must be developed during the course of the project. An organization may need a new machine or software to meet specified objectives.
Emertxe*. The solution is clear, but the goal needs to be discovered during the course of the project. The organization’s leaders have decided to implement a new machine or a new software and explore new opportunities that come with the solution.
Extreme. Neither the solution nor the goal are known. The old machine or software is outdated, and all the organization’s leaders know at this point in time is that a replacement is needed.

Figure 4-1 Wysocki’s four-quadrant model.
The interesting thing about Wysocki’s work is that he not only rejects a “one-size-fits-all” understanding of project management but also gives advice on the specific use of practices. While his approach focuses on life cycles and process assets†, I am more interested in behaviors and approaches. The two points of view are not contradictory, but complement each other. The focus in the following discussion will rather be on the dotted line in Figure 4-1, which describes the tension field between predictable projects and total uncertainty. It also stands for the approach that the team must take to cope with the growing uncertainty by increasing team cohesion and intensifying communications when risks are increasing.
Another aspect of the chapter will be leadership behaviors. I will use a model by Professor Jean Lipman-Blumen, called the Achieving Styles Model, which uses three groups of nine styles to describe how people in charge master their challenges. For the approaches and the achieving styles, I will give some hints how they can be favorable or detrimental in projects or project situations of a given type.
4.1 Introductory Questions
This chapter discusses some more topics that may be new to most readers. Some of the following introductory questions relate to these topics and may therefore be hard to answer. They require knowledge that readers will first need to obtain by reading and probably also by reflecting on their own behaviors and those of people they work with and have worked with. It may also be interesting to research your own experience and consider observations relating to the performance of others to try to find both confirmations and contradictions.
You may try the questions now, or read the chapter and then answer them.
- 1. A corporate Project Management Office (PMO), which governs a major number of internal projects of an organization, made the decision to change to Agile methods for its entire project portfolio. What are the detrimental effects of this decision?
- Agile methods require long-term planning that may not be possible to implement for all projects in the portfolio.
- Certain projects or situations during projects may require more predictive approaches that Agile methods do not sufficiently support.
- The training demand for Agile methods is massive, and may block resources that the organization needs to meet their contractual obligations.
- Agile methods consist of a strong top-down approach that employees may consider outdated and deeply demotivating.
- 2. Which is a common signal that a project manager applies the “social” achieving style?
- The leader supports others from “behind the scenes”.
- The leader creates an aura of “charisma” around him or her.
- The leader delegates tasks to the person who is the best fit.
- The leader delegates tasks as “stretch assignments”.
- 3. “Iterative-incremental” is another word for what kind of project management approach?
- Rolling wave
- Waterfall
- Agile
- Predictive
- 4. A project manager acts as the most productive team member and subject matter expert with the highest degree of expertise. Which achieving style does the person apply?
- Social
- Power
- Intrinsic
- Vicarious
- 5. If “the way is made by walking” in a project, which approach should be considered the most promising one?
- Waterfall
- Agile
- Top-down
- Rolling-wave
- 6. A customer project is going to be performed for a client organization and the project manager has just been chartered by the contractor organization.
The manager in charge on the customer side has a history of former projects during which interests of the organization were enforced against the various contractors in a highly forceful manner. Contractors often finished their projects with losses, and several of them were later sued for minor mistakes that their teams made during the projects. Which achieving style best represents the manager on the client side so the project manager is prepared?
- Competitive
- Collaborative
- Entrusting
- Power
4.2 Lifecycle Approaches
Several sources describe so-called project lifecycles. They actually mean approaches to project management; it may well be that these approaches need to be adjusted during the course of the project to different tasks and situations. A project to build a bridge near to a cultural heritage location may have an early creative phase that is dedicated to developing a design that avoids disruption of the historic view. Creative phases are commonly better managed with Agile approaches, as creativity is generally hard to predict. Later in the same project, when the bridge is physically built, a predictive approach will be necessary. Resources must be booked early, work must be procured beforehand to ensure that the results will be available on time, and the project cannot have many changes that would necessitate the renewal of existing approvals by government agencies and other stakeholders.
In this book, I use the term “lifecycle approaches” to reconcile the two definitions. This should not be misinterpreted that they are necessarily used identically from the beginning to the end of a project.
4.3 Agile Approaches
In a discussion with the head of the Project Management Office (PMO) of a company from the electronics business, I was told in 2014 that the company was switching all projects to “Agile methods”. Agile methods were popular between 2000 and 2010 and are often considered another form of “best practices” by some companies and consultants. Others made the change to Agile methods for their projects with high hopes and were disappointed to some degree. Talking with experts in Agile methods, their common response is that the methods have been applied incompletely, and that too many projects have the term Agile as a label but are still “Waterfall” and “command and control” projects. For some people, agility has become an ideology or a dogma, something that I call “Agilism”. I think that it is time to explain the terms, as not all readers may be familiar with all of them.

Figure 4-2 A project performed along a sequence of sprints with fixed time boxes.
Agile methods expect that change requests will come quickly and frequently, and they should be generally accepted. As each of these changes will come unexpectedly, there is no firm long-term planning; instead, planning is limited to one to four weeks’ development cycles, often referred to as “sprints”. It is a misconception that there is no planning in Agile methods since they require frequent planning at the beginning of each sprint. Sprint durations are fixed—an approach also called “time boxing”. During a sprint, no changes are implemented; they are collected and then discussed and decided upon between the sprints. At the end of a sprint, the team also discusses what it has achieved so far and bases decisions for the next sprint on the results (see Figure 4-2).
Agile approaches are commonly based on a document called the “Manifesto for Agile Software Development”, often just referred to as the “Agile Manifesto”*. Starting in software development, the concepts were transferred to other applications for projects. There is, for instance, an “Agile organization development manifesto” for projects dealing with organizational development. The principles have been formalized in several methodological approaches, of which a method called “Scrum” has become the most popular. The basic assumption in Agile methods is that internal requestors of projects, customers, users of deliverables, and so on are generally unable to describe their requirements against these deliverables with sufficient accuracy and completeness for a team to just develop them. This assumption leads to constant change that is not manageable by a project team. For this reason, Scrum uses so-called sprints (periods with fixed durations commonly between one and four weeks), during which no change requests are brought up to the team. Change requests are instead collected by a role called the “product owner”. Between two sprints, there is some time to review and discuss the results of the sprints, and during this time, the change requests can be brought to the team for implementation in one of the next sprints, unless they are rejected. Scrum has another role, called the “Scrum master”, who ensures that the team adheres to Scrum principles but is not a project manager; the Scrum master is more of a moderator position. This interplay of periods with static requirements and moments when changes are implemented has some benefits. One is that the team develops a working rhythm, which can make it quite productive. Another is the desire to have a “potentially shippable product” at the end of each sprint, which means that it has the maturity and quality to form a product on its own, something that would be called a “quick win” in other methods. It has some similarity to the work breakdown structure (WBS) used in other methods that has been traditionally structured by deliverables*. Most Scrum teams would nevertheless reject a WBS as too predictive and “command and control” oriented but would follow the principle that their sprints should have a product at the end. I will describe Scrum in more detail in Chapter 5.
Agile methods have a major disadvantage, which is the negligence of work flow and the logical relationships of work items like work packages or activities with the possible consequence of rework. I recommend a definition of rework in project management as laying hands again on a deliverable that was considered finished previously in order to repair or alter it. Agile methods mostly reject defining work flows in network diagrams and similar tools as too predictive, restrictive, and command-and-control oriented. They prefer that team members self-organize and also self-select their tasks instead of having them assigned by a project manager. Many Agile methods, therefore, even reject having a project manager. This reliance on self-organization can work well, but it can also lead to a kind of “biscuit plate” project management, which allows team members to select the specific tasks that they like to work on at the moment, similar to how children select biscuits from a dish: “I want the one with chocolate”. Tasks performed in the wrong order inevitably lead to rework and are among the top reasons that projects miss deadlines and budgets. The hours it takes to rework a project is a great metric to measure the efficiency and quality of work done by a project team. A solution in Agile teams is to never consider a deliverable finished, but this solution collides with the concept of “potentially shippable products”, and with the simple fact that at one point in time, the entire project with all its deliverables should be considered finished.
Another problem in practice is that Agile methods work best in solid, well-rehearsed, and dedicated teams comprising subject-matter experts with strong mutual respect. This builds that “bands of brothers and sisters” and actively avoids the emergence of game-theoretical dilemma situations. Colocation, placing the team in one location, is definitively helpful, but distributing a team that has been collocated in the past and successfully went through the often difficult phases of team development can also be a successful approach, as discussed previously. A survey conducted by the Scrum Alliance from 2015 stated that the average team size is seven people, which complies with recommendations made by Scrum experts that a team size of four to nine people provides the best results and is therefore recommended. Many organizations expect their teams to do a lot of multitasking, and they construct teams from individuals who have not gone through the phases of team building and do not have time and physical proximity to do this during the project. The team size is also not feasible for all projects, at least not without the risk of team fragmentation. Agile methods seem to work much worse in such environments. On the other hand, having a small team without fragmentation that is well-rehearsed and competent in the subject matter, located in physical proximity, and protected from disruptions from the need to meet other business demands is a good recipe for a successful project anyway, regardless of the practice in use.
Agile methods are highly disciplined; however, they are often abused as cheap excuses: “We do not have a plan. We are Agile, you know”.
I already mentioned Agilism. Some promoters of Agile methods developed some kind of ideology around these methods. They consider Agile approaches and methods generally superior, independent of the specific project situation, and insist on the implementation of aspects of Agile methods (such as self-organization and self-assignment of team members to tasks) with an almost religious zeal. For them, the world of project management consists only of two approaches: Waterfall and Agile. The perseverance for Agile methods comes with a fundamental rejection of the waterfall. Grey-shades between the extremes are not considered. If a person’s only tool to earn a living is a hammer, the person must convince people that the world is made of nails.
4.4 Waterfall Approaches
In a waterfall, water can move only in one direction: down. This metaphor is used to describe predictive models with long planning horizon, as shown in Figure 4-3.
Predictive methods are a response to the dilemma situation of the learning process discussed in the second chapter. Early in the project, project managers have many options for decision making, and most are inexpensive, but the knowledge is still not created to see the need for the decisions and to make them. Later in the project, there is much more knowledge, and the need and the options for decision making are much clearer, but the number of these options goes down and becomes more and more expensive. Chapter 2 described how project managers try to bend the learning curve to recognize the needs for decisions and the available options earlier, at a time when these options are more numerous and less expensive. Predictive methods are used as tools that project managers can use to accelerate their learning processes. At their core is network diagramming.
Predictive approaches were used when modern project management began in the late 1950s. Some major endeavors made it necessary to improve planning on top of bar charts and WBS that already existed*. It is interesting that several developments were made at roughly the same time and independent of each other:

Figure 4-3 Two “waterfalls”: A sequential and an overlapping model.
The Polaris/Fleet Ballistic Missiles program to develop and build submarines and nuclear missiles to be launched from these submarines, programs with unprecedented complexity, on a technical level as much as on organizational level and risk. A small mistake could have sent the world into a third World War. The U.S. Navy had two development mandates for network diagramming given to teams. One was headed by Willard Fazar, which resulted in a method for use with computers named Program Evaluation and Review Technique (PERT)*. The other one was led by John Fondahl for manual application, and it led to a method called Precedence Diagramming Method (PDM)†.
Developments by Du Pont and Remington Rand Univac, performed by James Kelley and Morgan Walker, which led to the development of a third method called Critical Path Method (CPM)‡.
A fourth method was developed in France by Bernard Roy at about the same time, called Metra Potential Method (MPM), for the development and manufacture of the cruise liner, France, whose keel was laid down in 1957. When the ship was taken into service in 1962, the France was the longest passenger ship ever built, with a length of 315 m (1,035 ft). It incorporated new, component-based production methods that made more sophisticated planning methods necessary to coordinate contractors with long-term assignments. MPM had basic similarities with PDM but used different types of dependencies between activities, which made the diagrams more flexible and meaningful but harder to understand.
In about 1960, PDM was merged with elements of CPM, and in the following years, the flexibility of dependencies between activities that MPM had developed was introduced to PDM. This laid the foundation for the subsequent success of network diagramming to make projects more predictive and help identify problems early, especially deadlines that the project is going to miss, and as a tool to visualize project work flows, simulation, and optimization. A brief introduction on this enhanced PDM network diagramming is provided in Chapter 5.
There are several factors that make long predictions necessary, among them early booking of resources and early awards of contracts to subcontractors who need to have their work results finished on time. Another factor not yet discussed is the need in matrix organizations to coordinate the functional organization and the various projects. Most functional organizations are set up for operations and take from this direction the benefit of better predictability of their work that is due to its repetitiveness. In matrix organizations, there are many points of intersection between the functional business and the projects: They share and exchange resources and deliverables and compete for management attention. When a project makes a major mistake, this impacts the functional organization and vice versa. At these points of intersection a kind of domino effect can take place, when the delay of a project causes delays in the functional organization, and risks, problems, and conflicts are also transferred over the domain border between projects and the line organization. As said before, in most organizations, it is the job of these line organizations with their operations to earn income for the entire organization. Many organizations, therefore, try to force projects into the same predictability that has been so successful in operations since the beginning of the industrial revolution and even possibly much longer. In such cases, the functional organization does not understand the specific element of uncertainties in projects, and often enough, its managers do not want to know it.
The key to predictions are the various network diagramming methods. The PDM method is used by most modern desktop software programs. So-called “Gantt chart” views look quite different, but the underlying logics and mathematics are the same. Further enhancements came later with methods like Graphical Evaluation and Review Technique (GERT), System dynamics modeling*, and the Critical Chain Project Management (CCPM)†. The last one is interesting as it changed some paradigms in network diagramming. Traditionally, the concept was to do work as early as possible, but CCPM recommends to do work just in time by adding dedicated time buffers when critical activities pick up deliverables from uncritical ones and must be protected from delays in them by adding time buffers, which in turn make the plan robust against deviations from duration estimates. The approach supposedly leads to a reduction in rework and, therefore, of overall work and helps speed up a project quite dramatically. There are two caveats. Just like Agile methods, CCPM recommends dedicated teams, free from fragmentation and multitasking, that can focus on the project. I identified another caveat in classes. Developing a CCPM plan takes roughly twice the time compared that needed for a traditional PDM plan. CCPM promoters correctly say that this investment will be paid back when duration variation occurs. That generally leads to rewriting plans in PDM but is mostly captured in the time buffers of CCPM plans that can remain unchanged. The problems come when a plan needs alteration because a change request has been approved for the project, or because a plan was found unrealistic. The time and effort needed to change the plan increases.
Today, network diagramming is aided by computers with relatively inexpensive software, at least compared with the prices of the systems in use during the 1950s and 1960s, and even free solutions are available today (which have restrictions in functionality and comfort). They all simplify and accelerate the tasks of developing network diagrams, drawing them and doing calculations in them, tasks that are arduous when done manually. The free tools have the benefit of simplicity; you can learn them simply by using them. Advanced tools with their complexity help solve more challenging planning tasks and are faster to use in the hands of experts but need dedicated training‡. With all of these improvements from the past and the help of software, it is surprising that network diagramming is not used more frequently. In 2012, I tried another ad hoc survey on the question, “Are you using network diagramming?” in a LinkedIn group with project managers. At one point, I had to stop it. I had to accept its failure, because too many respondents had no idea what network diagramming was, and, therefore, did not understand the question, as I could see from the comments that they gave in addition to their answers. Their answers “polluted” the results and made them useless.
To make this clear: Network diagramming should be in the toolbox of every situational project manager to master projects and project situations that clearly require workflow definition and long-term prediction. It is a good practice and one of the most important tools, when “. . . it is necessary to take a strategic look at the entire job when planning, and to firm this strategy, in order to establish practical work sequences”*. My observation is that it is widely in use in construction, infrastructure, engineering, and to a lesser degree, in aerospace and defense. I found that it is not typically used in software development and implementation projects, organizational development, or marketing. Until some years ago, it was also not used in automotive product and production development. This seemed somewhat surprising, and I asked automotive project managers why they did not use network diagramming. The response was: “Mr. Lehmann, you seem to know nothing about our industry: We use different project management software than other industries, a product called RPlan, and this software does not support network diagramming”. I met the principal founder of the vendor company of RPlan, a Munich-based company called Actano, years ago, and I asked him why the software does not support network diagramming. The answer was, “Why should it do that, network diagramming is not used anyway”. Major changes have happened to the company since that time, and the software has been expanded to fully support network diagramming. Automotive development projects need a lot of prediction, and network diagramming has found its way into the offices of their project managers. It helps them perform better projects with better predictions and less rework.
Waterfall methods are generally implemented to meet stakeholder expectations; however, they sometimes serve as inexpensive excuses: “No, we will not implement the change that you desire. It is not in the plan, you know”.
Some promoters of Waterfall methods also developed some kind of ideology around them, something I call “predictionism”. They consider Waterfall approaches and methods generally superior, independent of the specific project situation, and insist on the implementation of aspects of predictive methods, such as long-term planning, top-down command-and-control structures, and rejection of stakeholder influence that may lead to change requests and to the need to re-plan major parts of the project. In their insistence on long-term predictability, they also develop an almost religious zeal (similar to the folks I referred to with Agilism). Again, they consider the world of project management a dichotomy with only two approaches: Waterfall and Agile. However, for these people the insistence on Waterfall methods comes with a fundamental rejection of Agile methods. Grey-shades between the extremes are not under discussion. If a person’s only tool to earn a living is a screw driver, the person must convince people that the world is made of screws.
There is another aspect of predictive methods that is commonly overlooked: The plan must be complete, and the planners must not miss any work item during planning. An overlooked but necessary activity somewhere in the network, identified late, can make the entire schedule that has been derived from the network not feasible. A common example is rework after tests. Many network diagrams include testing activities and plans to immediately go on with their productive work after the test has been finished. They ignore the fact that the result of the test may be an identified need to fix errors and to do rework, for which no time has been planned and no resources have been booked. The assumption that all tests can be passed on the first try or that errors found can be fixed without impacting the schedule shows the planners may have been too confident.
4.5 Rolling Wave Approaches
Many projects are performed inside an organization’s project portfolio. Small organizations may define all projects performed as just one portfolio, while larger ones may have more than one defined, each of them under control of another manager or management team. Portfolios can include internal projects, called for by an internal requestor and done for the organization’s purposes or for an external customer who is paying for the project. A portfolio may also be a mixture of both types.
A company called Marten Inc. had a portfolio defined with three customer projects (for textbook simplicity—most portfolios are much larger), each with one deadline (also to keep the exercise simple). We call them Project A, Project B, and Project C and the deadlines also A, B, and C. The company made an assessment on where the projects stood and came to the following results (see Figure 4-4).
Project A and C are on schedule and able to meet their deadlines, but B is late. To make things worse, Project B is the project with the nearest deadline, and its project team is the one in trouble. Missing the deadline can lead to damage claims or contractual penalties*; it will make the customer angry and damage Marten’s reputation. Meeting the deadline is both urgent and important. Marten made a decision to accelerate the project. De-scoping is not possible since Marten is working for a customer under contract, and other opportunities to increase the speed of the project have all been used to the maximum extent possible. The last option is to add more people, equipment, money, and so on to the project, something we commonly call “crashing”. It is indeed possible for Marten to meet the deadline of Project B, and a sigh can be heard across the entire organization when the project is over. It was over budget, of course, consuming more employee working time than originally expected, but it was finished on time, and the customer could not reject the last payment.

Figure 4-4 The project portfolio at Marten Inc. with three projects. Project A and Project C are on schedule, but Project B will miss its deadline.

Figure 4-5 Project B met its deadline, but Project A and Project C are now in trouble and on the way to missing their deadlines.
Where did Marten find the additional resources? Marten’s managers made a prioritization decision to focus on Project B, the crisis project, and took team members from Projects A and C, as shown in Figure 4-5.
The prioritization goes on: Project A is the next one that needs to meet a deadline, and resources are shifted there as well. When it is finished, Project C is crashed. Figure 4-6 shows the final situation of work and cost levels over the portfolios.
One may believe that with the end of Project C, the problems have been resolved. Marten may now be able to press a virtual reset button for its business and start being profitable. Unfortunately, the bids for Projects D and E have been won during that time, which helped the company secure future income but increased the already high stress level of those employees, who are active in projects.
The project managers finished their projects with a mixed perception of success and failure. They met the deadlines and avoided complaints for late deliveries, but the projects did not make the expected profits. For the entire organization, the overall results were even more detrimental for the following reasons:
The “Law of Diminishing Returns” or “Law of Diminishing Marginal Utility” (also called Gossen’s second law) says that when resources are added to existing resources, each of these new resources will add less value. A person thirsty in the desert may be prepared to pay a fortune for a glass of water. The fortune the person would be prepared to pay for the second glass would probably be much smaller, and so on. At one point in time, the person’s thirst will be quenched, and the person will not need to pay anything for a glass of water. In the Marten example the productivity of a team will not grow proportionally with the increasing team size; instead, the team efficiency will go down. Members who are new to a team will take some time to become productive for various reasons, one being that they have to become familiar with their tasks, and while the incumbent team members have to train them, their productivity decreases as well.
The “Law of the Minimum” (Liebig’s law) says that once a bottleneck has been removed, there will be a new one. It may be office space, computer network bandwidth, shortage of tools, or another shortage of a resource that limits productivity and decreases the combined productivity of the team members.
If a small number of people perform a large number of work items, it is easier to utilize these people. A greater number of people with the same number of work items will have more idle time while one person has to wait for someone else to have work completed that delivers input for the work of others on the team.
Team members’ motivation will suffer when they feel they are moved continually from one project to another one. The constancy of team situations that makes groups of people become “bands of brothers and sisters” vanishes; frustration and aggravation hold sway instead. Some will look for a more satisfying work place, and attrition of employees will worsen the situation, which is not sustainable.
While the crisis of one project is exported to another one in this portfolio domino effect, the efficiency of the entire organization suffers heavily. The result is a typical “Nash Equilibrium” (see Chapter 2), where the interests of the individual projects and the overall portfolio collide.
The case story shows how project managers have to expect changes from many dimensions. Continually changing requirements and new ideas from various stakeholders as to what they consider necessary and what is not required, volatile availability of resources, changing business situations of the organizations involved, and many more factors can make major parts of a project’s predictions null and void after short periods of time. Project managers in these projects should be prepared. The changes may also come from inside the project. It may be impossible to perform some activities, and the project team has to find different solutions or workarounds. The team may have identified opportunities for simplification or improvement that they want to exploit for the project. The team may try to use benefit engineering (discussed in Chapter 5) to make budget or schedule overruns or other burdens acceptable for stakeholders by weighing them against additional benefits.
I mentioned John Fondahl, who was one of the original developers of network diagramming in the 1950s and 1960s. The focus of his Precedence Diagramming Method (PDM) was on manual application. The walls of “war rooms” in the following decades—when the method found worldwide acceptance—were often filled with diagrams, including WBSs and network diagrams. Fondahl described a problem that emerged early with these plans: a lot of time and effort to develop, manually draw, and calculate were invested in the plans, and whenever a change occurred, major sections of the plan had to be re-developed, re-calculated, and redrawn. The more energy and determination people put into making the plans originally, the more time and effort were needed when it became necessary to alter them. The effort and time needed for these changes grew with the length of the planning horizon and with the granularity and details covered in the plans, as both added to the size of the plan. One could ease the drawing work by using blackboards and chalk instead of room walls and India ink, which also made faster changes since the move replaced the razor blade used for scratching off the ink and a sponge to wipe the chalk drawings off. But this helped only partially. The fundamental problem remained that with growing predictiveness, the difficulty of keeping plans flexible grew. There are basically three solutions to the task:

Figure 4-6 The final situation with three crashed projects.
Use Computers. In the early times of network diagramming, this was difficult. Computer time was expensive and so was developing the plans. The plans were not files used by a program, they were the programs, and each project plan needed to be programmed by a programmer. Data were mostly stored on punch cards, and a discipline needed to be developed to ensure that a deck of punch cards could not be damaged by negligence or accident; such a deck could lead to a crash of the computer, which was running several jobs at a time. If a crash occurred, the data would have to be recovered in a tedious and costly process. Today, software is much less expensive, and the risks have moved from damaged punch cards to untrained users. As in any discipline, mastership includes tool mastership, and project managers should be given the opportunity to learn their tools from competent instructors.
Use “Rolling Wave” Approaches. Picture a ship cruising across an ocean. Ahead of the ship is its bow wave, and while the ship is moving through the water, so is the bow wave some distance ahead of it. Rolling wave project management accepts the event horizons, the limitations of prediction and planning, without ignoring or rejecting the fundamental necessity of making projections. The event horizons of predictability may relate to time: the future is reliably predictable and can be planned only to a certain point in time, beyond which projecting would be turned into pure speculating. It may refer to granularity: The level of manageable detail in plans and forecasts is limited. The more detail one includes in plans, the more the plans will need to be based on assumptions that may later be proven wrong. It may be organizational because the project shares scarce resources with other projects inside a portfolio, depends on deliverables from other projects inside a program, or is a satellite project of a principal project (as discussed in Chapter 3), and the other project managers reject or neglect to inform others as to what is happening with their projects. An event horizon may relate to people, who have their own private agendas, desires, angsts, and other driving forces, to locations that are inaccessible, to technological advances, changing economic environments, and more. In the following discussion, I will focus on the time aspect, but the issue is much greater than just that. Effective rolling wave project management accepts these limitations and bases the decision on the planning horizons on two questions (see Figure 4-7):
1st question: How much predictiveness does the project need?
2nd question: How much prediction does the project allow?

Figure 4-7 Rolling wave between Waterfall and Agile.
Combine These Solutions. Using modern project management software with rolling wave planning, it is possible to navigate a project between the two monsters of lack of predictability on one side and the inertness and debilitation that a project can have when a predictive approach has been taken too far, and when fear of having to change plans exceeds the desire to implement necessary or value-adding changes to the project. Applying rolling wave planning, the project manager reiterates the Plan-Do-Check-Act cycle along his or her own learning process and that of the team, adding increments of predictions when they are needed and possible. Software takes the burden from the project manager of having to do all the calculations and drawing work manually and also supports communication of revisions to the plan to the appropriate stakeholders.
There are, in essence, three forms of rolling wave project planning, as shown in Figure 4-8.
Rolling wave in strict, sequential phase-gate projects. In this approach, the project manager and the team take phase ends as planning horizons. This means that a current phase has been initiated and is planned until its end. Future phases may be roughly described but are not yet planned. It is quite common that at the end of a phase, a gate review looks at the previous phase to assess if all the work has been finished successfully by the right people, in the right order, at the right place, etc., and has been appropriately documented. This is the first part of the gate review, which focuses on formal phase exit criteria. If the reviewers are confident with the results of this part of the review, a second part will be conducted, which focuses on the question, “Can the risks be taken to move to the next phase?” Only when the answer to this question is “yes” will the project manager get authorization to enter the next phase, which may then be initiated and planned. The benefit of this approach is the protection that gate keepers can provide. In pharmaceutical development, the gate keepers come from government agencies and protect the health and lives of people who participate in clinical trials by ensuring that only drugs that have been found effective and safe enough in the previous phase arrive at the next trial stage. In large capital projects, gates are often in place to protect the investors from monetary losses by asking if it is financially promising enough to continue the project and risk more money, or whether it would be better to stop the project at this point and accept the loss of money already invested. The price paid for the increased safety from strict phase-gate projects is that it slows down projects. Another price is that the project manager can rarely plan a future phase without the approval from the gate reviewers.

Figure 4-8 Rolling wave planning in a project with (1) strict, sequential phases with gates, (2) overlapping phases, and (3) no phases.
In overlapping phases, the risks are increased compared to the sequential phases, but the projects are completed more quickly if executed correctly. Rolling wave planning may still be linked with phase ends such in a way that currently performed phases are planned to their end, but future phases that have not yet been begun will be initiated and started after their start.
Many project managers feel restrained by phase models and run projects without phases. They will plan the horizon of rolling wave planning not according to a phase definition, but instead will ask which prediction horizon is possible and beneficial for the project.
These three types of rolling wave planning are not strictly separate. One may, for instance, use the third approach in a strict phase-gate model and plan for the next weeks in a phase that may last for several months.
Some advice on the use of software: Several of my customers have trained and dedicated experts for the software who act as assistants to the project managers. One such expert may be able to support three to seven project managers, depending on the complexity of the projects. Project managers in these environments do not waste their time trying to make the software do what they want, often a difficult task, and focus instead on their core tasks of coordinating, directing, and leading. The experts have a professional understanding of the software in use with its features, as well as with its limitations and weaknesses and a lot of experience in its application. Over time, they may learn several software products and are then able to select the software that best meets the needs of a specific project or has been mandated by a customer to better communicate with the contractor—and of course keep the outsourced work better under control. They also help PMOs develop unified approaches to project management across the organizational project portfolio that support project success, not impact it, as they are in continuous interaction with both the PMO and the project managers. The investment in these people pays back quickly to the employer by better cost-efficiency and reliability of the projects they support.
Prediction horizons may not be the same for all work items in a project. I mentioned earlier Wysocki’s ACPF life cycle recommendation that moves from an Agile ideation phase to a much more predictive execution phase during the course of a project, which sounds like a reasonable approach for many projects. Another application of situational rolling wave could be to have different prediction horizons for different work streams. One stream, for example, may require highly skilled experts in a technical field that are hard to find and can be booked only for the long term in advance. Another work stream utilizes a workforce that can be obtained quickly and trained for the job. It may also be that there are several planning horizons defined for the entire project or its work streams. This approach implies a horizon for fine and detailed planning for the near future, and a high-level one that looks further into the future. On the move forward, the high-level ones will be refined, and sometimes may need to be changed, a process that is called “progressive elaboration” and reflects our learning curve along the project as shown in Figure 4-9.
A work stream is a collection of activities that together generate a set of connected deliverables. To give an example in an engineering project, one work stream may be to develop a piece of equipment, a second focuses on documentation and approvals, and a third may relate to developing environmental aspects such as making spares available in the warehouse.

Figure 4-9 A project with three work streams and two planning horizons per stream.
How do event horizons of the project and planning horizons relate to one another? The first should be assessed by asking, “To what point in time can we effectively develop somewhat realistic and reliable plans?” One may ask the question repeatedly for different plans—for example, once for a fine plan and a second time for a high-level plan, and may ask the question also separately for the different work streams.
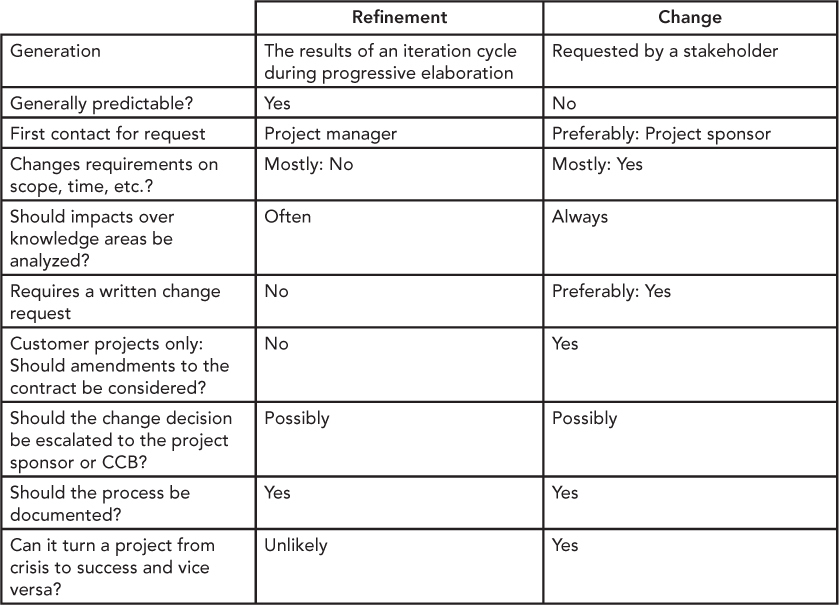
Two core elements of effective rolling wave planning are active refinement management and change request management. Table 4-1 shows the difference between the two forms of progressive elaboration.
A CCB is a Change Control Board, also known as Steering Committee, which is a meeting of key stakeholders to make decisions (not only) on changes that the team, the project manager, or the project sponsor cannot make alone. In a customer project, it may be advisable to have two CCBs: an internal one in which changes are discussed that are not the customer’s business, and a joint CCB with the customer to discuss all change requests and other issues that need to be made together.
Change requests are two-faced, as they can rescue a project in a time of difficulty or even in a crisis, but poorly managed, they can also drive a project into crisis. For change request management or change control, one should have a process that has been formally agreed upon by the key stakeholders and that helps protect the project from harmful changes. Change requests can have unintended side effects and secondary risks that should be assessed by subject matter experts before the decision is made to implement them or not. The last chapter has a recommendation on a protective change request process that can be implemented to shield the project from damages.
Table 4-1 The Distinction Between Refinement and Change
4.6 Connective Leadership and Achieving Styles
4.6.1 The Lipman-Blumen Achieving Styles Model*
Jean Lipman-Blumen† and Harold J. Leavitt published their Achieving Styles Model initially in 1983‡. Later, Lipman-Blumen linked this earlier behavioral work to her concept of “Connective Leadership” in her Pulitzer-Prize-nominated book, The Connective Edge: Leading in an Interdependent World§, as part of a larger Connective LeadershipTM Model. She described how the global environment in which leaders are acting has changed from the Physical Era, when leaders had to help followers satisfy basic needs such as hunger and protection, over a Geopolitical Era, when leadership consisted of emphasizing the differences from others, to the current Connective Era, which is driven by global alliances and networks. The Connective Era poses challenges for leaders that are different from those in past eras. Connective leaders ably navigate their way through a continuous tension field in which diverse individuals, groups, and organizations must continuously work and live interpedently. The Achieving Styles Model is supported by a vast amount of empirical data from global leaders, and it is based on a simple question: What shifting combination of behaviors do leaders need to use to achieve their goals? The next steps involve measuring these behaviors or “achieving styles”, building profiles from the results of these measurements, and connecting these profiles with leadership situations and their specific needs.
It is important to understand that the model is not based on personality—in contrast to many other models that are similar at first glance—but on behavior. The question under discussion is not who people are, but what they do, and, especially, what they like and dislike doing. Leaders like certain styles because they find themselves applying these styles successfully, and they dislike others because they believe they would probably fail if they used them.
Behaviors are open to change, even to self-invention, while personality is more static. Behaviors can be learned and unlearned in a relatively short time, while personality changes only over long cycles and may not change. Behaviors are of course influenced by personality, but there are many other factors that influence them, such as experiences, feedback from other people, cultural norms, and even laws. Drugs and mental disorders may influence behaviors, as one may remember in Robert Louis Stevenson’s novel Strange Case of Dr. Jekyll and Mr. Hyde. Sometimes, leaders change their styles unintentionally in response to particular situations. I remember a leader, who had a strong entrusting style, scoring around six measured on a scale from one to seven, but got heavily disappointed by an important business partner, and the person’s score on the entrusted dimension fell sharply. After four weeks, the score was back to the person’s normal value.
Changing an individual’s personality cannot be the business of a project management trainer as I am. Helping project managers to acquire and develop behaviors that would be beneficial for them and their stakeholders, and supporting them in applying these behaviors with confidence and joy in the right situations, definitively is.
Lipman-Blumen and Leavitt identified nine Achieving Styles, which she classified in three groups, as shown in Figure 4-10.
Direct styles are applied by leaders whose behavior is mostly characterized by individualism and expressed through behaviors that emphasize confronting challenges on one’s own, mastering one’s own tasks, competing, and taking control and organizing.
Instrumental achievers accomplish their tasks by using themselves and others as instruments. They do this in three general ways: One, they use their own personal qualities and background to attract others to help them in their efforts (personal). Two, they select individuals with appropriate background, knowledge, experience, skill, or contacts to help in task achievement (social). Three, they rely upon any of the individuals in their known environment, with or without specific relevant expertise or contacts, to carry out the work (entrusting).

Figure 4-10 The nine Achieving Styles clustered in three groups. (Diagram provided by and used with permission of Jean Lipman-Blumen, ©1996.)
Relational styles are implemented through trustful rapport and are based on teamwork, contributing behind the scenes, and mentoring or simply deriving a sense of achievement through others’ accomplishments. When facilitating or mentoring, leaders often stand back behind others whose success they support.
No leader uses only one style, but one often finds a style that a person prefers to use and champions proudly. Leaders also may behave differently in distinctive settings; for example, a highly competitive manager or politician may be the most helpful father or mother toward his or her children.
These are the nine Achieving Styles, as discussed in the following sections.
Direct Styles
Intrinsic style. Intrinsic Direct leaders prefer to master tasks by themselves. When they delegate a job to another person, they often have the impression that they could do the work much better than their subordinate. They do not compare themselves to others and are their own harshest critics. In achieving situations, they do not care much about what others think of their accomplishments, but, instead, measure their performance by their own metrics.
Competitive style. Competitive Direct leaders try to outdo others. In their minds, they hold scoreboards and rankings, and it is important for them to be on the winning side and rank at the top. They prefer achieving situations in which players compare their forces directly and have opportunities to knock out opponents. Competitive leaders measure their performance by their ability to excel beyond and even disrupt actual or perceived rivals in their attempts to achieve, and by how much they could benefit from their competitors’ weaknesses.
Power style. Power Direct leaders like to take charge of everyone and everything. They like to bring order out of chaos. They prefer being in authoritative positions, where the link between their investments and the achieved returns are easily seen. They want people under their domain simply to follow commands and function as expected, and they describe what they perceive as underperformance under their command in clear words. They prefer achieving situations with a clear team hierarchy and in which people involved have to follow well-established procedures and chains of command. Power Direct leaders measure their own performance and success along return-on-investment calculations for tangible and intangible achievements.
Instrumental Styles
Personal style. Personal Instrumental leaders are perceived as shiny and magnetic by their followers. They build an aura of charisma around them, often using their families, ancestors, educational and occupational achievements, or distinctive events in their lives that make them special. They use humor and convincing charm to make others support their case, and when they make jokes, they are more likely to engage in self-deprecating humor than to have fun at someone else’s expense. They often prefer achieving situations in which an individual can support a team, but can also take an exposed position from time to time. Personal Instrumental leaders consistently measure their degree of achievement by the intensity of admiration and confirmation that they get from others and the degree to which others would like to associate and work with them.
Social style. Social Instrumental leaders delegate the right tasks to the right people. They know a lot about the skills, experience, networks, and interests that others have and consider them when they assign people to open jobs. They show interest in people who, in turn, strive to perform as expected. They also connect with each other to strengthen the networks that help them achieve. If they excel, it benefits others in their networks as well. They measure their degree of achievement by the functioning of their networks.
Entrusting style. Entrusting Instrumental leaders prefer to delegate as well, but they often send people on stretch assignments that pose requirements beyond these peoples’ qualifications and experience. Then, they expect people to grow and learn with the tasks. They often allow the individual assigned to the job to make an error, but not to repeat the error. Their entrusting style puts people under pressure, who then must give something back so as to not disappoint the leader: results. Entrusting Instrumental leaders often perceive disappointments from trusted people as especially painful. Entrusting Instrumental leaders measure their degree of achievement by the delta of capabilities that people under their domain have achieved to meet the expectations set for them.
Relational Styles
Collaborative style. Collaborative Relational leaders prefer doing the job together with people with whom they have developed trust and rapport, possibly through long-term work relationships or teamwork. They like working in groups, to whose members they will offer loyalty and dedication, and they will place the group’s goals above their own. When a new task must be done, they wonder who would be the best individual(s) with whom to join forces. In turn, they expect to receive their share of the reward. Collaborative Relational leaders prefer achievement situations, in which the team is more important than the individual, and where the success of the team depends equally on the contribution of all team members. Collaborative Relational leaders measure the degree of achievement by the extent to which goals have been met jointly by the group to which they have contributed. They also accept their share of responsibility and blame for failure.
Contributory style. Contributory Relational style leaders prefer to come second and act in the background. They take pleasure in the successes of others as long as the successes can be traced back to their active support. When others need help, they take joy in providing this help. In sports, they prefer to assist others and help them to score rather than scoring themselves. It also may be that they are more active in developing a new sport by setting the rules and providing the infrastructure than actually playing the sport. They measure their degree of achievement by their active involvement in the successes of others.
Vicarious style. Vicarious Relational leaders also take joy in the successes of others, but of people in whose success they had no part. As mental rather than physical supporters, they give others motivation, inspiration, and the feeling that someone cares for them and acclaims their achievements. They do not expect to be given credit when others achieve; the sense of pride that they take from the achieving situation is sufficient. In achieving situations, they may prefer to be observers, rather than players, and when the teams that they support achieve, they feel as if they have achieved. They measure their degree of achievement by the achievements of those with whom they identify and support.
4.6.2 Application of the Lipman-Blumen Achieving Styles
Lipman-Blumen says that leaders generally perform best if they are confident and able to master all nine Achieving Styles. In that way, they have the ability to adjust to the needs of a variety of challenges. This was confirmed by Verna Wangler in her dissertation*, which showed how leaders with complex behavior are more likely to be effective, as they can master a wider range of situations by adapting behaviors to what is situationally appropriate. This is probably true for any manager. It is especially interesting in project management, however, where during the lifecycle of the project, its internal dynamics meet the external forces of the performing organization and the multi-faceted environment in ever new combinations. As discussed in Chapter 1, project management is an open-skill, not a closed-skill, discipline, and during the interminable confrontation with the often unexpected but ever-changing realities in and around the project, effective project managers are separated from their less effective colleagues.
The Connective Leadership Institute, in Pasadena, California, uses a suite of eight leadership assessments to generate individual and organizational connective leadership profiles. Surveys are constructed on a 7-point Likert scale, ranging from “never” to “always” uses the style. The profiles are shown in the form of polar graphs that provide insight into the behavioral strengths and weaknesses of a person, as Figure 4-11 illustrates. It shows the results of an Achieving Styles Inventory (ASI), an instrument that is used to measure a person’s individual Connective Leadership profile.
These are the eight Connective Leadership/Achieving Style Assessments†:
1) ASI. The Achieving Styles Inventory measures the individual’s Connective Leadership profile and gives the person a better understanding of its current behavioral setting.
2) A-ASI. The Aspirational Achieving Styles Inventory measures the individual’s Connective Leadership profile that the person aspires to have in the future.
3) OASI. The Organizational Achieving Styles Inventory measures the leadership behaviors that an organization values.
4) A-OASI. The Aspirational Organizational Achieving Styles Inventory measures the leadership behaviors that individuals would like to see valued by the organization in the future.

Figure 4-11 An ASI profile of a person who is mostly confident using the Intrinsic, Social, Contributory, and Collaborative styles, but less confident using Entrusting, Competitive, and Personal styles.
(Source: Connective Leadership Institute, published with its permission.)
5, 6) ASSET. The Achieving Styles Situational Evaluation Technique (ASSET) measures the requirements (“demand scores”) of a role or project in terms of the Achieving Styles required for that specific role or project. There are two versions of ASSET, one for a role called ASSET (r) and one for a project called ASSET (p).
7) ASI360. A 360-degree assessment of the Leadership Styles of a focal person*; the instrument measures the Connective Leadership profile by comparing an individual’s self-assessment (ASI360F) of the focal person’s behavior made by relevant people from that individual’s environment (ASI360E).
8) A-ASI360. The aspirational 360-degree assessment—what future Connective Leadership profile does the focal person aspire to the future (A-A360F), and what profile would relevant people from the individual’s environment aspire to that person (A-ASI360E)?
The assessments may be displayed as overlays of two graphs (see Figure 4-12) to show deltas between results. These overlays offer new and valuable insights into the behavioral matters of actual, intended and needed leadership behaviors. They help identify needs for development on a personal as well as on an organizational level and support the more situational allocation of people to tasks.
4.6.3 Real-Life Examples and Application in Project Management
Figure 4-12 shows two examples of how Connective Leadership profiles can help understand leadership behavior and help leaders master leadership situations.

Figure 4-12 The overlay of two ASIs on the top shows how two individuals perform together as a team. On the bottom is an overlay which shows the ASI of a person and an OASI of the employer.
(Source: Connective Leadership Institute, published with its permission.)
The top example shows two leaders from project management, who have worked together as a successful team over many years. The overlay of the two individuals shows some interesting peculiarities:
In seven out of nine Achieving Styles, the two leaders are very similar. These are leadership behaviors in which they experience harmony and empathy for each other. They act similarly in leadership situations that require these behaviors.
Too much harmony would make people inert. Contributory and Power styles prevent the two from becoming sluggish. The two have some tension here that keep them alert and force them to explain the reasoning for behaviors to each other.
One can also see that the two are probably more effective as a team if Person #2 stands in front, where the person can apply the strong Power style, and when Person #1 steps back behind Person #1 and applies the strong Contributory style.
The bottom example was generated from an individual and an organizational assessment done by a person whom I did not know at the time. A friend of mine called me and asked if I would be prepared to do the assessment with a person from his environment anonymously, and we did it. This overlay is the opposite of the previous one:
In seven out of nine Achieving Styles, the person feels that the efforts are not rewarded adequately by the organization.
Only in two Achieving Styles is there harmony between the effort invested by the person and the tangible and intangible rewards by the organization.
My impression: Effort-Reward Imbalance (ERI) is a classical cause for distress and team attrition. My assessment: The person was about to leave the organization. When my friend called me again, I was careful however, as I did not know who it was. It could be his secretary, and being too open, I could cause more damage than benefit. I told him that the profiles show “a situation with severe conflicts”. He responded: “Yes, it is my wife, and she has a lot of problems in her job. She is going to quit soon”. The focus person was a key woman in the IT organization of her employer, and it would probably have been interesting information for the employer to know how unhappy she was in her job and why.
The “well-rounded” project manager related to the Achieving Styles, of course, a person who can adjust to any leadership situation, would be a desirable leader for any project, but such people are not common; moreover, Achieving Styles can change in response to certain situations, as described before. How should projects then be staffed to be prepared for a variety of leadership challenges? Figure 4-12 gives an answer to this question as well: Combine people with diverse strengths and weaknesses. While the Connective Leadership profiles are great tools to identify the best matches, a lot can be done with the basic understanding and the application of common sense. Finally, the Connective Leadership/Achieving Styles Model is based on rigorous scientific validations and behavioral studies conducted over a 10-year period. It describes behaviors that we can observe around us, and with a well-formulated model based on empirical research, it is much easier to understand and accurately predict the behavior of our stakeholders.
4.7 Favorable and Detrimental Practices
I mentioned earlier my research project, which I did with a group of 17 seasoned experts in project management. The first part was to develop a typology of projects. In essence, the Lifecycle Approaches and Achieving Styles described in this chapter are also typologies of behavioral dimensions. The second part of the research therefore dealt with the question, “Are there are favorable and detrimental combinations of project types with these behaviors?”
The experts used a system with points ranging from –3 to +3 that led to evaluations as was shown in Figure 4-13; the following diagrams show the average results of their assessments.

Figure 4-13 The classification of the results follows a ±3-point system between detrimental and favorable.
4.7.1 How Can the Following Information Be Used Best?
I first recommend using these data as guidelines. They are based on centuries of cumulative experience by seasoned project management experts, but there are more factors in a project that influence the dynamics of success and failure than the nine dimensions of project types that the experts had identified. I further recommend considering this information rather as warnings than as recommendations for action. Detrimental behavior is quite certain to lead to failure. In comparison, favorable behavior can much less be a guarantee for success. The don’ts are probably more important in the list than the dos. Avoiding major failures opens opportunities for success, but it is not yet true success. However, failures close doors for success.
If you have a project that you wish to assess, it is recommended that you go through the following pages and ask yourself, for each of the types listed, if your project belongs to it. Is it a Mark 1 or Mark n project, a Greenfield or Brownfield project, and so on. Then make a note for every yellow spot and especially for every red spot that you find. At the end, you have a list of neutral practices, whose application are likely to be a waste of time for the project, and detrimental practices, that can drive the project into trouble.
The graphical representations below are a quick and practical help for practitioners in project management. If you are interested in the details of the research, including the detailed process and the numbers behind the graphics, please contact me. I will be happy to give you access to the much more detailed original research paper.
A conclusion of the project types and how the practices perform with them is that the combination of Rolling Wave approach and a focus on the instrumental and relational achieving styles seems never to be wrong. This does not mean that Powerful and Competitive Achieving Styles are never necessary—we surely have to use them with situational care.
An interesting point about the Rolling Wave approach is that its backers can easily shift their behaviors toward a more Agile and adaptive or a more predictive approach, depending on the situation. It is very hard for Agile people to manage a project that needs and allows for high predictions, and it is also difficult for the champions of Waterfall approaches to change to more Agile methods. Both parties often complain about the gap between them, unaware that Rolling Wave approaches have already built bridges over the gap—decades ago, by the way. Rolling Wave projects can be easily moved to a more Agile side, when the predictability and the needs for predictions are low and move the planning horizon further into the future, if this is needed and possible, and turn the project into a Waterfall project. Among the life cycle approaches in the research, Rolling Wave was not detrimental for any type of project. However, it is not a Best Practice but is a great starting point, which is suitable for probably more than 50% of the projects (see Chapter 3), and it is also a basis from which one can easily turn to more Agile or predictive approaches and methods, depending on the situation. I will go into more detail about the practical application of this concept in Chapter 5.
Mark 1 Projects and Mark n Projects

Figure 4-14 For the novelty in Mark 1 projects, predictive Waterfall approaches and competitive Leadership Style are detrimental. Power style is neutral. All other approaches and Achieving Styles are favorable.

Figure 4-15 Mark n projects can be derived from former projects. Agile approaches are detrimental. All other approaches and Achieving Styles are favorable.
Greenfield Projects and Brownfield Projects

Figure 4-16 For Greenfield projects, all approaches and Achieving Styles are favorable.
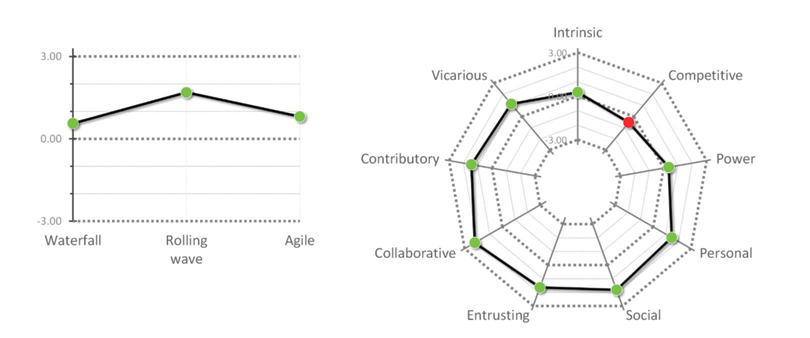
Figure 4-17 Brownfield projects have to consider many stakeholders. Competitive Achieving Style is detrimental. All other approaches and Achieving Styles are favorable.
Siloed Projects and Solid Projects

Figure 4-18 Siloed projects are fragmented. Competitive Achieving Style is detrimental, Agile methods and Intrinsic Achieving Style are neutral. All other approaches and Achieving Styles are favorable.

Figure 4-19 Solid projects have low fragmentation. They are neutral to the Competitive Achieving Style. All other approaches and Achieving Styles are favorable.
Blurred Projects and Focused Projects

Figure 4-20 Blurred projects are not clearly defined and separated from other tasks of the organization. Waterfall is detrimental for them. They are neutral to the Competitive Achieving Style. All other approaches and Achieving Styles are favorable.

Figure 4-21 Focused projects have clear boundaries and definitions. Agile approaches are detrimental. All other approaches and Achieving Styles are favorable.
High-Impact Projects and Low-Impact Projects

Figure 4-22 For High-impact projects, all approaches and Achieving Styles are favorable.

Figure 4-23 For Low-impact projects, Competitive and Personal Achieving Styles are neutral. All other approaches and Achieving Styles are favorable.
Customer Projects and Internal Projects

Figure 4-24 For Customer projects, all approaches and Achieving Styles are favorable.

Figure 4-25 For Internal projects, Competitive Achieving Style is neutral. All other approaches and Achieving Styles are favorable.
Stand-Alone Projects and Satellite Projects

Figure 4-26 For stand-alone projects, Competitive Achieving Style is neutral. All other approaches and Achieving Styles are favorable.

Figure 4-27 Satellite projects are performed in the wake of principal projects. Competitive and Power Achieving Styles are detrimental; Waterfall methods are neutral. All other approaches and Achieving Styles are favorable.
Predictable Projects and Exploratory Projects

Figure 4-28 Predictable projects allow long-term predictions and plans. Agile approaches are detrimental. All other approaches and Achieving Styles are favorable.

Figure 4-29 The way is made by walking in Exploratory projects. The predictive Waterfall approach is detrimental. All other approaches and Achieving Styles are favorable.
Composed Projects and Decomposed Projects

Figure 4-30 Composed projects are developed bottom-up by their contributors. Waterfall is detrimental for them. They are neutral to the Competitive and Power Achieving Styles. All other approaches and Achieving Styles are favorable.

Figure 4-31 Decomposed projects are developed top-down and work is then assigned to contributors. Agile is neutral for them. They are also neutral to the Competitive Achieving Style. All other approaches and Achieving Styles are favorable.
* (Wysocki, 2014a, p. 8).
* The word was coined by reversing the word “extreme”.
† Robert Wysocki describes a situational project life cycle in another book Effective Complex Project Management. It begins with an Agile setup phase and ends in a more predictive execution phase. This lifecycle, called Adaptive Complex Project Framework (ACPF), will probably be appropriate for many projects (Wysocki, 2014b).
* (Beck, et al., 2001).
* The MIL Handbook 881A that was required for use in the United States Military stated that no elements should be included in a WBS that are not products. The document was superseded in 2011 by MIL-Std. 881C, which no longer has such a requirement (DoD, 2011).
* The members’ magazine of PMI®, PM Network, published an article on the memories of that time (Snyder, 1987). Thanks to Jim Snyder, who gave me some additional information in a personal setting.
* (Fazar, 1959).
† (Fondahl, 1987).
‡ (Kelley and Walker, 1989).
* (Sterman, 1992).
† (Goldratt, 1997).
‡ I observe a shortage of good trainers in project management software, who understand both project management and the software and teach the second to support the first, not try to distort project management to make it suitable for the software.
* (Kelley and Walker, 1989).
* Depending on the jurisdiction and the contract.
* “Achieving Styles” and “Connective Leadership” are trademarks of the Connective Leadership Institute, Pasadena, CA, USA.
† Dr. Jean Lipman-Blumen is the Thornton F. Bradshaw Professor of Public Policy and Professor of Organizational Behavior at the Drucker School, Claremont Graduate University in Claremont, CA, USA. She served as assistant director of the National Institute of Education and as special advisor to the Domestic Policy Staff in the White House under President Jimmy Carter. She founded the Connective Leadership Institute in Pasadena, CA, USA, with Professor Harold J. Leavitt, Kilpatrick Professor of Organizational Behavior, Stanford University, Graduate School of Business.
‡ (Lipman-Blumen, Handley-Isaksen, and Leavitt, 1983).
§ (Lipman-Blumen, 1996).
* (Wangler, 2009).
† (Connective Leadership Institute, 2015).
* A focal person is in the focus of the assessment, and the person’s self assessment is compared with assessments by the environment.