
Chapter 5
Some Basic Tools for SitPM
There is a wide body of literature on methodical and software tools in project management, and it is not the intention of this book to repeat what has already been written in more than sufficient detail by others. The focus of this chapter is on tools that are especially valuable for situational project analysis and management, possibly with some expansions or alterations to already existing descriptions.
5.1 Introductory Questions
Again, some of the following introductory questions relate to the tools that will be discussed in this chapter and may be difficult to answer before you have completed it. While some tools may be known from other sources, there are some specifics in the descriptions here that are different and make the tools appropriate for situational approach to project management.
You may try the questions right now, or read the chapter and then answer them.
- 1. Which of the following is not a purpose for having an assumptions register?
- An assumptions register can help easily identify project risks.
- An assumptions register can speed up the team-building processes.
- An assumptions register can save the project team from factoids.
- An assumptions register can provide a common understanding of why decisions are made.
- 2. Which approach may help a project manager and the team in a customer project deal with project difficulties from unrealistic cost estimates, time commitments, unrealistic technical solutions, and other contractual obligations that the project is unable to meet?
- De-scoping
- Crashing
- Cost engineering
- Benefit engineering
- 3. A high span width in Stakeholder Force-Field Analysis (StaFFA) indicates for the project that:
- the project manager and the team will probably lose the support of senior management during its lifecycle
- the project will be easily finished as planned and will meet all cost, time, and result objectives that have been agreed upon by key stakeholders.
- during the project, the project manager and the team will probably stand in the middle of a massive conflict.
- the deadlines of the project are difficult to meet due to a high degree of resistance by key stakeholders.
- 4. Which of the following are true for change requests?
- Change requests have the power to get a project out of trouble, but also to drive it deeply into crisis.
- Change requests are a sign of poor planning and should generally be avoided by the project manager and the team.
- All change requests should be welcomed by the team, as they provide the opportunity to please the client.
- If a change order comes from the sponsor, the impacts should not be assessed and the order immediately executed.
- 5. Which of the following are true for estimates under pressure?
- Having to develop estimates under pressure separates the men or women from the boys or girls.
- Estimates under pressure are often political, and people avoid doing them as they are often blamed if the prove to be incorrect.
- Estimates made under pressure are generally overly optimistic.
- Estimates made under pressure are generally overly pessimistic.
- 6. You are planning a kick-off meeting. What should you take care of now?
- Plan a brief and informal meeting, which may be repeated easily if necessary.
- Take the opportunity to review and update project plan documents before the meeting.
- Invite attendees short-term to make sure that you are the best prepared person.
- Keep the agenda open so that all objections may be raised and discussed during the meeting.
5.2 Stakeholder Force-Field Analysis (StaFFA)
Force-Field Analysis was developed by the German-American psychologist Kurt Lewin and first published in 1943*. It is simple in its application, but powerful in its ability to predict if a change will be difficult or easy to manage. In the application shown here, it also gives the project manager and the team an indication if they have to expect a lot of conflicts or will perform the project in a more harmonious environment, and it provides some indication on how to adjust approaches.
The model is built on a simple metaphor: Some people want to pull an item in one direction, others want to keep it in its place. Which group will be stronger? Both groups will influence the ability of the project to bring about the deliverables and changes for which the project is undertaken, and the balance between them can be the most important factor in the dynamics of success and failure.
There is a slight difference in the approach that I recommend in what I call StaFFA to what Kurt Lewin recommended. He includes environmental factors in his analysis that accelerated or slowed down change, something one may also do for a project. My focus, however, is on people. I am also not only interested in the “Force Field” that he described, but also in the tensions that the analysis visualizes in the span between strong drivers and restrainers.
The process steps are as follows:
Build a work group, commonly between three and seven persons; five is a good average size. Form a multidisciplinary and collocated focus group for the analysis.
Close the door of the meeting room. Then ask the group to list stakeholders, such as people, groups, or organizations, who may drive the project or restrain it. Write the names on the side of a page (flip-chart or whiteboard are fine, or use a PC with projector).
Assign force numbers to the stakeholders between –10 (strongly restraining) and 10 (strongly driving). Then draw a diagram from this information as shown in Figure 5-1 to represent the numbers graphically.
Driving forces in StaFFA are those stakeholders who generate process in the project. This is mostly done through their active contribution and their preparedness to act as a part of a greater system. Restraining forces slow down the project and may bring it to a halt if they are stronger than the driving forces. Restraining forces may be stakeholders who resist the project actively or passively by rejecting the project and not providing the degree of support that it needs. Team members or contractors who basically support the project but are unreliable or incompetent in performing their job or whose availability is uncertain from factors beyond their control and that of the project manager may also restrain the project. People who bring conflicts into the team and undermine the morale of others are another example.

Figure 5-1 A StaFFA with nine stakeholders.
Two values are interesting for the project:
Equilibrium. The arithmetic average of the numbers assigned to the stakeholders is a metric for the likeliness of the project to succeed. In the example, the number 1.11 is positive, so the driving forces are stronger than the restraining forces. The team should be able to perform the project successfully. The number is not very high, so the team needs to take its time to surmount the restraining forces, which means it will probably not become a superfast project.
Span width. Fifteen steps, (from –7 to 8) on a scale with 20 steps is quite a lot. The project will probably have a number of conflicts, and the project manager and the team will be in the center of the conflict.
Conclusions that one can draw from the results of stakeholder force-field analysis:
Negative equilibrium. The restraining forces are stronger than the driving one. The project is likely to fail.
Low positive equilibrium. The driving forces are stronger than the restraining forces, but not much. The project schedule should allow time needed to manage resistance.
High positive equilibrium. The project will probably be a quick one.
High span width. The project is bound for conflicts. Clear agreements at the onset of the project to have clear authorizations (Project Charter) and definition of project management processes and responsibilities (Management Plans) will be important later to master these conflicts. Constant awareness of conflict potentials among stakeholders and attention to disagreements and tensions among them is also advisable.
Low span width. Just do the project and rely on the consensus and common mission of shareholders.
One should repeat the analysis from time to time to reflect the changes in the force field and assess the results of measures taken by the team to reduce resistance and other forms of restraining forces.
5.3 Benefit Engineering
Many projects are successful. Others are initiated and sent on a course bound for inevitable failure right from the start. Some are Zombie projects that had no chance for success at any time, and it is often impossible to salvage them later. The problems may be technological, organizational, or interpersonal in nature or simply that sales people have sold something such as a flying carpet to a customer. Others are not fundamentally wrong, but the data do not fit. For example, a customer project bid or proposal may have been won based on extreme lowballing and on schedule promises that were unrealistic right from the start. A frequent cause for problems in managing customer projects is information that has not been communicated to the project manager in its entirety or has already been so vast at the onset of the project that the project manager and the team were unable to grasp it all in the short time available. Often the pressure to quickly become productive is too high, colliding with the time needed by the project manager to become familiar with the project, its environment, and its stakeholders. Earlier, projects were often conducted by business units such as departments or branches “over the fence” (see Figure 5-2A), and according to literature, this time should be over, but in the reality of customer projects, two fences often have survived the change inside the lifecycle of the business with the customer, at the beginning and at the end of the project, as is shown in Figure 5-2B.

Figure 5-2 An example for an over-the fence project from engineering, as would have been commonly performed before project management was introduced and today. There are often still two fences left.
The fence between the sales department and the project team often has the consequence that projects during business development or during project selection are set up with expectations, promises, and obligations that cannot be met. The price in fixed-price contracts may be found later to not cover costs, deadlines may be impossible to meet, technological demands may be overly challenging, and the promise to disrupt operations by no more than four weeks may be found to be too optimistic. Optimism is part of the profession of a good sales person. The ability to credibly communicate the “Easy” proposition to both the customer (“We are so easy as a vendor and will save you from all problems. Select us!”) and the performing organization (“This prospect is so easy, things will not go wrong. Remove the contingency premium from the offered price!”) is an important skill, which helps keep the company in business. However, it can later become a problem when the reality is not easy at all. It will then be the responsibility of the project team to find a solution.
Similar problems occur in internal projects. Here, it is rarely due to sales people but to the people involved in developing requests and business cases for projects and those who decide upon them. It is rather rare that project managers will get the time, funding, resources, and other resources they need, and they face the additional problem that most projects here are in a weak matrix, which will make it difficult to obtain resources as needed and give the operational managers a strong stance in their defense against disrupting daily operations, which may be disturbing but necessary. Your project is on the way to foreseeable crisis, and you will be the project manager in charge when this happens. Running away is not always a bad decision, but at some point, it is simply too late, because all the blame for the bad project will then be on you, and your reputation, self-respect, and most important, your professional resume will suffer from this negative assignment. You will notice that in search for a new job, recruiters will be more reluctant to invite you to an interview, and the interviews will be much more difficult for you. Sometimes, it is surprising how badly informed recruiters can be, but then we meet others who are perfectly informed, and these are commonly the ones who have the hands on the most attractive project assignments.
For both customer and internal projects, a common approach in situations in which projects overrun budgets and deadlines is cost engineering. The project team tries to reduce the costs, effort, and time needed by reducing the scope or shifting some parts of the scope back into the responsibility of the customer or the internal requester. Work may be done with reduced meticulousness, assuming that the first 80% of the results will take only 20% of the time, effort, and costs, and who notices the other 20%? Expensive components may be replaced by less expensive ones, and the organizational overhead is reduced to focus more on the productive resources. Figure 5-3 shows the focus of the cost-engineering approach.
There are limitations for cost engineering: In a customer project, the contractor, probably your employer, does not want to step into a breach of contract situation. Most organizations do not want to run into a breach of contract situation, because in most jurisdictions, the negative consequences are unforeseeable. While meeting customer requirements is an essential element of any project that is performed under contract, contractual requirements are the ones that the contractor first needs to consider. If they are met, the customer will probably not be delighted, because they are just expected; but if they are not met, the customer will be angry, and you know that he or she will be right. Meeting a contractual requirement does not make you look shiny, but not meeting it can send you into deep difficulty. In internal projects, the project is not performed against a contract but is an internal agreement. If the organization takes internal agreements seriously, the same applies, except that conflicts will not be remedied in a court but in the board room. In some companies, this option may be even more uncomfortable.

Figure 5-3 Focus of cost engineering vs. benefit engineering.
Another limitation for a project can be meeting legal requirements, such as deadlines and functional requirements for the implementation of software for tax purposes, or a waste water treatment system that is a mandatory prerequisite for production to be continued, or something similar. Making such a project less expensive by reducing scope or slowing down some activities could at some point cross the borderline of legality, and most organizations wish to act in compliance with the laws of the countries in which they are active. If you are performing a customer project, the law will probably not apply to your own organization but to its customer, and next to making profit for your employer company, taking care of the customer and giving them strong evidence that they selected the right vendor when they awarded the contract to your company is probably also part of your assignment as a project manager. In addition, customer projects are performed in a much more public environment, and whereas top managers in a failed internal project may prefer keeping it secret, a dissatisfied customer may well talk to the press or other media about the poor performance of your organization and destroy future opportunities for your organization to win bids for the rare project contracts that are truly attractive from a commercial perspective.
Figure 5-3 also shows the focus of benefit engineering: increasing the value for the internal requester or external customer from the use of the deliverables of the project, from its products, services, or other results. Often, but not always, it is a way to get a project out of a crisis, which is often overlooked. The customer may be prepared to talk again about price, deadlines, functionality, disruption of operations, and other difficult topics, if the contractor has something special to offer. The same is true for internal projects in which the project manager needs to talk with top managers about the budget, dates, and other key data of the project.
The most important prerequisite: You must know the key stakeholders who will make the decision, or at least influence it, and understand their wishes, visions, concerns, and what keeps them awake at night. You must also know the constraints that can impact their ability to comply with your ideas. You are risking a rejection, but compared to risking a crisis in your project, this is the smaller risk.
For many project managers and their teams, engineering benefits is a rather easy task. In their projects, they touch things that have not been touched for a long time. They see inefficiencies, inconsistencies, safety hazards, and lost opportunities on the customer or requester side, which often no one else sees—at least no one who is interested in fixing the problems. You should never assume that a company, a government agency, an association, or any other business organization is perfectly organized and managed. Most are loose collections of processes, some of which are working very well, while others are deeply flawed. Legacies may be a cause for such inefficiencies, old systems that work well enough to not put the organization under pressure to replace them with new ones. It may well be that no one has the audacity to touch them, because no one can say for sure what consequences such action will have. They have been around for a long time, and whereas people in the organization know how to use them, they do not know for certain what these systems actually do. Workarounds and improvised fixes are another common problem: They have been used in the past to provide temporary solutions to problems with the intention to correct them thoroughly later, but attention moved away from them and turned to more urgent issues. The solutions worked sufficiently well, and the company could afford the additional costs and efforts that they often caused. It may well be that the people who implemented the solutions are no longer in the organization, and the younger staff members think that the workaround is the way that things should be done*. An old proverb says that nothing is as long-lasting as a makeshift. When organizational leaders think of fixing these organizational or technical causes of material and immaterial waste later—something they actually may consider important—other urgent things occur, and the urgent is always the greatest enemy of the important.
Then, someone may benefit from inefficiencies. This person may be the only one who understands how to use the workaround and considers this monopoly of knowledge a job guarantee and a reliable source of power and influence inside the organization. Whereas they publicly pledge to stand by their work, they rather expect the work to stand by them. It is important to identify profiteers of corporate inefficiencies and improvised fixes to predict resistance that they may bring. Temporary solutions add a lot of complexity to systems, and this benefits those people who have learned to handle and manage this complexity. A StaFFA, as discussed above for the benefit engineering activity, developed jointly with a knowledgeable focus group may give interesting insight into the driving and restraining forces that the project manager and the team may face when they try benefit engineering.
A common cause for the long-term survival of inefficiencies in many organizations is the compulsion for them to operate without interruption. One of the pillars of the Toyota Production System (TPS) is called “Jidoka”. Jidoka has contributed massively to the corporation’s success over the last decades. The rule is quite simple: it says that if there is an error found in production, the line is stopped. This is a highly expensive policy, and the cause of the stoppage possibly may be a marginal mistake, but the effect is strong. The entire production line waits, and the attention of all involved focuses on the location of the error; all workers and managers of work stations are encouraged to consider whether they contributed something to the problem. The intention is not only to fix the error, but also to identify and remove the cause or causes and make the line more reliable this way†. Without Jidoka, the cause for the error remains in the line, and the error can re-occur. In Toyota’s understanding, every error is an opportunity to remove an inefficiency or hazard from production, and this opportunity is used to increase efficiency—a fundamental asset of any production.
There are organizations that cannot stop their operations as “easily” as Toyota can. The social network, Facebook, had to stop its services in September 2010 for more than two hours. The explanation‡ given was technical but included the statement that they had to resolve a stable problem by turning off their site, something they considered “painful”. They also conceded that in their other systems, design patterns were used “that deal more gracefully with feedback loops and transient spikes”. Facebook cannot simply turn off its services when a problem becomes visible and resolve the root cause. Interruptions of services are a major calamity for the company and also for the millions of websites worldwide that use their services. The same is true for most providers of Internet services, from flight booking to online learning to web shops and also for others conducting continuous operations such as suppliers of electricity. Their need to deal with errors without interrupting production often leads to a progressive cumulation of workarounds and unresolved root causes of problems.
I had an opportunity to perform seminars at an Internet flight booking provider and saw their ship diesel engines in the basement that protected them effectively from major power outages. However, a small, seemingly insignificant leap second inserted into Universal World Time (UTC) during the night of June 30 to July 1, 2012, brought its services to a halt, which had immense implications on flight booking internationally. They were not the only online company with such problems that night. Again, it is normal in uninterruptable systems that insufficiently handled causes of errors accumulate over time and develop the potential to wreak havoc in the organization and its environment. It is also a normal process that project managers and their teams stumble from time to time over such problems, and that they have the understanding and the resources to fix them.
Project managers may also stumble over opportunities for improvement. There may be unidentified and unexploited enablers in the organization, which may add tangible business value and make business managers shine in the perception of their key stakeholders. Project managers may be the only people to identify these opportunities, because during their projects, they become more and more insiders in the organization and gain the trust of their own management and that of the customer. They can propose value-adding changes to the project that are linked with decisions on new delivery dates, increased price and costs, and whatever additional burden the project will pose for the customer or requester, with the objective of adding business value for the project for all key stakeholders. Their work is intended to bring change to the organization anyway, which comes with some fundamental uncertainty, so the interest in listening to their recommendations is there.
Benefit engineering can combine the two approaches: fixing deficiencies and creating delight. It has technical as well as monetary and humanist aspects. Applied correctly, it is deeply ethical, because it offers the internal requester or the customer a benefit for the resolution of problems, often homemade ones, and these stakeholders have the right to say “No”. Sometimes, it may even be useful to communicate the proposal in a fully transparent way: “Dear customer, we have a fundamental problem with the delivery date (or price or something else), but while looking for a solution, we found one that you may especially like”. You have to know your stakeholders to predict if they will react positively when you use such an approach.
Benefit engineering may help the project manager shine as well. The project is not in trouble, but benefit engineering may increase its monetary or strategic value or create solutions that excite stakeholders. It may lay the foundation to turn a good project into a great one, a true “Wow Project”*.
In customer projects, an interesting aspect of benefit engineering is that the proposal submitted to the customer is not developed in a competitive situation. In most cases, it would be unlikely that another vendor would be able to make a competitive offer: The incumbent contractor has resources and infrastructure dedicated to the customer, possibly at the customer’s location, and has much more detailed knowledge about the situation than any competitor. In some environments, this may lead to a problem for the customer-side managers, who must consider procurement procedures and limitations on business that may be awarded without competition, especially in public environments, where these limitations may be imposed by law. When the decision is made to attempt benefit engineering, all these factors need to be considered.
There are some more caveats. One is that the desire to rethink delivery dates, prices, or budgets and other key project data may collide with the inevitable constraints of the stakeholders’ reality. A legal or contractual deadline cannot be simply ignored, more budget or resources may not be available to these stakeholders, and they may have to consider more factors that limit their freedom. There is no benefit in proposing changes with which the requester, paying customer, or other person disagrees. The project manager must know these limitations before such a proposal is made.
Another point for consideration is the generally two-faced nature of change control or change request management. A project in crisis can be salvaged by intelligent changes, but a project may also be driven into more difficulty if change control is not performed with sufficient diligence and care. Later in this chapter, I will describe what protective change request management should look like. One should also make sure that the proposal is submitted to the decision makers in a way that they find acceptable and that avoids giving them a feeling of being outsmarted.
Benefit engineering to salvage or polish a project is not a risk-free approach. It is recommended to consider the factors shown in Figure 5-4 when the proposal is developed. In a customer project, it has the same risks as any other business proposal to a buyer.

Figure 5-4 Considerations for the development of a benefit engineering proposal.
5.4 Pressure-Free Estimating
One of the most difficult tasks of a project manager is knowing what is going on in the project. One of the factors that make this task so difficult is pressure. Pressure is often applied to teach people lessons of compliance to imposed rules but ends in a de facto instruction on the most effective ways to circumvent these rules, to hide important but uncomfortable information from surfacing, and to obstruct the execution of directions from project managers with whom they disagree.
During a coaching and training assignment at a software company that I will call the Lizard Corporation, I saw how estimating can go wrong. Carl, a software engineer, had been assigned a task in an internal project and was asked by the project manager, Lisa, to estimate on how long it would take for him to finish it. After some time of reluctance and unwillingness, he finally came up with a number: two weeks, or ten work days. He had to wait for a colleague, who had to collect and engineer the requirements of the solution; and based on the results of this work, Carl could develop the basic architecture and the internal processes of the software. Lisa, the project manager, expected the results two weeks later to allow developers to start implementing Carl’s design and develop the software. The developers were booked and ready to start working, but Carl’s design was not. Lisa talked with Carl, and it was not a pleasant discussion with him in my presence, and when he had to concede that he was late, she asked him: “Didn’t you promise me two weeks? I relied on your estimate and planned the two weeks for the project accordingly”. His answer was: “No, I did not promise anything. The two weeks were an estimate based on the information that I had at that time. Today, I know more, much more”.
Estimating is obviously a common source of conflicts. From the estimating party’s point of view, estimating is considered a process that deals with uncertainty. From the point of view of the recipient of the estimates, the estimator is expected to understand the estimates as some kind of commitment, because the estimates are used to develop plans.
Estimates are done in a variety of areas in which a project has something that can be measured. They may refer to technical details, effort, duration, costs, times of disruption of operations, and many other things. Conflicts may occur with all of them. An estimate is an assumption with a number, and it shares uncertainty with all other assumptions. In other words: the estimate may be wrong. The uncertainty of estimates is often described in statistical terms such as Sigma (σ) and Variance (σ2)*, but project managers should bear in mind that the application of mathematics here is statistoid. The typical output number in a project is one, and this makes the application of statistical methods at least questionable for a major part of our work. We nevertheless often use statistoid methods with the simple excuse that we have nothing better, and often enough, they work surprisingly well.
Estimates are the basis of planning, but also of reserves that are put in place to protect the project from the uncertainties that are a natural element of any estimates. It is normal that durations, costs, and all the other estimated dimensions come out a degree under or over the estimate. The problem in the example with Lizard above was that the project manager, Lisa, asked for just one estimate and expected Carl to precisely meet the date. Carl had many other things to consider. The basis of functionality, performance, manageability, and options for further development of the software that his design brings, the risks that may be inherent in his design that may later jeopardize the software, the interfaces with other software in the organization that may cause entire systems to break down if they are not properly developed and implemented, and many more. Even if a project has very good engineers, developers, and other kinds of motivated, creative, and focused team members, project success depends on their motivation, creativity, and ability to focus, and it is rather unlikely that activities will end precisely on the predicted date. Sometimes, when work is easy, the process may be faster; other days, getting the work done takes longer than expected. Sometimes, private problems may interfere with work.
I visited a software company recently in Silicon Valley*, which had pre-pasted disposable tooth brushes in the restrooms. The company found that software created by developers with achy teeth had lower quality. The company also reduces absenteeism with this inexpensive measure. For operations, it is much easier to prevent personal matters from impacting work; for instance, a love-sick bus driver is normally quite capable of driving the bus. In operations, a lot is done by routine and also by habits that develop over time. In projects, it is far more likely that personal issues will affect the project and cause delays and distress. I would never expect a love-sick software developer to finish work on time.
Other factors influence how people will meet their estimates: The dual or even multiple reporting relationships in modern matrix organizations, the dependencies on the timeliness and quality of predecessor work that first must be done, the uncertainty of other work that the person has to finish and that blocks the person’s availability, changes in the internal and external business environment of the performing organization, and many more.
Another aspect that makes estimating difficult is the membership of the estimator in one of two factions that we commonly see: the faction that believes in the “panic” monster, and the faction that is trustful in the “easy” monster. The panic monster makes people estimate overly pessimistically. The estimates are political estimates that are easy for the person to bring to fruition. Their time estimates have a lot of padding, and their cost estimates include major monetary reserves. Pessimistic estimating may also be a sign of deep politeness: “I do not want to disappoint my project manager”.
On the other side of the strait sits the easy monster. There may be more than the three groups that I know on the easy side, but I found mostly sales people, politicians, and young people fresh from university exaggerate on the optimistic side. These are often people who are afraid that the task will be given to someone else with more optimism, or may be dropped because it takes too long, is too expensive, or poses too much of another kind of burden on the organization. As project managers, we understand that we must often navigate between these two monsters, and this is the case here. We do not want political estimates, what we need are just estimates. Somewhere between the two monsters is realism, and this is the route to take. Project managers have to take politics out of the estimation process because politics drive estimators either to the easy or the panic monster.
There are several factors that influence estimating and make it political, and there is a booster that increases their effect. One factor is pressure, which has many negative effects. It tends to lead people into game-theoretical dilemma situations. Experience is an important element of project management, because it is a powerful teacher. However, people under pressure learn the wrong lessons from this teacher. Instead of the lessons of how to build strong teams, how to put the mission first, and how to cultivate an environment of trustworthiness and mutual empathy, people learn under pressure how to effectively obscure failures, finger-point blame to others, and sabotage production to get some additional work breaks—while their employers have to stop production and are desperately trying to get it up and running again. Pressure also leads to fragmentation of organizations. While it is important for managers to know what is going on in an organization, without a well-working secret service inside it, the level of knowledge for high-pressure managers is limited. Pressure can be successful for a limited time but cannot create sustainable systems. This is true for politics, where we see tyrannies successful for some time and then suddenly collapse, and we also see it in companies and in projects.
To illustrate what Lisa’s approach did to the project estimates, picture a car and a narrow street in a little antique mountain village in Tuscany that a family needs to drive along to get to their summer vacation domicile. Most cars have a width including mirrors of just under 2 m (78.7 in). Some sports utility vehicles (SUVs), pickups, luxury cars, and sports cars exceed these dimensions by 10%. Imagine the distress that the driver feels in a 2-meter-wide car when the width of the alley is just 2.2 meters. The driver does not want to scratch the expensive car, so he or she must drive the car slowly through the narrow street, and every bend of the street and every uphill section increases the distress that the person feels. When the family takes the road for the first time, they may wonder if they are on the way to their “doomicile”. People who live in Tuscany have a simple solution for the problem, they use small cars or mopeds that allow them to keep a comfortable distance from the walls to the sides of the street, but many visitors buy their cars based on other criteria, especially those who can afford Tuscany domiciles.
Carl, in the example, felt the narrow road to his doomicile as much as the driver with the wide car in the narrow road. When Lisa asks him if he will finish on time, as polite as he is, he will say yes, even in moments when it has become obvious to him that he cannot. Bob Wysocki called the effect “hope creep”*. This is when team members or contractors communicate that they are on schedule when they are actually late, but they want to avoid the pressure and hope that they can make up the delay with overtime and weekend work. Chapter 2 discussed how project managers learn. Hope creep is the attempt by certain stakeholders to prevent project managers from learning what is going on in the project; they are bending the learning curve in a direction that project managers learn late of delays and other problems, that they could manage easily if they got the information early, but meanwhile, they have run out of options and those remaining are more expensive. The game theoretical dilemma called chicken race, described in Chapter 2, is also a type of hope creep. Others must also be late in this project or program and it is hoped that they will report their delay first. Hope creep is the direct consequence of high-pressure environments, and in its wake, delayed projects with overrun budgets (see Figure 5-5 on following page).
The narrow Tuscany village road describes solutions when no alternative route is available: use a smaller car or widen the road. If the delivery date is near and inflexible, ask what needs to be done by that time and remove all unnecessary scope, at least for the moment. If the scope is inflexible, plan with schedule reserves. For both approaches, you need an understanding of the uncertainties that you need to expect, such as that you want the road to be wide enough compared to the width of the car to make driving less stressful. For our project, we can achieve the same goal by defining objectives as corridors, not as single points.

Figure 5-5 Hope creep bends the learning curve in the wrong direction and makes the necessity of decisions and the available options visible too late, when the number of options for decision making has diminished and their costs increased.
The method of defining such a corridor based on estimates is called “three-point estimation”. It is not new; it was part of the Program Evaluation and Review (PERT) network diagramming method developed in the 1950s and 60s for the U.S. Navy. The other parts of PERT have mostly vanished, especially their network diagramming using arrows to depict activities, but three-point estimating has not only survived, it has experienced some type of a renaissance. The basic approach is simple but powerful, exactly what project managers need. Instead of asking for an estimate, the project manager asks for three estimates and uses simple mathematics. Adding some psychology to the method makes it even stronger. The project manager asks for the three following estimates:
P: the pessimistic estimate. If you are confronted with a lot of problems that can make the work difficult for you, what would be your highly pessimistic estimate?
O: the optimistic estimate. If things go extremely easy and no problems occur whatsoever, what would be your most optimistic estimate?
ML: the most likely estimate. Based on your experience with similar tasks, which estimate would you consider the most likely one?
In the following discussion, I will focus on the time aspect, but the technique is also applicable to cost, technical issues, work efforts, times of disruptions of operations, and more, as mentioned before.
The number used for further planning is calculated with a simple formula:
Plan estimate = (O + 4ML + P) / 6
To give an example:
P = 13 days
O = 4 days
ML = 6 days
PERT value: (4 + 24 + 13) / 6 ≈ 7 days
The results are also shown in Figure 5-6.
For the example, I rounded the value up. I would not plan to finish work on the seventh day after six hours and 40 minutes. This would communicate an accuracy that no estimate can promise.
A question that is often asked when I present the method in classes is, “Why do I use the weight of four that is assigned to the ML value?” There are various explanations why it is just four, none of them is fully satisfying. I recommend simply accepting it as a standard developed by the U.S. Navy half a century ago.
In reality, it is often faster to obtain the three values than just the single one as Lisa did. With three-point estimation applied with some empathy and intelligence, pressure on the estimator is reduced and so is the person’s fear. In addition, the resistance against estimating decreases and the numbers are communicated much more quickly.
The approach one should take should be different for optimistic and pessimistic estimators. Let us first look at how the method would be used with pessimists. Their fear is that their estimates are too optimistic and are then turned into commitments, so take the pressure from them by starting with the “P” value: “If things go very, very badly, what duration should I expect?” As this is the value that they have mostly in mind, they are likely to communicate it rather quickly. It is important that this value is documented to take the pressure from the estimator when more optimistic values are discussed. Then, the question turns to the “O” value—which is now much less of a problem for the person—the possibility that the activity may take longer than what already has been communicated and documented. It may be helpful to remind the person of the earlier days, when we were all much more enthusiastic and loved to make estimates that were almost impossible to meet. The third value is then the “ML” value, which should be located between O and P, mostly nearer to the O value, by the way.

Figure 5-6 The assumed probability distribution of durations for the estimated activity in the example.
The approach is of course again statistoid. The activity is done once and not repeated in major numbers to verify the correctness of the assumed distribution model and the individual estimates. However, it works well in practice.
Optimists feel a different kind of pressure: Someone else may get the job who promises faster delivery, or the activity, or even the entire project, may be considered to be too time-consuming and expensive and is terminated. To take pressure from them, the first question should be for the optimistic value, the one they like most, then the pessimistic, and the most likely value. Once the favored estimate has been made, fear is much lower to add realism to the estimates and prepare the pessimistic and the most likely estimates.
Sometimes, estimators feel uncomfortable about the ML estimate. For such cases, you can use a two-point estimation approach by calculating the plan value with the following formula:
Plan estimate = (P – O) / 3 + O
This computes for the example:
P = 13 days
O = 4 days
Plan value: (13 – 4) / 3 + 4 = 7 days
This two-point estimation is less accurate but is a second-best solution and sufficiently accurate in most cases. The plan value lies between the values of O and P, nearer to O than to P, and this is often where the PERT value arrives, especially when some rounding is applied.
Three-point and two-point estimates have a number of benefits over the single estimation.
Two-point and three-point estimates create a result corridor. The activity is expected to be finished inside the corridor, and the project manager should prepare the project for any result inside the corridor. This is a better planning basis than a questionable commitment on a certain date.
The areas under the distribution curve that are right and left from the plan value are roughly equal. This means that the likeliness to stay under the plan value or exceed it is roughly 50/50. To be more accurate: If the activity would be done repetitively, Carl would often be faster than planned, but when he is slower, he may be much slower. This even distribution allows for robust estimates in which over- and under-estimations balance out. The project manager then needs a set of suitable planning methods to use the first to cover the second. This is easy with money, as a dollar saved in one activity can be used to support another one that has been found more expensive than expected. Money is universal. It is more complicated with work effort. The team member that unexpectedly finished work early in one activity may not be qualified for the work in another one. It is especially difficult with time, because the flow of work may not allow an activity to be started before its predecessor activities have delivered their outputs, which this activity needs as input.
The project manager receives a measurement of the uncertainty that comes with the activity following the formula P – O, in this example nine days. This uncertainty is one of the two important pieces of input to calculate reserves. The other input is criticality. When a project manager has an appointment with a trainer, such as taking me to dinner, the person may be fairly late. The same person is likely to be early for a meeting with a recruiter who has a job opening. If the journey time to the meeting is uncertain, for example, one that is due to uncertain traffic conditions, the person will leave earlier. If the time is less uncertain, the person may, for example, be able to walk, and the person will leave much later for the meeting. The two influencing factors both play a role, and for the uncertainty, P – O is a great metric.
The project manager can develop an early warning system for problems with the activity by asking repeatedly for new estimates for the remaining work or duration. The difference P – O, the metric for the uncertainty, should decrease over time, as the team member should become more secure with the progress. I recommend using candle diagrams to visualize how the uncertainty decreases. Figure 5-7 shows two activities. At first glance, Activity #1 seems more difficult; the PERT value is going up, which means that the task will come in almost four weeks later than originally expected, but still inside the corridor. Activity #2 has lost only one week during its advancement. The candle diagram, however, also shows the team member performing Activity #2 has not gained any certainty in the estimates, which is a signal the team member may have some kind of problem. If the problem has not been communicated, this is a good moment for the project manager to ask so he or she can know about the problem earlier when more feasible options for decision making are open and when the costs for implementing them are still lower.
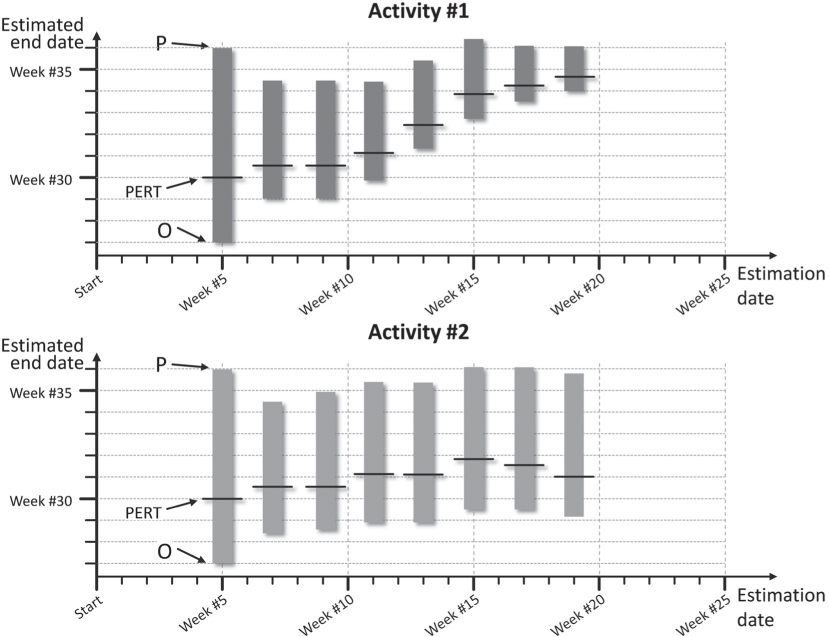
Figure 5-7 A candle diagram visualizes that the team member performing Activity #2 does not gain certainty, while the person proceeds with the activity. This is a warning sign of difficulties that have not been communicated so far. The project manager should ask what the problem is.
There is another question from the initial exercise that needs to be answered. If Carl gave a one-point estimate of 10 days, and the estimation points for the activity were O = 4, ML = 6, P = 13, and PERT = 7, the likelihood for Carl to meet the ten-day delivery date should have been very high. Why did he miss it? There are several explanations, including the probability distribution along the PERT values, which goes to 13 days, and the 13 days are not yet a worst case, just a pessimistic estimate. Here is another explanation. Carl knew, from experience and intuition, that it would take him about seven days on average to do the activity. He gave himself ten days so he felt the activity is not urgent. It may be important, but it is not urgent. Then, he had another task to perform, which was urgent but was not expected. The urgent is always the greatest enemy of the important. The urgent task would have normally taken him two days to finish, so it would probably not collide with the activity in the project, as long as it is not one that is too difficult and tedious. So he decided to do the short, urgent task first. Maybe it was not his choice to make this decision but his line manager’s decision. Then, a problem occurred during the task, it took him more than the three days to finish it, and he started the activity for Lisa’s project late. Then we assumed some problems occurred in this task as well.
When Carl padded the estimate for the activity, he took the pressure away from it but also the sense of urgency. The tailor rule* says: “If you cannot be on time, be early”. The art of three-point estimating is to take the pressure from the schedule without making things look less urgent. In the example, we would expect Carl to deliver in seven days, but we would also be prepared in the not unlikely case that it takes him longer. As the method leads to shorter activity durations, the time saved there can be used to protect the constraints of the project such as deadlines, funding limitations, and others by reserves. If we give up the sense of urgency, our project will always be late.
Is being early a waste of time? Not necessarily. Tell your team members to use the free time to prepare themselves, read documentation, talk with colleagues or the client, and do all other things that help them start the next activity when the time comes, without delay and as planned.
5.5 Protective Change Request Management Process
Eighteen kilometers (18 km, 11 miles) south of the city of Berlin is an airport called “Flughafen Berlin-Brandenburg Willy Brandt”—or to be more accurate, the construction site of the airport. Airport construction projects are notorious for massive delays and cost overruns, such as Denver Airport in the USA or London Heathrow Terminal 5 in the United Kingdom, but the Berlin Airport outrivals them all in this discipline. It was planned to be open in 2010, and while I am writing these lines in late 2015, there is no opening date fixed, but it is certain it will not be opened in 2016. A vivid description of the history of the airport has been described by one of the architects of the airport building, Meinhard von Gerkan*. If your German is not sufficient to read the book, but you have a strong sense of schadenfreude—joy in the misfortunes of others—you may find an article in Bloomberg entertaining and informative†. There is a large amount of analyses available, and they have two failures in common: a dysfunctional fire protection system as a technical one, and ignorance of basic rules of change request management by the responsible people representing politics and management as well as personal ones. In project management, too often we meet people who I call Frog-king managers (covered in Chapter 3)‡. Instead of listening to their teams, contractors, and the experts, they are guided by the first sentence in the Brothers Grimm fairytale: “In olden times when wishing did help one . . .” For the dynamics of success and failure, these people can have a deeply disruptive effect.
I mentioned repeatedly the two-faced character of change requests. Wisely managed, one can use them to steer a project out of trouble, along with the benefit engineering tactic discussed earlier. Change requests can also drive a project into crisis. There are often some big egos in people working on a project, who see the project as a way to leave some kind of heritage to the world and build themselves a monument, and their zeal regarding what this monument must look like exceeds their understanding of what is manageable for a project by an order of magnitude. There are also negligence and lack of discipline by project managers and team members who do not understand that a poorly managed change request can turn into a time bomb.
What process can best protect the project from harmful change requests? First, we should have a clear understanding of what stakeholders in a project should consider a change request and what is not one. Chapter 4 contains a table with the distinction between refinement, making raw definitions more precise, and change. Both are part of progressive elaboration and therefore considered normal in a rolling wave approach to managing a project. This chapter refers to the second.
Project management deals with processes from different knowledge areas, as Figure 5-8 shows.

Figure 5-8 Knowledge areas structured by types of metrics in project management that should be considered in most projects.
Integration management is the knowledge area in which change request management should be concentrated. Then there are three knowledge areas with standard metrics:
Project Scope Management, which includes work effort measured in units such as person-days, machine-hours, etc.
Project Time Management, measured in time units such as days, hours, etc.
Project Cost Management, measured in monetary units.
Sometimes, project managers deviate from these units—for example, when using the Earned Value Technique (a method to compare actuals with baseline data) the Schedule Variance is measured in dollars or another monetary unit. As long as people adhere with the standard units, no explanation is needed. Sometimes, the three areas (scope, time, and cost) are referred to as the “triple constraint” or the “magic triangle”, and while there is a lot of discussion on what makes these elements of project management so special, it is obviously the existence of standard metrics.
In quality management on projects, one can also measure things, but there is a prerequisite. First, metrics—rules for measurement, including the measurement units—must be defined, which can then be used to quantify the quality dimension. The same is true for human resource management and other aspects of project management. As soon as metrics have been defined and agreed upon, one can start measuring.
When change requests need to be managed, all these areas must be considered, and in a situational approach, there may be more that matter for a specific project. Effective and protective change request management does not only relate to scope changes, but also to any change in the project, which potentially has an impact on the plans and their implementation.
Chapter 3 presented this approach to managing change requests. Remember, the appropriate response to any kind of change—including reduction of project costs, early release of team members, altering delivery dates, contractor changes, or whatever it may be that someone wants changed—is to open the drawer of the desk, take out the change request form, and ask the person to fill it in. Then the request will be submitted to an agreed-upon process. If discussions begin on your bureaucratic handling of the request, point to Berlin-Brandenburg Airport and obtain the support from your stakeholders so you can avoid such a disaster in your project. The change request process should not be blind bureaucracy but a protective mechanism for your project.
Who can request a change from the project? A change request can be directly submitted not only by the customer (if the project is under contract) or by an internal requester, but also by any key stakeholder. Indirectly, any stakeholder can cause the team to make changes to their plans and to the implementation, when this helps reduce resistance and increase support and engagement by stakeholders.
Next, decision levels should be agreed upon, as shown in Table 5-1, which is an example of an escalation matrix that may be useful for an internal project.
The example denotes another important requirement for the process: a defined entry point for the submission of change requests to collect them and separate those that have no chance of success from those that should be analyzed and considered as potentially beneficial. The change request management process should then be developed around the elements, as shown in Figure 5-9.
Table 5-1 Example of an Escalation Matrix for Change Requests in a Project

Elements of the Protective Change Request Management process are:
Valid plans. If the change request gets rejected, they remain valid. They should be consistent and compliant with the various project requirements and its deliverables. This includes staff members who are not booked during holiday absences or with assignments of over 100%. It also includes that no delivery is promised in six months, when work is necessary to achieve this time when it will take the team 10 months. And so on. A set of plans with inconsistencies and non-compliances means in essence to plan for failure. If everything will happen as planned, the project will flop. Whereas projects generally do not perform precisely as planned, this part of the plan normally works. The entire process relies on the planning consistency and compliance with the plans. A consistent and compliant plan is easy to identify. If the project would be finished as planned, the project would succeed.

Figure 5-9 The Protective Change Request Management process.
Requested change. Submitted, ideally through the entry point.
Change sensible? A quick check if the request should be rejected immediately because it is not plausible or unrealistic, or because it is too late. This step is important to avoid processing change requests in which assessing their impact is costly since they have no chance for success.
Planning scenarios. There may be one or more scenarios; software can be helpful to develop a second or third scenario from a first one. These are project plans that are derived from the combination of the original plans and the change request and integrate the change request over all areas and consider constraints from the technical side in the same level of detail as legal or contractual constraints. On rare occasions, they may be entirely new plans. Planning scenarios are developed in sufficient detail and maturity so that they could be used as new plans, but they have not been decided upon and approved.
Assess impacts. These are now simply the deltas between the scenarios and the still valid plans. This process step again requires an integrative view of the project.
Identify the decision-making level. Based on the deltas and the escalation matrix, the appropriate decision-making level is determined, and the decision options are presented for approval or rejection.
Decision. If the decision is made to accept a planning scenario as the new plan and with it the change request, the new plan is communicated to the team and implemented.
Are there exceptions or situations in which bypassing the process would be accepted? Yes. Field changes, also known as ad hoc changes, often needed in emergency situations, may dictate circumventing the process. They become necessary when human life or health is in immediate danger, the environment may be damaged, or when other threats have emerged. They are necessary when the risk of not acting or acting too late is larger than the risk of making the wrong decision. Constructive changes are another situation that may require circumventing the process. They are “field changes on steroids”—when the time is not even sufficient to formally agree upon the change, it is just done, and the actual change is later construed by the parties or in the worst case by a court into what was contractually agreed upon and what has actually been executed. Field changes and constructive changes are often done in panic situations and have the potential to damage a project immensely because there is no time to develop the impact analysis and make an informed decision. It takes a lot of experience and discipline to implement them to the benefit of the project.
5.6 Registers
In earlier decades, project managers kept a set of “logs”. Later, the logs were referred to as “lists”, and then they became “registers”. In essence, they are all the same, and while keeping registers seems inexpensive and trivial, they are inexpensive but not trivial. One does not even need expensive software for them, just anything that enables building tables. Paper and pencil are also fine.
5.6.1 The Assumptions Register
The worst industrial disaster that has struck Japan since the Second World War was the destruction of the nuclear power plant at Fukushima Daiichi on March 11, 2011, by a magnitude 9 earthquake, followed by a 14-meter (15.3-yard) tsunami that flooded the entire area. The accident was rated at level 7 on the International Nuclear Event Scale—this is the highest rating on the scale. It consisted of three meltdowns, and in terms of nuclear disasters in peace time, the technical havoc could not have become worse.
Fukushima Daiichi is located in only 225 km (140 miles) northeast of the city of Tokyo and the surrounding Greater Tokyo Area, where over 37.5 million people live—more than the population of Canada. The area is one of the most populous and also most densely populated metropolitan regions of the world. One would expect that the engineers, who built the power plant and commissioned it in 1971 in the proximity of such an area, would have dedicated an intensified degree of diligence to the safety of the plant, given its closeness to such a vast number of people and also given the frequent maritime northeast winds that could carry nuclear fallout from the plant to Tokyo in just hours. The events in 2011 have shown that this is not what they did.
Reports on the disaster point to a root cause: assumptions turning into facts (see Chapter 2). Simulations that were made to test the robustness of the plant in the case of seismic incidents assumed a much smaller earthquake and, therefore, a much smaller tsunami as a consequence. The subsequent results of the research were acceptable to the engineers. It saved them costs, it simplified the project, and it accelerated the entire progress. The Wall Street Journal reported in 2011 that the location of the Fukushima rector was originally 25 meters higher, well above the height of the 14-meter tsunami, but in order to save construction cost and get easy access to cooling water, the ground was broken and the plant was lowered to a level of ten meters, which the tsunami easily overflowed*. Discussions on the questionable basis of the assumptions were not allowed, and diverging opinions were suppressed†. With over 35 million people living in the vicinity, such behavior is not a sign of responsible decision making, as history showed in 2011. People in the Greater Tokyo Area were lucky that the winds were blowing most of the radioactive fallout over the sea, so that the landside contamination remained low except in the direct neighborhood of the plant.
Independent of the industry, many project managers have experience with factoids. When I address the topic in class, the majority of my students have similar stories to tell. Assumptions turned into factoids are often communicated in statements beginning, “We all know . . .” or “There is consensus among experts . . .” No one verifies them, because no one wants to hear the uncomfortable truth. Another aspect is that it is much easier to formulate a hypothesis than to verify it, and most project managers are paid to deliver, not to do research. So, for the sake of simplicity and to please key stakeholders, people often assume that assumptions are not assumptions. Factoids can directly damage the project or, as happened in Fukushima Daiichi, result in time bombs that go off years later.
One word on time bombs: It is interesting how people can get used to active time bombs. In action movies, they are often used to put a hero under pressure to make a decision if he or she will cut the blue cable or the red cable to disable the bomb. In these movies, the ticking clock always shows the time when the bomb will go off, there are only seconds left, and this adds significantly to the thrill for the audience. The audience has paid for the thrill, so it is a perfectly acceptable approach in entertainment. Reality is not meant to entertain, it is just there, and it is different. There is no ticking clock and no display, so people are calm when they should be alert. For them, protecting oneself, their loved ones, the community, and the environment from a known time bomb may be important, but there are more urgent things to do today, and the urgent is at all times the enemy of the important.
There should be a major earthquake in Southern California every 110 to 140 years. The last one was in 1857, almost 160 years ago. Some people take this as calming observation—the risk is smaller than it was in the past. They should not be calm. Tectonics in geology follow a rule that if an earthquake has a historic repetition frequency and comes late following this frequency, it will is likely to be more vicious. The area at stake has over 22 million inhabitants and includes the cities of Los Angeles and San Diego.
Another example: Mount Vesuvius in Italy is an active volcano that had a small eruption every 13.5 years between 1660 and 1944. In the 70 years since the last eruption, it has remained silent and has probably built up internal pressure that will make the next eruption more vicious. It has a notorious history of destroying villages and cities with ash rains and pyroclastic flows, highly mobile clouds of hot gas, and molten ash and rock that come down the flanks of a volcano with speeds of up to 700 km/h (400 mph). The most famous of these destroyed the cities of Pompeii and Herculaneum in 79 AD. Today, the modern province of Naples, with three million inhabitants, is in the direct vicinity of the volcano; it is Italy’s most densely populated area. The distance between the peak of the Vesuvius and Naples main station is only 13.5 km (8.4 miles), and one can easily see the volcano from inside Naples. Scientists found a 4-meter (4.4-yard) thick layer of volcanic matter under the city, explained by an eruption 3,800 years ago, that was far more devastating than any other known in this area and that could repeat at any time. Vesuvius is a permanent threat for everyone who lives there, and it is seemingly hard to ignore, but this is what people do. They feel calmed by the statements of scientists that the next eruption will not be as disastrous as the historic ones, and there will be enough time to evacuate Naples and the surrounding cities if the volcano becomes active. An evacuation plan has been developed, which adds to the sedation. This is all based on many assumptions: one that there will be no panic that would cause people to clog roads and trains; another that there will be enough time to execute a decision to effectively evacuate the region—a difficult decision given the risk of a false alarm; and a third that the eruption will not be a surprise but will be preceded by early warning signals. Another assumption is that the wind will not blow clouds of ashes in the direction of the city of Naples. Comforted by scientists, the people from Naples have become used to the time bomb nearby and live their normal lives. When one talks with them, they are more concerned about the urgent deficiencies of their public services and traffic conditions, caused by a widely dysfunctional administration (as they say) and the throttlehold of the Camorra, the local organized crime organization that debilitates the society there. Many of them see Vesuvius as a source of income; it is one of the greatest tourist attractions of the city. However, one day, the time bomb will inevitably go off, and the past destructions of Pompeii and Herculaneum give a strong indication of its devastating power. Recently, a small number of scientists recommended completely evacuating a region of 20 km around Vesuvius, which would include the entire city of Naples*. This recommendation is of course also based on assumptions, but these have been developed with more accurate data. In Naples, people do not discuss the recommendation and would probably never follow it.
Back to project management, where most disasters are fortunately much smaller and less devastating. Assumptions are a necessary element of project management. Many decisions must be made early, before sufficient knowledge is available, and corporate managers, project managers, and team members will have to make assumptions and then base decisions on them. Assumptions are made during the internal project selection process or during the business development process in customer projects. They are later made when the project is chartered and planned and accompany executing and monitoring/controlling. Making assumptions is sometimes even necessary during the formal close-out of a project.
Assumptions may be wrong.
How can project managers inhibit the development of factoids from these assumptions that ignore the natural uncertainty of assumptions? How can they avoid having assumptions calm down stakeholders and make them ignore time bombs and other threats that should be studied early and considered in decision making? A very simple solution: make a list of assumptions, or in modern terms, prepare an assumptions register. Whenever an assumption is made by the project manager or by another stakeholder, it is added to the register with some basic information: when it was made, by whom, and—the most important information—what decisions were based on it. Eventually, the assumption is replaced by evidence, which confirms the assumption or replaces it with better knowledge as part of a normal learning process, as described in Chapter 2. The project manager then marks it as closed but keeps it on the register for later evidence. There are three times that such a register will prove to be helpful for a project manager:
Someone turns the assumption into a factoid, such as: “Scientific simulations have shown that a tsunami cannot be higher than five meters at this coast”. All the project manager needs to do is point to the register and ask if evidence has been found that proves the assumption. If this has not happened, the assumption remains what it should be: an uncertainty with potential effects on the project and its deliverables.
An important process of project risk management is risk identification. The assumptions register provides valuable input that can be used during a risk-finding workshop. The attendees walk through the register, entry by entry, and ask about each of them: What if the assumption is wrong? Further questions may be: Why could it be wrong? To what degree can it be wrong? When can we know for certain if it is right or wrong?
Decisions are often criticized by stakeholders with knowledge from hindsight. “How could the project manager make such a poor decision?” The assumptions register may then help remind people of the inadequate information available at the time the decision needed to be made.
Another issue in project management is rework—the time that project teams spend working again on deliverables that have previously been considered finished. When assumptions prove wrong, a common necessity is rework, which causes additional availability of resources to become necessary, together with adjustments to the schedule, causing the budget, operations, and other projects to be be disrupted, and so on. An assumptions register helps stakeholders stay prepared.
The assumptions register is a great tool for SitPM, as it helps the project manager and the team not only develop a better understanding of the relations between uncertainties and decision making in specific situations but also remain concerned about its risks. It is also a continuous documentation of the learning process and how the team develops certainty out of uncertainty over time.
5.6.2 The Constraints Register
Constraints are hard limitations. Many constraints are found or imposed at the onset of the project, while others occur as the project is planned and executed. Deadlines are constraints and so are budget and funding limitations. There may be technical constraints or others relating to resource availability. They all have in common the fact that the project manager cannot decide upon them, while they limit the project manager’s freedom to make decisions.
Constraints have three concerns for project managers:
The project must meet them. This is simple of course, but keeping track of how a project performs against a multitude of constraints can be a difficult task. An example: A project has four deliverables that must be finished on time and that have to be created in four sequential activities. Deadlines have been imposed, and durations have been estimated as follows:
Project start: November 2
Activity A. Deadline: November 30, duration 20 days*
Activity B. Deadline: December 24, duration 17 days
Activity C. Deadline: January 7, duration 15 days
Activity D. Deadline: February 5 (= overall deadline), duration 14 days
Such a list is quite confusing, and this is still a simple one. Each of the four duration deadlines must be met. At first, a brief overview may look promising. After more detailed analysis, however—for instance using project management software—you see that one deadline cannot be met, the third one. Observing one deadline may be easy, but observing a multitude can be difficult. Project management software in the hands of an expert can be helpful for such tasks. The constraints should be listed in the constraints register so you do not forget one of them or lose track of them during the course of the project. Not realizing that the project is on a path to miss one or more of the constraints can be detrimental to the project. You should use scheduling methods and possibly software to identify those constraints that you are likely to miss. Figure 5-10 shows an example of how network diagramming done with project management software can help identify the truly difficult deadlines.

Figure 5-10 The project has no difficulties meeting the first and second delivery dates, but the third is a problem.
Figure 5-10 shows another effect of constraints: They are part of the identification of reserves in time, cost, and other dimensions. The milestone “A-D finished” should be completed on the evening of February 1. The deadline, a time constraint, is set for February 5. This leaves a schedule reserve of four days. If something unexpected happens, these four days may be used to respond to the problem. What are reserves? Reserves in project management are generally defined as the difference between objectives and constraints, or the differences between what we want and the limitations of what is or is not allowed. Reserves can be “slack” or “float”*, if they are the incidental results of the logics in the plans, or “buffers”, if they are deliberately placed by planners to protect the project from missing the constraint. Excessive buffers are sometimes referred to as “padding”; as most reserves come with costs, padding can be quite expensive. Sometimes the project lacks any reserves, which means that the project can be derailed by minor unplanned events. Table 5-2 (on following page) is an overview of the generation of reserves from objectives and constraints. A project manager without reserves is a feeble bystander of important events.
A constraints register is a valuable tool for risk identification along with the assumptions register. When the team becomes aware of a constraint, it is often unclear as to its impact on the project. One constraint may not have an effect, while another one may make it impossible for the team to meet all requirements and can derail the entire project. During the risk-finding workshop, the constraints register can be used as a second source for risks. One discusses them one after the other and asks, “What risks can each engender for the project?”
5.6.3 Requirements Register
There are various approaches to listing requirements, from using simple checklists to a “Requirements Traceability Matrix” to a more complex “Requirements Breakdown Structure”†. One may also use a more complex special purpose software, for which a number of products are available. These are all acceptable forms of requirements registers that help capture, document, and track requirements over the course of the project. Again, there are several reasons why it is useful to capture requirements in the form of keywords with some additional information. One reason is the large number of documents in which they can occur. A project may have a Statement of Work (SoW) from the requester or customer, the team may have developed a scope statement, the project manager may have been formally authorized in a project charter, and there may be hundreds of e-mails, or some may have been discussed only in a meeting. Keeping track of all these requirements can be a difficult task, but project success will definitively depend upon the degree to which they have been met in the end.
Table 5-2 Reserves Are the Difference Between Objectives and Constraints

Another reason is deliverable acceptance. For a small project “among friends”, this may be a quick and informal job, because the team has all the trust that it will resolve problems that later may occur quickly and in an informal and uncomplicated manner. In a larger organization or in a customer project, acceptance will have to be more formalized, and for such cases, a plan for acceptance and handover may be useful. Such a plan can be developed much more easily if there is a requirements register.
In addition, the requirements register can be used during a risk-finding meeting. The group then goes through the register entry by entry and asks, “What risks can be linked to specific requirements?”
5.7 Meetings
Death (of a project) in the Kickoff Meeting. It was late in 1998. A merger project was planned between two groups of companies, Rattlesnake Inc., an organization with over 55,000 employees, and Viper Group, with about 31,000 employees. By that time, both groups had subsidiaries in energy and energy-intensive production industries such as packaging, metals, and chemistry and were fierce competitors in many markets.
The merger project was managed by a consulting firm, Mongoose Ltd., for which I frequently worked as a trainer at that time. The assignment for the merger project gave me a fully booked calendar for the next few months to conduct project management seminars for several hundred sub-project managers from both groups of companies that were going to become one big company. The goal was to link the various Rattlesnake companies with their respective Viper counterparts and identify synergies from mergers, or at least from tight cooperation, between the companies from both groups. This would reduce the number of administrative staff in relation to the productive staff and, at the same time, reduce the pressure on prices and service quality from the competitive situation.
I was considered a core team member of the project and was therefore invited to join the kick-off meeting, during which the project was presented to the top managers of the member companies of both groups. Over 100 top managers from member companies of both groups travelled to one location, and one could hear a nice mix of languages and dialects.
The meeting was opened by the CEOs of both groups. They had some introductory remarks and then introduced the project manager, a senior consultant of the consulting firm Mongoose, who presented the details of the merger project.
During the presentation, a Rattlesnake manager spontaneously stood up, and I remember that he asked a question, “I can of course only speak in the name of my direct colleagues, but I am sure that my concern applies to our Viper colleagues as well. You may not be aware that we are already packed to the rafters with our day-by-day work. We do not have any free capacity to utilize for the project. So, what should we consider more important? The project or our daily business?”
The consultant responded, “The project has of course highest priority. It is the future for all of us. Without the project, our organizations will have no potential, as both are too small for their markets. But . . .” taking a short break, he gazed to the CEOs for confirmation, “. . . but you must at the same time make sure that your daily work will not suffer from the project. Otherwise, our competitors would be laughing up their sleeves.”
In this moment, the managers’ dissatisfaction was easy to sense.
A reliable contact told me what happened after the meeting. A group of Viper managers called the major shareholder of their company and convinced him to stop the merger, because they regarded it essentially as a takeover. Some weeks later, the failure of the project was officially communicated, of course with some other explanations given.
I had to delete all the entries in my booking calendar and find new business somewhere else. Rattlesnake merged two years later with another group, Boa Corporation, to become a large energy firm; Viper was split into two companies a year later.
What is a kick-off meeting? As a trainer, I observe a common confusion between the term “kick-off meeting” and other common project-related meetings, especially the “on-boarding meeting”. On-boarding meetings are performed during the course of the project, when team members or contractors have joined and are introduced to the project and its stakeholders. Rarer, but also observable, is the confusion with the handover meeting, which “kicks off” the use of the deliverables. A project with several handovers can also have several handover meetings. These types of meetings are different and take place at different times, as Figure 5-11 illustrates for a project with five on-boarding meetings and three handover meetings.
A kick-off meeting presents the project to key stakeholders and obtains their formal approval. These stakeholders are required to provide resources to the project, including management attention, people, machines, work space, funding, and more, and their operations or other projects may suffer from disruptions from this project. Normally, a project only has one kick-off meeting but may have multiple on-boarding and handover meetings, because it is normal that team members join the project team at different times and that deliverables are handed over in increments. There are two reasons to plan more than one kick-off meeting. A phased approach may require a kick off the individual phases, so each of them may have a phase kick-off meeting. Another reason may be that the project is a customer project, and it may be appropriate to have two kick-offs: one with the customer to discuss issues that the customer should deal with, and a second, internal kick-off for those issues that are private to the contractor, including the important questions, “How does the project plan to make a profit for the contractor?” and “How will the project be coordinated with the other projects in the contractor’s project portfolio?”

Figure 5-11 A project with several on-boarding and handover meetings but only one kick-off meeting.
An on-boarding meeting may be an excellent opportunity to discuss any team member concerns and objections in a free and open atmosphere with an open agenda. It is often the first meeting in which the team members come together, and it is a good time to discuss assignments and what they mean for the team. A kick-off meeting is different. Attendees are managers, possibly top managers, and any critical questions that cannot be answered satisfactorily may lead to project termination. The kick-off meeting is the opportunity to win management support, but is a time when a project may be terminated, so it needs to be planned and executed in a flawless way.
Who should join a kick-off meeting? At the least, the project manager, supervisors from management groups, and the core team members.
There is no universal definition of what constitutes a core team. I propose a definition that core team members are those stakeholders who are assigned as contributors to the project over the entire life cycle and who will perceive project success as a personal success and project failure as a personal failure.
There are other considerations—for example, operational project stakeholders have to tolerate many inconveniences when they agree to support a project:
Provision of staff and other resources to the project
Operational disruptions
Competition for management attention
Uncertainty and risk that naturally come with running projects (while operations strive for predictability and order)
Distress and conflict over staff assignments in matrix organizations
Additional needs for travel and communications over distances and often over time zones
The kick-off meeting should address these and more issues. It can be a critical moment. Some attendees are high-level managers, and when discussions become scrutinizing, they may finally lead to project termination before its execution has started, as the example showed. Therefore, it takes preparation to conduct a great kick-off meeting and to ensure that the core team can answer any difficult technical questions to assist the project manager.
There is another aspect to consider for kick-off meetings and also for any other moments of communication with management that are intended to bring about decisions: Managers like to base decisions on numbers. Give managers wrong numbers, and they may make poor decisions. Give them no numbers at all, and you may not get any decisions from them.
Handover meetings and acceptance meetings may be conducted during the same event, or they may occur separately. Both are often conducted with a low degree of diligence. The impression in practice is often that the expectation is more to create a list of concerns that will then be used as backlog for the final work rather than as an event that allows the project manager and the team to shine and finish the event with pride and all necessary signatures. After months, possibly years, after the project has been performed, this is not the end that the contributors deserve.
I mentioned the requirements register earlier; it is a useful tool to develop handover and acceptance plans. Simply go through the entries in the requirements register one at a time and decide for each one whether and how they should be verified or validated, transferred, and formally accepted. If a project manager wants to create a checklist for handover and acceptance, the requirements register is the document that helps create it easily and inclusively.
5.8 Scrum
Discussing the dynamics of success and failure, we have already seen concepts that were from sports, such as the distinction of closed-skill and open-skill disciplines discussed in Chapter 1. The word Scrum has been taken over from Rugby, a very open-skilled sport, where it describes a status of interlocking of six or eight players of each team with the “ball” somewhere in the middle. Each team tries to bring the ball under its control by hooking it backwards with the feet to the outside of the scrummage, where a player can take it and carry it away. The term describes a highly competitive moment where both teams’ success depends on their combined strength, which is strange, because Scrum as a development method tries not to be competitive at all.
Scrum originated in Japanese product development* in the 1980s, and was transferred into software development in the early 1990s by Ken Schwaber, Jeff Sutherland, and others. It was soon carried over to other application areas such as organizational development and engineering. Of the various “Agile” methods, it seems to be the most popular one, and has gained the highest presence in public media and on-line discussions. The early development of Agile methods was focused in the “Agile Manifesto”†, which was published in 2001, and then implemented in the form of several rule systems including Scrum. The word “manifesto” indicates one of the basic problems with Agile methods in practice: they are sometimes communicated as a kind of ideology.
The reminiscence to the German Kommunistisches Manifest of Karl Marx, published in 1848, is obvious. Its contents, however, arise more from the French Manifeste de l’Anarchie, published in 1850 by Anselme Bellegarrigue, with his central tenet that “Oui, l’anarchie c’est l’ordre; car, le gouvernement c’est la guerre civile”‡. A Manifesto is a document that turns a strong personal opinion into a dogma. Common for all manifestos is a black-and-white perception of the world, combined with an “us-and-them” attitude, which either negates the existence of shades of grey or locates them on the “them” side§. There is a basic understanding by many of its promoters that Agile principles are indeed a kind of ideology or dogma. Agilism comes not only with self-organization, but also with the presumption that the entire rest of the project world uses harsh command-and-control approaches. This Agilism has made it difficult to assign these methods a valuable place in a tool kit that a project manager should be able to select from and apply in certain situations. When the head of a Project Management Office (PMO) of an international electronics company told me some time ago that it was moving all of its projects to Agile methods, I wondered if it was not replacing one problem with another one. In a situational toolbox, however, which asks for the situational appropriateness of a method or tool before it is used, Agile methods fall into place and should definitively be included; with its popularity and simplicity, Scrum may be one of them.
There is a lot of literature on Agile methods on the market, and there is also an abundance of experts available. I will focus here on those aspects of Agile methods, and especially Scrum, that are of interest to include in the toolkit of a situational project manager. The description will not be complete.
The basic idea behind Scrum is to allow late changes to the requirements that a project needs to meet. In my classes, I use an example. I look for the student who lolls most in his chair (I have no idea why, but men tend more to loll in chairs, when women on average prefer to sit upright, at least in my classes) and then ask the person, whom we will call Jack for the exercise: “Jack, are you sitting comfortably?” The person is normally surprised, often changes immediately to an upright position, and answers “Yes, I am”. I ask the person, “Great, what does it take for you to sit comfortably?” Jack says, “Well, a comfortable chair”. My next question is, “Can you explain what makes a chair comfortable for you?” The answer is, “Of course, I can. It should have four legs (most classroom chairs rather have a set of five swivel casters), it should have arm rests (many classroom chairs do not have that either), a seat cushion in the right height . . .” and so on. Then I ask, “Can you tell us a bit more about the cushion? How soft should it be?” This question makes most students feel slightly uncomfortable. “Well, it should be soft.” . . . “Very soft?” . . . “No, not too soft.” I go on, “But would you also dislike sitting on hard wood?” “No, I would dislike to sit just on wood. The cushion should be—well—middlesoft.”
Then I select another student, Jane, for the example, and talk to the group: “It will surprise you all, but Jane has a secret hobby as she makes custom chairs, perfectly formed for a person’s back, and optimized to make the person comfortable. Others tinker on their motorbike in their leisure time, or collect stamps, or knit pullovers, but Jane makes chairs.” I turn to Jane: “Would you be able to cushion the chair for Jack to make it ‘middlesoft?’” During the following discussion, it becomes clear that “middlesoft” sounds understandable and sufficiently accurate in normal life, but as soon as one has to make a chair cushion “middlesoft”, the person will find that the information to do so is insufficient. People who make chairs must have a clear understanding of cushions and how to give them the right softness, but normal people do not have the language, the metrics, or the understanding for accurate statements. This is strange since we sit so many hours a day on chairs—at work, in the car, in mass transport, during meals, when we play with children, and on many other occasions. We have years, possibly decades of experience with chairs, but we are all unable to explain what a proper chair cushion would be. We can do that when we sit on a chair, but in project management, delivering the results to see if they are what the requesters or customers need would probably not be an acceptable approach. I have used this example for over 15 years to describe the principles of Voice of the Customer (VOC), and I didn’t have a single student who could answer the question for the perfect seat cushion in sufficient accuracy and detail.
Scrum accepts this basic inability and allows customers and requesters to come late with change requests, which reflect their improved understanding of what they need, based on partially finished results. This is diametrically opposed to traditional principles such as that of old Roman Vitruvius, who demanded over 2,000 years ago that a house should be arranged by three drawings: ground plan, front view, and perspective, which are created through reflection, careful dealing with what is known, and invention—boldly moving forward to discover the unknown. A Scrum project in contrast moves forward by continuous development and delivery in small increments. In Scrum, the way forward is done by walking, and the results that it produces may be different from the requirements and objectives that were known when the project started. This also sets the first limitations on the method: If you have to consider long lead times to book resources and order goods and services; if you have to obtain licenses, approvals, and budgets early in your project; or if you have other requirements that make long-term predictions necessary, Scrum is the wrong method.
There is a set of prerequisites that stem from a principle: Scrum is leaderless. There is no such thing as a “Scrum project manager”. This means that a great team with high competence and dedication leads itself, which has already matured through the four Tuckman phases: forming, storming, norming, and performing. This team puts mission first and is prepared to work as a “band of brothers and sisters”. Scrum teams are commonly collocated to allow self-organization, and the members are mostly dedicated to the project and almost permanently available, so that the team does not have to deal with availability schedules. An often overlooked aspect of self-organization is that team members must be given time and freedom to coordinate themselves. This nonproductive time is often considered a productivity reserve, when delivery dates become pressing; instead of coordinating itself and its work, the team is then disorganized. The team also needs the freedom to discuss and make decisions, which comes with trust by upper managers and customers in their integrity and professionalism. Most Scrum projects are not decomposed, but composed, so the communication tools and the work environment must support the approach.
Scrum does not define a lifecycle approach, but a fixed set of team roles, artifacts (= documents), meetings and a regular work rhythm (=time boxes). Figure 5-12 shows the basics.
A sprint is a time frame, mostly between one to four weeks, rarely more, during which a working result in the form of a “potentially shippable product” is developed, an increment that could in theory be handed over to users and used. Some will indeed be handed over, as they are the actual releases. The potentially shippable product is developed, tested, and accepted and ready for a theoretical or actual handover. During a sprint, no changes are allowed. The product owner collects the change requests and feeds them into the process in the meantime between two sprints, which is used for the last sprint review and decision making for the next sprint. A second iteration cycle is each development day, which begins with a daily standup meeting to coordinate the team and discuss issues.
Project roles in Scrum are:
The product owner is the person responsible for the functions and the overall success of the product. The product owner defines and prioritizes the product properties in the product backlog and shares responsibility for the economic impact of the product. In a customer project, the product owner represents the customer side of the contract.

Figure 5-12 The major roles, meetings, and artefacts in a Scrum project, and the sprint iterations based on backlogs.
The Scrum master is responsible for the successful implementation of Scrum and removes obstacles. He or she ensures the adherence to the Scrum practices, values, and completeness along with the functioning and the productivity of the team. The Scrum master is understood as a facilitator and method expert rather than as a manager.
The Scrum team is responsible for the product success and for its incremental delivery. It consists typically of five to nine people from various functions, who work full time for the project.
A Scrum project may have further roles, such as managers, but the roles above are the core roles. Documents used in Scrum are:
Product backlog, the list of increments (components, functions, and features) of the final product; ideally defined in a way that one could “sell” each of the increments theoretically as a potentially shippable product. The approach is used to decompose work, validate progress, and allow for quick wins.
Sprint backlog, the list of increments (components, functions, and features) that are expected to be developed during the current sprint.
Burndown chart, a graphical representation of the remaining tasks and efforts for the current sprint.
Further artifacts are the impediment backlog, which deals with issues and obstacles, and the “definition of done”, which is a checklist of actions that the team must complete, and the results generated by these actions.
Sprint uses three types of meetings:
Sprint Planning Meeting
Daily Scrum Meeting
Sprint Review Meeting
Further meetings are the Release Planning Meeting, the Estimation Meeting, and the Sprint Retrospective Meeting.
A strength of Scrum is the strict discipline regarding the sprint cycles, which balances against the uncertainty on the scope. Scrum requires small, cross-functional, and collocated teams that are assigned full time to the project, have passed the difficult phases of team development, and are dedicated and skilled enough to pass with the customer along a path that needs yet to be explored. It also requires a strong customer/requester representative who dedicates time to the project as product owner and shares responsibility with the team for overall success. This is a combination of requirements, which is quite a good recipe for success in exploratory projects with or without Scrum. Scrum works less well, when the following occurs:
A high degree of predictiveness is required and predictions are possible.
A clearly described work flow is necessary early in the project to prevent rework, quality problems, and safety hazards.
Planning must be granular, and the project manager must enforce it against resistance.
Proximity of team members to distributed users or markets is more important than between them.
Clear assignments of responsibilities, but also of costs and effort, are needed.
Availability of team members is uncertain.
The sprint duration is insufficient to generate a “potentially shippable product”.
The development work must be done isolated from the requestor or customer.
5.9 PDM Network Diagramming
Agile methods such as Scrum are favorable in exploratory projects, where the way is made by walking. Other projects, however, allow for long-term predictions, many necessitate long-term plans, and Agile methods are insufficient for such projects—they were not developed for them. On these projects, resources are scarce and must be booked early in advance. Agreements with contractors must be made in a timely way, possibly preceded by longer business development phases by both the customer and the contractor. Operations must be able to prepare the working environment in time for the disruptions and changes that the project will bring for them. A workflow plan is often necessary to understand and visualize how activities interrelate and to validate timely delivery or show the impossibility of meeting deadlines at an early stage. The predictability of operations, their most critical business asset, is often heavily impacted by the disappointments that almost inevitably result from poorly planned and managed projects. These disappointments can impact the organizations involved or entire societies. Following a “we resolve problems as they occur” strategy is a recipe for failure when the moment of occurrence of a problem comes too late, and when all options to effectively manage it have already vanished.
Predictive approaches may include many knowledge areas. The project team may have a cost plan based not only on price lists of suppliers, but also on forecasts of billable or internally chargeable work or availability times. Workloads must be predicted to ensure that resources are booked in sufficient quantities over appropriate periods. We may have various management plans that describe our project management processes, responsibilities, methods, tools, etc. that we are going to use in the project, and so on. My focus in the following paragraphs will again be on the time aspect, because this is the most complex one. As already mentioned, costs are comparatively easy to calculate since the sum of all individual costs in the project is the total cost. If the cost of a work item increases by $1,000, the costs of the entire project increase by the same amount, and money saved in one work item can easily be used to cover additional costs in another one. Money is universal. Managing work amount or effort is slightly more difficult. The sum of all work amounts is the total work in the project, and if the work amount in an activity increases by 10 person-days, the total work of the project will increase by the same amount. Work is more complicated than cost because a resource that unexpectedly became available in one activity may not be able to do unexpected additional work in another one. Humans may have the wrong qualifications, machines the wrong functionality or power, and the geographic distance between the locations of the two activities may be another obstacle. People’s egos should also not be under-estimated—you cannot require a developer to clean the restrooms.
Time is different. Adding up individual durations of work items does not give us the total durations. Some activities can be done concurrently, and one should never underestimate the effect of idle times—mostly neglected in literature and education but a strong impact factor in reality—which some teams may be able to reduce to a minimum but will never be able to avoid completely. Instead of simply adding up individual numbers to obtain the total numbers, as we would do with work and costs, we need to use a more sophisticated tool, which is network diagramming. Chapter 4 discussed the history of four concurrent developments in the late 1950s and early 1960s in the USA and France, called PERT, CPM, PDM, and MPM. The survivor of this competition was PDM with elements of CPM and MPM included and further enhanced by special software, which upheld the underlying mathematics but changed the standard graphical representation to what is now commonly, but falsely*, referred to a Gantt chart. In addition, software adds restrictions of resource availability as another element to network planning, which allows the creation of far more realistic plans. Resource bottlenecks influence project progress much more than what was accounted for in the original methods. Network diagramming can help predict the future up to a long planning horizon, depending on the completeness, the realism, and the reliability of the basic data and the work flow model used.
Figure 5-13 shows an example of a simple network diagram in PDM notation, which means that activities are drawn as nodes (boxes), dependencies between them as arrows.
The diagram shown follows some basic rules and simplifications that make the example easy to understand:

Figure 5-13 A simple network diagram with forward pass (top) and backward pass (bottom) dates.
It is assumed that activities take full days to be finished.
Days are shown as working days. If the first day is a Monday, the sixth day will be a Monday too.
Holidays and other interruptions will not occur.
It is assumed that a working day starts in the morning and ends in the evening.
In the calculations of slack, it is also assumed that all activities are started at their earliest dates.
It is assumed that no resource shortages will impact the schedule. When the network, for instance, allows Activity D and Activity F to be performed in parallel, there are enough resources available for that. It is also assumed that resources are always available at any time, when they are needed.
I discussed earlier that this last point is probably the weakest point of many planning methods, including Agile and predictive methods: the underlying presumption that resources are generally available when they are needed. My experience and observations are rather that resources are not available when they are needed and that the project manager must work hard to acquire them. They may not be available full time, and promised availability may later be discarded when the project has to compete with more urgent undertakings of the performing organization. Managing both a work flow and the often volatile availability of resources manually is a task that can overpower a project manager, hence my recommendation to use project management software, which can ease this job significantly in the hands of a well-trained person and allows for new predictions when they are needed. In this chapter, the discussion will focus on predictable projects and predictive approaches; we will therefore ignore this question for the following discussion.
When the diagram has been developed based on the workflow identified or designed by the project manager and the team, and when duration estimates have been made (I recommend PERT 3-point estimation), a forward pass series of calculations has been made to show the earliest start and end dates for the activities and identify the earliest date for the milestone, simply by going left to right through the diagram and adding up the durations of the activities. They have been denoted in the top left and top right corners of the nodes. Then, a backward pass series of calculations has been made from the milestone date going left, subtracting the durations. This gives us the latest dates for the activities, denoted in the bottom left and bottom right corners.
For the forward pass calculations, we have to take care of sink nodes, also called convergences, the points at which parallel paths merge. The beginning of Activities C and G are sinks, and this is also true for the milestone. At a sink, the successor can only be calculated when the predecessor has been calculated. During the backward pass calculations, we have to consider burst nodes, also called divergences, places at which a diagram path splits in two. In the example, this happens at the end of Activities A and D. The latest dates for burst nodes can only be calculated when the dates for the successors have been planned.
The diagram also shows free and total slack*. Free slack is the number of days that an activity can be delayed without affecting another activity. Total slack is the number of days that an activity can be delayed without impacting the earliest milestone date (as shown in Figure 5-14).
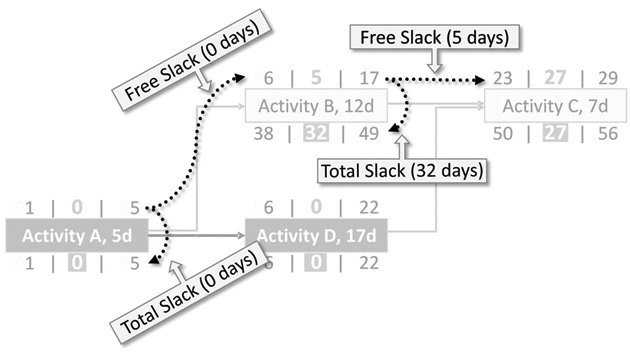
Figure 5-14 Free slack and total slack in a sample diagram.
The approach makes it easy to identify the critical workflow in the diagram, commonly called the critical path: the work stream with total slacks = 0, or in other words, identical forward pass and backward pass dates. This is appropriate for projects that should be finished as soon as possible, or have as much time as needed to get all the work done. How many projects enjoy such luxury?
In the informal survey as of September 2015 that is discussed in Chapter 3, 23.7% of the respondents responded that this is their reality. Over 75% said that they have to perform their project against one or more deadlines. This is reflected in Figure 5-15, in which the backward calculation begins at a time constraint, a deadline.
With this form of backward pass calculation, the total slack on the critical path is not zero. Instead, the critical path now is the flow of activities with the least total slack. This version has the benefit that it shows us for what time we need to book resources. If Jill is expected to do Activity D for us, she will not be able to start before the morning of the sixth day, and if she will not be able to start until the morning of the 16th day, we will miss the deadline (presuming, of course, that the estimates for activity durations and for workflow dependencies are correct). Problems with the timeliness of work become visible weeks, often months at a time, when there are still many options for decision making, and when these options are still relative inexpensive. Using network diagramming, we powerfully skew the learning curve as Chapter 2 describes. Our ability to meet deadlines increases while project costs are likely to decrease.

Figure 5-15 The same simple network diagram with the backward pass (bottom numbers) calculated from a deadline.
When network diagramming was invented, the alternatives were to use PDM or MDM for manual use on walls or blackboards or the much simpler methods CPM and PERT that were developed for use with mainframe computers that needed extensive programming and data entry. Today, this all has been simplified by using software programs, which range from free and simple solutions with limited functionality, to standard programs at moderate costs, to highly sophisticated solutions that support complex simulations and cost a five-digit dollar amount. The offerings are numerous, and in addition, one can chose between desktop programs or Software as a Service (SaaS) solutions provided over the Internet. Figure 5-16 shows the example modeled in software. The days are now not counted as workdays but as elapsed time, which allows the ability to plan for holidays and other restrictions of availability and does not force us to plan with full days.
The early information available enables the project manager to book resources and contractors and at periods that are compatible with imposed deadlines. This allows the project manager to increase the chance to deliver on time, which, in my survey, was necessary for the vast majority of projects.
The previous discussion describes the basics of network diagramming. There are many more things to learn on this method, such as the different types of dependencies, the leveling of plans to account for limited resources, or the expansion of the CPM to become Critical Chain, which does activities as late as possible, adding time buffers to avoid finishing them too late. However, this information is beyond the scope of this book, and there is a great amount of literature available for those who wish to learn more.
Network diagramming as a tool for predictive project management has many benefits. It allows for long-term predictions and gives indications when internal resources need to be booked and contracts for external resources need to be closed and when they need to be made available by the contractor. Planning the flow of work visualizes dependencies among activities whose ignorance can otherwise lead to massive amounts of rework and to quality and security problems. In addition, operational disruptions can be agreed upon and planned, which benefits affected functional managers. In production, for example, Line A, whose products are used as inputs in Line B, must be closed for some weeks. Timely planning enables you to develop some stocks such that Line B does not run out of inputs. This approach enables the organization to go on with its production, rather than resulting in the production stop of Line A causing a production stop for Line B, and possibly many others too.

Figure 5-16 The same network diagram drawn with software. The earliest dates are shown as black bars, the latest dates calculated from the deadline are grey.
Problems with predictive approaches can occur when deviations take place. For example, an activity takes much longer than planned, and the booking times and deliveries ordered need to be rescheduled. Even more difficult to manage are change requests, which may necessitate adding further activities or changing the order of existing ones. The hardest problem is often when stakeholders cannot describe their requirements, which makes it impossible to define the project scope and develop activities against it. Another problem can be surprises, which let the team experience the power of the unpredictable.
5.10 Situational Project Scheduling
Modern Rome is the capital of Italy, a city with a population of 2.6 million. Chicago in the USA is comparable in size (2.7 million), and so is Osaka in Japan (2.67 million). Chicago has an urban rapid transit system with eight lines operating over a network with a total length of 165 km (103 miles). Osaka has a combination of publicly and privately held transit networks with a total of 70 lines. One of these networks is the Osaka Municipal Subway, which has nine lines and a system length of 138 km (86 miles). Rome’s Metro, in comparison, is small: three lines serve a network of 60 km (37 miles). It is not yet even a network because the newest line is still under construction and is not even connected with the other two lines*.
Projects to build urban rapid transit systems under thriving city operations is a difficult task in all cities around the world, but Rome has the special difficulty of the ancient history that lies buried under the modern town. When the tunnel cutters under the city find ancient buildings or catacombs, they have to stop their work, possibly for months, to allow archaeologists to rescue as much as possible from inside the rooms before the project can continue. Rome’s tunneling engineers made a decision at one point to go deeper, under the level of the ancient city, but they have to build access ways to stations and venting systems that connect the subway with the surface and need to dig through the ancient levels.
The modern Roman construction engineers must follow a mixed approach. The dynamics of success and failure dictate for them that they do long-term predictions and plans to have resources available when they are needed, but they must also be prepared for changing the plan when the need emerges. They have to balance their path between predictive and Agile and must be prepared to quickly react to changing environments, moving their practices at times more to the predictive or at others to the Agile side, depending on the needs and the opportunities of the situation. They plan ahead as far into the future as they safely can do, and they have a less detailed plan for a longer term, which will be refined when things go as planned or will be re-planned if they do not. This is probably the situation that most project managers find themselves in, according to 58% of the respondents in my ad hoc survey in 2012, and the rolling wave approach is definitively an appropriate one, never a perfect solution but allowing to make the best from ever-changing conditions under which the project must be performed.

Figure 5-17 SitPM is open to lean more to a predictive or Agile approach, depending on the needs and opportunities of a situation.
We have to also take care of contracting. Bonus/malus clauses using penalties, liquidated damages, or incentive fees rarely make allowances for adaptiveness, and with every change that is decided upon, the effect on contracts should be considered. We also have to take care of the people involved, since too many changes in a short time may unsettle and frustrate those among them who expect projects to be steady and predictable. Another benefit when using a rolling wave approach, also known as progressive elaboration or iterative incremental, is that it leaves no room for ideology. Located in the middle between predictive and Agile approach (see Figure 5-17), the project manager and the team can at times lean more to the Agile side, at others more to the predictive—a pragmatic flexibility that dogmatic Agilists and Predictionists rarely have. It may also be appropriate that parallel work streams are performed with different planning horizons, levels of granularity in planning and tracking, and different degrees of openness for changes.
Using this open approach, both Agile and predictive planning can be situational tools.
5.11 Staged Response Diagram (SRD)
Here is one more tool that I have used for some time and seen implemented in projects with very positive results. I called it Staged Response Diagram, or SRD. It is a combination of two methods:
Meilenstein-Trendanalyse, Milestone Trend Analysis (MTA), a popular tool in German project management.
Limit definition, which is popular in international quality management.
Picture a situation in which a flow of activities has to end with a milestone, which is linked to the delivery of software, a machine, or any other product. The deadline for the delivery is June 30, 2016. To protect the deadline, the project manager defined two more dates as limits:
A Control Limit on June 10, 2016, 20 days before the deadline. If the projected delivery date is forecast to be later than this date, corrective action will be considered to accelerate the project.
A Warning Limit on May 31, 2016, 30 days before the deadline. As long as the delivery date is projected for a date earlier than this limit, the team remains relaxed and focused just on its work. If the limit is exceeded, attention is increased: The frequency of reports and meetings may increase, inexpensive measuring equipment is replaced with more accurate and more costly items, the project manager tries to get routine work delegated to have more time for the project, and so on.
Another prerequisite is the use of network diagramming to replace guesses with valid projections based on estimates and actuals. Software can help by accelerating and easing the calculation and drawing process. The project manager then puts the data in a diagram as shown in Figure 5-18 to observe the behavior of the diagram against the deadline and the limits. The X-axis in the diagram represents the dates when the projections are made. The Y-axis is used for the projected delivery date. The SRD tool raises awareness and triggers actions when this is appropriate and documents also when this has happened and why.

Figure 5-18 An SRD with limits that influence the behavior of the project manager and the team to ensure timely delivery.
The core benefit of this tool is that it endorses situational behavior and documents a learning process over time.
I am often asked by students how frequently a team should have meetings, and how much time the team should spend on them. A similar question relates to the frequency and level of detail for reports. I do not have a universal answer to these questions. Too much time spent in meetings and writing reports will inevitably disrupt the development process. Not enough time may lead to developing the wrong things, and it may become too late for the project manager and the team to become aware of this problem. Then, options for reaction will be scarce and expensive, which we already know as the common effect of late responses. Communication and attention are generally expensive. Corrective actions are also not free and should be reserved for the times when they are needed. The multi-step approach in the diagram makes sure the attention to the project matches its risk exposure, which grows with the proximity of the projected delivery date and the deadline, and corrective action is not applied out of nervousness at the wrong time, but also not missed, when it is due. The same tool can of course be used for cost predictions against budgets and funding limitations, for workloads, times of operational disruption, and other aspects, where project managers must adhere to constraints.
5.12 The Stakeholder Attitudes Influence Chart
Stakeholder management has been described in various sections above. With its various elements, including stakeholder identification, analysis, expectations setting, and engagement, it is a difficult task which requires skills for which most project managers have not had much if any training, at least not in a formal sense. It is a key task for projects that have a strong impact on people, groups, communities, and organizations, intending to reduce resistance and strengthen support and engagement. It is also deeply situational, as different people, groups, business units, organizations, and so on may have different requirements on the project, and these requirements are likely to change over the course of the project.

Figure 5-19 SAIC (Stakeholder Attitudes Influence Chart). Numbers represent relative prioritization of the stakeholders.
Stakeholder management can put a high demand on the project regarding time and cost. This raises the need for prioritization, which the Stakeholder Attitudes Influence Chart (SAIC) can support. The SAIC helps manage and prioritize stakeholder-related activities. In the example in Figure 5-19, the project team members have been given the highest priority (lowest number) and the contractors have lowest priority.
5.13 Turturism, Private Settings, and Leadership
Michael Ende is the author of children’s books, mostly known for the novel Never-Ending Story, which became the basis for a sequel of three movies between 1984 and 1994. Internationally less well-known are his novel Jim Button and Luke the Engine Driver. In this story, Michael Ende portrays a strange Mr. Turtur, a virtual giant, who looks frighteningly huge from a distance, but instead of getting even taller when one approaches him, he paradoxically shrinks, and once one is next to him, he attains the perfectly normal size of an average person. Mr. Turtur spends a lonely life, because people are afraid and stay away from him, while he is actually a friendly and helpful person.
In project management, we often have to deal with virtual giants, persons who seem to be strong, powerful, and frightening from a distance but appear just as normal humans in close proximity. They mandate projects as tough sponsors or build up resistance as opposing stakeholders who reject the impact of the project on their interests. Turturism may seem an illogical effect, but it is often present in project management.
On the other hand, the most vicious source of pressure can often be relaxed when we overcome the official interpersonal, organizational, and physical distance and meet in a more comfortable and private setting. Outside the formal business environment of the office, in the meeting rooms and coffee zones inside the corporation, it may be easier for both the project manager and the virtual giant to overcome deadlocks and conflicts of interests and develop mutual empathy. It may sound surprising, but suggesting an appointment with a difficult key stakeholder in a non-business location is a tool for situational project management, as it helps both parties identify commonalities and joint interests. One should know what kind of private settings this Mr. or Ms. Turtur prefers and where he or she would feel most comfortable while reducing to normal human size. It could be a golf or tennis match, an invitation to a football or baseball game, or simply a dinner. Critical decisions are often better made in such a private setting or shortly afterward, when the feeling of commonality and empathy is still alive. It may be a good idea to reserve a small part of the project budget for such events, small enough to avoid the impression of corruption, but sufficient to overcome the distance that makes virtual giants seem taller than they are.
There is a tight connection between empathy and leadership, which is often overlooked. Managers often believe that taking an authoritarian and tough position toward people is a sign of strength and leadership, overlooking the fact that a good leader often better steps to the side, sensing when a qualified team is happy to resolve all problems and attain the critical objectives of the managed organization as long as no one stands in their way, obstructing them and causing frustration.
In the next chapter, I will discuss a view on leadership that is different from the top-down understanding of leadership that some people consider outdated, but that is still common among managers.
* (Lewin & Weiss, 1997).
* This is similar to project management, in which many methods and tools that we know today were originally workarounds of problems with other methods and tools.
† A brief description of Jidoka and many other elements of the TPS can be found on the website of the car manufacturer (Toyota, 2015).
‡ (Johnson, 2010).
* A term probably coined by Tom Peters (Peters, 1999).
* A Gaussian term, not to be confused with the word variance used to describe the difference between plan data and reality.
* It would of course be interesting to know the name of the company, but I am under nondisclosure agreement (NDA). And to respond to a hygiene concern that I sometimes hear when I talk about this observation, the tooth brushes are individually wrapped.
* (Wysocki, 2014a, p. 34).
* I call it the “tailor rule”, because I learned it from Dave, my tailor. I am aware that he did not invent it, but he sticks to it.
* (von Gerkan, 2013).
† (Hammer, 2015).
‡ As mentioned in Chapter 3.
* (Dawson & Hayashi, 2011).
† (Acton & Hibbs, 2012).
* (Barnes, 2011).
* To keep the example simple, days means working days, a week has five days, and we ignore holidays.
* Mostly used for schedule reserves.
† (Wysocki, 2014a, p. 158).
* (Sutherland, 2011).
† (Beck, K. et al., 2001).
‡ “Yes, anarchy is order, as government is civil war” (own translation).
§ In 2007, I had the opportunity to contribute to a German textbook called Agiles Projektmanagement by Bernd Österreich and Christian Weiss, with Uwe Vigenshow as another contributor. While my contribution was rather small, I attended the peer review process that the editors conducted with other experts on the matter, and I was stunned to observe a degree of zeal and fanaticism on details. I would rather expect it from competing political or religious groups but not from people in a business environment.
* (Weaver, 2012).
* Sometimes called “float” or “play”.
* In October 2015.