10
MEETING CHALLENGES
ALONG THE WAY
IN 2006, COO Shawn Ket brought a new focus on analytics to Credit-Corp, a Sydney, Australia–based company specializing in acquiring and managing consumer debt. The company has grown rapidly, with revenue increasing at least 60 percent per year between 2003 and 2008. He established an analytics group that utilizes the largest distressed debt database in Australia for pricing, customer acquisition, and identification of potential customers in a positive financial turnaround. The group also analyzes workflows in debt management operations and handles many ad hoc inquiries for analytics from around the company. Jolie Baasch, the group’s head, describes the company’s rapid transition toward analytics: “Six to eight months ago it seemed that all decisions were made on intuition—now all are being made on analytics.” 1 However, that fast increase in demand created far more work than Baasch’s eight-person group could handle. What to do next?
Trying to build up capability to meet exploding demand when analytical talent is scarce is one of four challenges and transition points we discuss in this chapter:
• Building initial momentum for analytical initiatives.
• Organizing to manage analytics when senior management gets serious.
• Expanding capacity when analytics takes off.
• Driving to become an analytical enterprise.
In part 1 (and the appendix) we discuss building the capabilities to put important analytical applications in place. In this chapter, however, we look at the journey from more of a supply-and-demand perspective. How do you build the business appetite for analytics, satisfy that appetite, and encourage a healthy analytical diet across the enterprise?
Gaining Momentum for Analytics
Learning to improve business performance through analytics is not a precise science—ironically, it’s not yet very analytical. You’ve got to find the formula that unlocks interest in your organization. You have to figure out what motivates leaders and understand the formula that creates interest in applying analytics to business problems and opportunities. In addition to being DELTA-ready, you need to find the ways to build momentum. Here are three common scenarios:
• A well-defined business problem, performance shortfall, or explicit improvement opportunity lends itself to analytics. The target may be clear, but management motivation may not be high enough if the problem is owned by functional managers. You may need to elevate sponsorship, especially if the analytical solution will be cross-functional. So focus on leadership and be otherwise DELTA-ready when you get the go-ahead.
• A key executive recognizes that the business is neglecting a hoard of potentially valuable data associated with a business process (e.g., point-of-sale data, claims history, employee experience). In this scenario, uncover the data’s specific potential for process improvement and get someone in top management to recognize the business value of exploiting it. Make sure that the data is truly ready and that you have a specific target, not a vague charter.
• Top management recognizes that a strategic business opportunity, one that’s important to business performance and growth, depends on analytics. Often just an intuition, this realization may seem like the ideal scenario for generating momentum; however, any delay may frustrate management’s expectations and have the opposite effect. Delay is common when the opportunity needs further definition and qualification and other DELTA elements (especially data and analysts) are not ready. Be realistic about your readiness, skilled at managing the expectations of senior management, and ambitious to succeed.
Note that all three scenarios center on specific applications and targets, not on encouraging the organization at large to work more analytically. That comes later. Even if your CEO or COO is a real “data dog,” pushing for more analytical management across the corporation, you’ll still need to build momentum one application and one decision at a time. The key player is the executive responsible for the business problem or opportunity being addressed. Also note that you’ll likely have to build momentum in different parts of the business at different times and in different ways, so this isn’t a once-and-done exercise.
Table 10-1 summarizes these three scenarios. Yours will be different, but it may well be a variation on one of these. The key lesson here is to look not only at your DELTA readiness, but also at how analytics can and should play out in your business.
TABLE 10-1
Gaining momentum for analytics
| Scenario | Situation | Who cares? |
| We have a problem or improvement opportunity. |
• Need to raise performance, perhaps in response to a competitor |
Mid to upper functional management, making targeting easier than investing |
| • Need to lower cost, improve asset utilization, or change cost structure |
||
| • Need to increase innovation or accelerate time to market |
||
| We have a data hoard. | • Have an accumulation of potentially useful data that has yet to be explored and exploited |
Who recognizes the potential? CIOs are often early sponsors; helps if top management includes some “data dogs” |
| • Ideally use in combination with other assets—analysts and technology |
||
| We have a strategic opportunity. |
• Determined to compete on a different basis, to solve a problem nobody else has mastered, to be the best at something important |
Top management, which puts the pressure on, especially if the assets aren’t ready |
| • Determined to invest to seize the opportunity |
Organizing to Manage Analytics
When top management begins to get serious about analytics and adopt an enterprise perspective on resources and applications priorities, it’s time to conduct a formal assessment of your analytical capabilities, create a management structure to guide analytical initiatives, and develop a business strategy for analytics. The DELTA model provides a means for thorough assessment of your analytical capabilities. But how to organize and develop strategy is very company-specific. Health-care insurer Humana provides a good example of how to proceed.
Since 2001, Humana has grown from a regional health care payer to one of the country’s largest health insurers, providing health plans and prescription drugs to more than 18 million members. Meanwhile, changing market conditions have been shifting the entire industry toward a more analytical management style. Evidence-based medicine promised a statistically based approach to more cost-effective treatments and better health for patients. Informatics (health care jargon for data-based analytics) was becoming central to Humana’s ability to serve its customers and manage costs. 2
As an early adopter of an enterprise data warehouse, Humana faced several common pitfalls, such as weak integration between business and IT objectives and inadequate policies regarding the governance of enterprise data. In addition, various functional silos of analytics were making it difficult both to leverage data and to maintain and upgrade the enterprise data warehouse.
Jim Murray, Humana’s COO, emphasized the importance of taking an enterprisewide approach to analytics that would “eliminate silos of analytics and facilitate the flow of trusted, consistent and accurate information to all of Humana.” 3 Toward that end, Humana established a new position to lead analytics—vice president, Humana Integrated Informatics—and recruited Lisa Tourville, an experienced actuarial consultant, for this crucial role.
Recognizing the importance of top management leadership, Tourville assembled a team of business and IT leaders to develop Humana’s analytical strategy, which went under the name “business intelligence and informatics.” The steering committee included Jim Murray; Jim Bloem, chief financial officer; Steve McCulley, Humana’s corporate controller; Brian LeClaire, chief technology officer; and Bruce Goodman, chief service and information officer. The team’s business objectives were significant: to assess the company’s readiness for an analytical transformation throughout Humana’s organization, processes, and systems; to develop an industry-leading analytical strategy; to connect analytics to the company’s business strategy; and improve the return on current analytical investments.
With sponsorship from the executive suite, the team concluded that Humana needed to build an analytical “competency center” in order to integrate decentralized business units with the corporate team that builds and maintains the data warehouse. This center would also perform the critical role of champion of business intelligence and analytics for Humana. A steering committee would oversee the center in order to ensure that its work stayed aligned with Humana’s strategic objectives.
Tourville and the team then devised a road map for Humana that included priorities to expand analytical capabilities and build the foundation for a more analytical enterprise. First, the team assessed the data and the enterprise IT capabilities needed to support analytical activities, and in the process helped the businesses to become better at articulating business requirements for new data sources and analytics. Second, it helped Humana take an enterprisewide approach to prioritizing its investments (human, technical, and operational) in analytics. Third, it identified industry-specific opportunities to apply analytics in high-value ways. Fourth, it made sure executives recognized the importance of their roles as leaders of analytical initiatives and role models for an analytical mind-set. Finally, the team developed recommendations for identifying, developing, and rewarding analytical talent.
From this assessment and plan, Humana gained a deep understanding of the human performance and the technological and operational challenges underpinning the company’s expanding use of analytics. As a more analytical organization, Humana is now better equipped to facilitate profitable growth, to develop and manage cutting-edge products and services, to build trusted relationships, and to educate member communities on how to improve their physical and economic health.
When Demand Exceeds Supply
Let’s return to the case of CreditCorp. We left them in the common predicament of finding that demand for analytics has suddenly outstripped the capacity of the analyst group to provide services. In analytical companies, this increased demand comes in waves when different parts of the business get excited about the potential of analytics. It’s difficult to be 100 percent prepared to ramp up because demand can grow very quickly, and few corporations (especially in recessionary times) will invest in overbuilding analytical capacity in advance of that demand. So you need to anticipate by having resources (starting with data) as ready as possible, preparing to act when the time comes, and knowing that no single action is going to do the trick.
At CreditCorp, Jolie Baasch and her analysts deal with increasing demand through multiple approaches. Analysts try to encourage frontline staff to do the analytics themselves (to the degree possible) through education programs and distribution of the information necessary to make analytical decisions. In some cases, the analysts can identify the business drivers, and then the users of the application can monitor them and see how they change over time. They also build reusable production applications—not “one-offs.” But the biggest lever in managing demand and prioritizing efforts is clarity about the strategic issues of the business. Baasch holds regular discussions with the COO and the head of business services to keep current on what’s important to Credit-Corp. Before undertaking a project, the analysts determine how long it will take to solve the problem and discuss priorities and time frames with the customer.
Imbalance of supply and demand may seem to arise quickly, but beneath the surface it is driven by a combination of factors over time:
• Analysts, especially those we’ve termed “analytical pros,” may be in short supply—difficult to find, recruit, and retain.
• Demand can grow rapidly once a business gets a taste of analytics and notable applications succeed. Sometimes the demand is pent up awaiting better data, then unleashed in a torrent as the data becomes available (as at CreditCorp).
• Supply can be wasted on the wrong things, so business opportunities for analytics are missed. This happens when opportunities and priorities are not clear, when analysts work in local silos and can’t collaborate on strategic enterprise initiatives, and when analysts spend too much time generating reports (work that analytical amateurs should be able to do for themselves) rather than building and maintaining models.
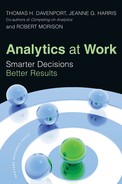
What do you do when supply exceeds demand? No, college undergrads in Intro to Economics classes, the answer is not “lower prices.” As CreditCorp shows, it takes a set of actions to increase supply and, ideally, to keep building it in concert with demand. Figure 10-1 depicts the situation where total demand for analytics is larger than available supply, and only part of the demand is of high business value. The numbered arrows represent three sets of possible tactics for bringing supply and demand into better alignment: increasing the supply of analysts, managing the level of demand, and increasing the quality of demand.
To increase the supply of analysts and analytics services, an enterprise can:
• Hire more analysts (though competition for the best may be fierce).
• Outsource selected analytics projects and services.
• Improve the work methods of analysts to increase their productivity, usually with an emphasis on reuse of templates and models.
• Improve the data and technology infrastructure for analytics so that all projects can be delivered more productively.
• Partner with like-minded business improvement groups, such as Six Sigma or business process reengineering, that are working analytically and cross-functionally, as a means of expanding capability and focusing on high-value enterprise projects.
FIGURE 10-1
Aligning supply and demand
Demand management is an important activity in any services organization. We don’t want to stifle the business’s appetite for analytics, but we do want to mitigate that portion of demand that must be filled by the analyst group, especially when there are alternative ways of meeting it. To manage demand, an enterprise can:
• Train more analytical amateurs to meet their own needs for straightforward analyses and reports.
• Improve the evaluation and prioritization of projects, preferably with an enterprise perspective and perhaps through a program management office, to reduce low-value demand.
• Negotiate and plan demand levels with customer management as part of the process of educating them on how best to make use of analytics.
• Negotiate with customer management about “information sufficiency”—how complete and accurate the data really needs to be for analytics to be useful.
To increase the quality of demand, an organization can:
• Educate customer executives and the corporate leadership team on how to maximize the business value of analytics, including the roles of smart demand and capable supply.
• Perform strategic, enterprisewide evaluation and prioritization of analytics projects.
• Apply portfolio management to the set of analytics projects, continuously evaluating the progress and value of individual projects and the overall mix.
• Consult regularly with customer management on the quality of their demand for analytics and the business value that they are generating.
• Suggest to customer management opportunities for high-value application of analytics.
Like CreditCorp, many companies we studied employ combinations of these tactics. The right approach depends on the analytical experience and orientation of the corporation and its business units, as well as constraints like funding. But especially as a business unit is becoming familiar with business analytics, the leaders of analyst organizations must educate and shape business demand so that analysts are free to work on the most strategic and value-adding business applications. Here are three examples.
A hospitality company was analytically sophisticated in its customer/revenue operations. Other business functions began noticing and increasing their demand for analytics. Already stretched thin, analysts were dispersed across the company. The company responded with three main thrusts: invest in enterprise data and infrastructure for analytics to provide a better platform for the growing portfolio of applications, develop “template models” for rapid reuse in similar applications, and establish informal centers of expertise for experience-sharing among analysts working in major business areas.
An energy company had gotten ahead of the competition in important areas like customer service and wanted to leverage analytics to maintain its lead, but too much of its analyst capacity was devoted to predictable and time-consuming analyses for rate cases and regulatory requirements. The leaders of the analyst group partnered with the VP of corporate strategy to make competitive applications a priority. They divided the project portfolio into categories—major/competitive, regulatory/ongoing, and ad hoc—and focused on managing the level of each in the overall mix. They also consulted more actively with their business counterparts on information sufficiency and negotiated major project attributes (functionality, timing, cost), not all of which could be maximized.
A consumer goods company’s success with analytics in supply chain applications, coupled with a new corporate focus on profitability analysis, led to fast-growing demand for information and analytics across the enterprise. Analysts were already spending too much of their time generating reports rather than building models—and the demand for reports was relentless. The response was to empower and equip the growing number of analytical amateurs by rapidly deploying data warehouses and automating common analyses and report formats. The analyst groups also partnered with Six Sigma and other groups to give analysts more opportunity to work on high-priority and high-value business projects.
Driving to Become an Analytical Enterprise
Best Buy, the Fortune 100 consumer electronics retailer, has made analytics a critical component of how it works and competes ever since 1997, when it embarked on a two-year “scientific retailing” initiative that led to a major financial turnaround. In 2004, when former CEO Brad Anderson began to emphasize “customer centricity” as a means of maintaining the company’s growth trajectory, managers felt that it was time for a review of the role of analytics in the company. By 2006, Anderson and other top executives were convinced that the key to the company’s future lay in building an enterprisewide analytical capability. Their motivation was to drive data and decision making to individual stores, where employees are closest to their customers.
At the corporate level, customer segmentation and data warehousing quickly became a priority. Though quality data about customers was available and customer behaviors were documented, they were often not well understood. More importantly, they were not being used systematically to make fact-based decisions, especially at the store level. As Shari Ballard, Best Buy’s executive vice president of channels, explains:
We needed to make sure that the district, territory, and store teams have the tools that they need to actually look at things like: what kind of traffic do they have coming in their stores today, how effectively are they selling to the people that are in the stores today, what do their close rates look like, what does their customer sat[isfaction] information look like, what segments do they have coming in, what kind of market share do they have for those segments? We have invested in the right tools so that the field knows what to focus and can identify what indicators to move a little bit that will help us a lot.” 4
So Best Buy assembled a team of business and technology professionals to launch an initiative that would redefine how the company deploys, uses, and integrates analytics for better decision making and business outcomes. The project leader was Marc Gordon, vice president of Financial Planning and Analysis—an area with both the analytical capability and the visibility needed to make the project effective.
The team’s goals were encapsulated in what became an organizational mantra: “Think differently, act differently, drive different outcomes.” The team started by identifying and defining the metrics to build an enterprise performance management capability—basically a framework for organizing and analyzing business processes, metrics, and systems to identify ways to optimize performance. Ultimately, the capability would give stores and functional groups access to actionable insights about their customers for the first time and enable them to integrate fact-based decisions into their daily business routines. It would also create a new, enterprisewide culture of analytics, disseminating and revitalizing the headquarters’ analytical focus.
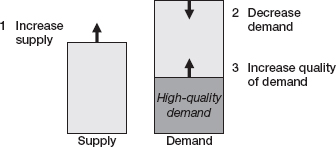
The team’s next challenge was to work with representatives from each functional area to define metrics. Eschewing conventional approaches, the team defined metrics in a way that best reflected Best Buy’s commitment to customer centricity, using three key fact-based questions: What happened? Why did it happen? What should happen?
Armed with an understanding of the most valuable metrics, the team has started to embed them in a closed-loop process (see figure 10-2) that would build and test new analytical capabilities and integrate them throughout the organization. Best Buy recognizes that this process will take some time to mature.
FIGURE 10-2
Best Buy’s closed-loop analytics model
Though functional groups had been collecting and reporting data for some time, analytics were not trusted enterprisewide, and employees were hesitant to embrace a new lexicon for metrics, let alone use new analytical ways to make business decisions. The challenge of reaching an accord often prolonged the integration process but ultimately encouraged the introduction of an analytical culture across functional areas and in the stores.
To spur on analytical success, the team deployed an innovative scorecard and reporting tool to give business operators across the organization access to new data and customer insights that would fuel analytical decisions. They also established a training program to teach the sales force how to identify and serve different types of customers and how to interpret and act on the daily data they began to receive.
The analytical organization was the next focus. Realizing that store managers would require help with advanced or specialized analysis, the team created the Reporting and Analytics Support Capability (RASC), a centralized group responsible for maintaining the consistency of Best Buy’s analytical capability by providing critical information about performance to business operators from the store level to the corporate level. It also gave store managers someone to call at corporate headquarters to help them analyze and influence customer behavior.
For example, the RASC group worked with one district to help them grow market penetration among older Americans, especially empty nesters. They found that most empty nester purchases were items like appliances or DVDs that did not require technology knowledge. RASC analyzed the reasons behind lower than predicted technology purchases and assessed possible actions to increase sales. Based on these insights, the district general manager teamed with AARP to provide technology education classes at the local library, resulting in a significant increase in technology sales among empty nesters.
At about the same time, Best Buy created central organizational groups within functional areas for marketing, supply chain, and human resource analytics. As operations across the enterprise embraced their new analytical capabilities, success stories began to emerge. Store managers began to use data-driven insights to review business practices and to seize new opportunities. On one earnings call, Shari Ballard called attention to two specific general managers who had used analytics to develop initiatives for underserved customers in their areas. These positive acknowledgments from the top further reinforced the value of fact-based decision making.
Feedback from the stores to the executive suite has been extremely positive. Best Buy continues to embrace analytical capabilities and talent as crucial to its business. And former CEO Brad Anderson sees customer-focused analytics as a bright spot in an otherwise challenging market: “While we see the [economic] climate as serious and very difficult, we have an enormous amount of confidence in the skills and talent of the people we’ve got and the approach of finding customer-centric value propositions to influence our results.” 5
Best Buy is committed to becoming a more and more analytical enterprise. You can see from their story that a lot depends on leadership and on rallying around an analytically enabled business focus of paramount importance. You see the company building all five of the DELTA elements—data, enterprise, leadership, targets, and analysts. You also see executives taking the actions we describe in part 2—reviewing their business methods and use of analytics, embedding analytics into both performance management and store-level decision making, and fostering an analytical culture across the enterprise. If your organization decides to take analytics to the next level and become a thoroughly analytical enterprise, your road may be quite different from Best Buy’s. But your success factors, and the signposts and challenges along the road, will be similar.