5
TARGETS
Picking Your Spots for Analytics
EVERY BUSINESS WE KNOW can benefit from becoming more analytical across the board—in how it understands its customers, performs its operations, and makes its decisions. But even the most analytically oriented company needs to target its analytical efforts where they will do the most good, because resources, especially talent, are always constrained. And all business opportunities aren’t created equal—few confer breakthroughs in performance or differentiation in the marketplace.
Of course, for companies just embarking on the analytical journey, a specific business problem may be a good initial target. Perhaps customers are complaining about service or quality, or performance benchmarks show that a business process is wasting resources, or a competitor has raised the bar and you need analytics to determine and execute a response. At Princess Cruises in 2000, for example, the initial target was revenue management. The CEO knew that other travel-oriented industries were doing this aggressively, but Princess’s capability was only rudimentary, and it was easy to spot the lost revenue opportunity in every empty cabin as a ship left port. 1
As analytical experience and success grow, targets become broader and more strategic: to optimize key business processes over time, and to innovate and operate in ways that differentiate the business in the eyes and experience of its customers. By stage 3, if they haven’t done so earlier, companies should be targeting their analytical investments at their distinctive capabilities. These are the capabilities and integrated business processes that serve customers in ways that are differentiated from competitors and that create an organization’s formula for business success and therefore offer the richest targets. 2 Princess, for example, began to focus on the analytical opportunities inherent in customer relationships—database marketing and targeted customer promotions.
A good target is so important to the business, so full of opportunity, that it engages top management commitment and creates momentum. It focuses on generating insight rather than merely information. And it is both ambitious and approachable—ambitious in that it impacts the business, and approachable in that it has access to the resources and capabilities to succeed. For example, Sir Terry Leahy (if you do well with analytics, perhaps you, too, can become a British knight), the CEO of the Europe-based grocery retailer Tesco, says that the mission of the company is to earn and grow the lifetime loyalty of its customers. Their core aim, he says, is “to understand customers better than anyone.” Having more information about customers is one side of the Tesco story, but Leahy notes that information benefits customers as well: “[Access to information] helps retailers know much more about what their customers want and think. But it also gives customers a very powerful tool. They can compare prices and buy online at the click of a mouse. They can look at a retailer’s ethical or environmental policies and find out what is being said about them anywhere in the world.” 3 Tesco’s visionary target is world-class customer knowledge.
In this chapter, we discuss two basic targeting activities: finding your opportunities and setting your ambition. We offer some tools and techniques for doing each thoroughly and well. We introduced one in chapter 1—the analytical questions matrix in figure 1-1 can help you inventory and assess your analytical coverage in a business domain. Another, the “ladder” of analytics applications, can help you adjust your analytical ambition. Using supply chain and marketing processes as examples, we demonstrate how one, or perhaps both, tools should fit your organization’s style. Finally, we review how targets and the process of setting them change as a company moves along the five stages of analytical progress.
Finding Your Opportunities
Some organizations are content to take their opportunities wherever they find them. Their efforts (figure 5-1 illustrates one such effort), are often misplaced. We encourage you to be much more purposeful.
Alex tackles a business problem

Source: Reproduced by permission of Charles Peattie and Russell Taylor, www.alexcartoon.com.
The organization’s strategic plan, which is all about finding opportunities for business growth, innovation, differentiation, and marketplace impact, seems like a logical place to look for target opportunities. But you may not find what you’re looking for when you pull a page from the strategic planning binder. (Okay, it’s probably a PowerPoint file or a PDF by now.) It may indicate what business domain—customer service, product customization, emerging market—is important, but not what activities in that domain to target with analytics. Until the strategy formulation process incorporates an appreciation of analytics and gets specific about analytical targets (a time well beyond retirement for most of us), you may need to look in other places to discover analytical opportunities.
Most businesses also start looking for new ideas and practices by surveying what’s happening elsewhere in their industries. What business and industry trends suggest the need or opportunity to change? Table 5-1 lists some of the most common applications of analytics that you’re likely to find. Look across your industry—and scrutinize the activities of your competitors—on a regular basis. It keeps you alert and informed about what you must do to keep pace not only with the competition, but also with changing and rising customer expectations.
Common analytical applications
| Industry | Analytical applications |
| Financial services | Credit scoring, fraud detection, pricing, program trading, claims analysis, underwriting, customer profitability |
| Retail | Promotions, replenishment, shelf management, demand forecasting, inventory replenishment, price and merchandizing optimization |
| Manufacturing | Supply chain optimization, demand forecasting, inventory replenishment, warranty analysis, product customization, new product development |
| Transportation | Scheduling, routing, yield management |
| Health care | Drug interaction, preliminary diagnosis, disease management |
| Hospitality | Pricing, customer loyalty, yield management |
| Energy | Trading, supply, demand forecasting, compliance |
| Communications | Price plan optimization, customer retention, demand forecasting, capacity planning, network optimization, customer profitability |
| Services | Call center staffing, service/profit chain |
| Government | Fraud detection, case management, crime prevention, revenue optimization |
| Online | Web metrics, site design, recommendations to customers |
| Every business | Performance management |
Now that we’ve gotten you excited about this great chart, we must note that looking within your own industry will only take you so far. In fact, it can be very limiting. Your industry will tell you what it takes to maintain parity of performance, but you must be more creative to discover opportunities for differentiation. Following your industry means running with the pack, not getting out ahead. Stage 5 companies—Wal-Mart, Progressive Insurance, Marriott, Harrah’s—all strive to be first to market with analytical capabilities, not just to match their industries.
That’s why we recommend two additional approaches to finding analytical opportunities. Both are fundamental to understanding your business and its performance drivers, and should be exercised regularly:
• Big-picture thinking about the shape of your business and the trends affecting it: demographic shifts, economic trends, and changes in what customers want. This involves assessing where performance can improve and what factors drive performance. It also entails exploring your hunches about the business, what makes it tick, and where the next breakthrough may await.
• Conducting a systematic inventory of your key business processes, the methods for decision making within them, and the business decisions (from making an acquisition to issuing a line of credit) that could benefit from more and better analytics.
Practice Big-Picture Thinking
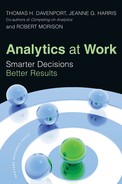
There are a variety of tools for big-picture thinking about your business, its performance drivers, and its opportunities for differentiation. Use the tools that your company is familiar with and that have served it well. (If we were strategy gurus, we’d be lying on the beach in the Caribbean by now.) Most of them decompose your “core processes” in some way to explore how your many activities contribute to the overall results of your business. For example, Harrah’s managers knew they wanted to drive growth through customer loyalty and data-driven marketing operations—the firm’s distinctive capability. They used a “service-profit chain” model to understand and target key decision areas, using clear metrics for each activity (see figure 5-2).
High-potential targets for business analytics vary by industry dynamics and, of course, by how firms add value in the marketplace. Companies that produce physical assets (sometimes called “value chain” firms) may want to focus on problems of supply/demand fluctuations, cost of assets, flexibility of operations, and interfaces with others in the supply chain. Pharmaceutical companies and others whose value is linked to the quality, quantity, and marketability of their intellectual property (“value shops”) should concentrate on analytical experimentation and decision making. Internet businesses (like Facebook or eBay), financial institutions, telecommunications companies, and other “value network”-based firms should examine how analytics can help them increase their customer and service networks. 4
This kind of value-based analysis can serve two important functions. First, it can help you focus on the fundamental objectives of the business and the ways analytics can serve them. A telecommunications company that pursues efficient call center utilization over customer service might save money but shoot itself in the foot by driving customers away. Second, it can suggest places to look outside your industry for fresh examples of analytical applications. When looking across industries for inspiration, your best hunting grounds are likely to be other industries with your value type (e.g., telecom companies learning from financial institutions). These are companies that face analogous business problems but in different contexts, and their analytical applications may be recognizable, relevant, and transferable.
Harrah’s analytical model
Source: James L. Heskett, Thomas O. Jones, Gary W. Loveman, W. Earl Sasser Jr., and Leonard A. Schlesinger, “Putting the Service-Profit Chain to Work,” Harvard Business Review, March-April 1994.
Ironically (given our focus on being analytical), choosing your target for analytics may be based on an intuition. For example:
• Something you’ve always suspected about your industry but have been unable to explore or verify. What are the implicit assumptions behind how industry players operate, and which of these may be obsolete or reversible?
• Something innovative that seems logical and doable, but for which you have no evidence to prove feasible. What business problems or challenges have proven resistant to solution by other means?
• Something that you (or someone influential in the business) passionately believe is important to customers. What needs—or new forms of value—have customers themselves not yet discovered or articulated?
For example, Jim McCann, the founder and CEO of 1-800-Flowers. com, had an intuition that electronic channels were going to be important to customers wishing to order flowers and gifts. His company was the first florist on CompuServe back in 1992 and the first merchant partner of AOL. It launched a stand-alone Web site in 1995—an early Web presence for any retailer. It continues to stress search engine optimization, call center responsiveness, and early adoption of any new technology to get to customers—most recently, Twitter and an iPhone app.
Okay, but what’s the analytical angle? Befitting perhaps the first company with a multichannel name, 1-800-Flowers.com has an integrated customer data warehouse and customer relationship analytics across all its brands and channels. The customer “path to purchase” is coded for all interactions, multivariate testing is done across channels, and a predicted preferred channel exists for each interaction with each customer. It easily tracks, for example, the effectiveness of online versus offline promotions.
Jim McCann has proven the potential effectiveness of the informed hunch to find new opportunities. But when using intuition, follow his brother Chris McCann’s advice—verify it by gathering data and analyzing it, or doing a small-scale test of the idea and expand it only if it seems to be working.
Conduct a Systematic Inventory
If the big-picture frameworks ask how the major pieces of the business fit together, a systematic inventory looks more closely at how business processes are structured and function, how decisions are made within them, and where the opportunities for dramatic improvement may be. A logical place to start: what business processes are under pressure and would benefit the most from performance breakthroughs?
Here is a quick catalog of the kinds of business processes that lend themselves to analytics:
• Data-rich. Analytics unleash the potential of the data you’ve got.
• Information-intensive. Analytics reveal the meaning of data.
• Asset-intensive. Analytics enable effective utilization and sharing of scarce or expensive resources.
• Labor-intensive. Analytics enable decision making and the leverage of expertise, especially where talent supply is short, talent demand is cyclical, and training times are lengthy.
• Dependent on speed and timing. Analytics enable process acceleration and real-time decisions, especially where customer satisfaction or process competitiveness demand superhuman response times (e.g., via the Web).
• Dependent on consistency and control. Analytics enable consistent decisions even in unpredictable cases.
• Dependent on distributed decision making. Analytics enable decision makers to look upstream and downstream to anticipate the effects of their actions.
• Cross-functional or cross-business in scope. Analytics reveal interdependencies and enable the parts to work together better.
• Low average success rate. Processes with a low “batting average” are probably ripe for improvement through analytics.
For example, McKesson Pharmaceutical targeted its complex supply chain. The company has one of the highest-volume distribution networks in the world, routing one-third of the medicines consumed in the U.S. market to more than twenty-five thousand locations a day. With major pharmaceutical manufacturers on the supply side and powerful retailers (including Wal-Mart) on the customer side, McKesson has to operate at high volume and high efficiency. Building on its strong process orientation, the company brought together data from the sales, logistics, purchasing, and finance processes to achieve more integrated analysis and decision support. Now managers throughout the supply chain can look all the way up and downstream to evaluate the operational and financial impact of their decisions regarding delivery schedules, transportation utilization, quantity adjustments, product dating, and drop shipping.
You can also find analytical opportunities by assessing your business decisions (regardless of their association with well-defined business processes) and asking how better information and analysis might yield better results. In general, look for the following six conditions: (1) complex decisions with lots of variables and steps; (2) simple decisions in which consistency is either desirable or required by law (like nondiscriminatory credit and lending); (3) places where you need to optimize the process or activity as a whole (especially when decomposing and optimizing locally cause you to suboptimize the whole); (4) decisions in which you need to understand connections, correlations, and their significance (as in McKesson’s supply chain); (5) places where you need better forecasts, anticipation, or downstream visibility (McKesson again); (6) current low average of success.
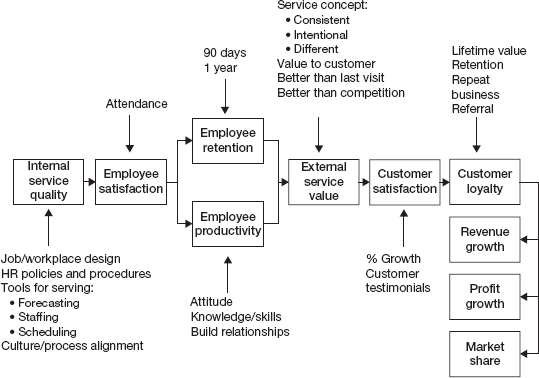
To search for targets systematically, supply chain managers and information management people can take an inventory of supply chain reporting and analytics. This will show where your efforts are concentrated and where you could be doing more. Figure 5-3 illustrates some common examples for supply chain processes using the analytical questions matrix from figure 1-1. In the “information” row, conventional reporting usually centers on things like order fulfillment and asset utilization performance. Can your reports and models focused on the past be augmented to become more predictive? Can your forecasts incorporate more current and external data—and rely less on simple extrapolations from the past?
FIGURE 5-3
Analytical questions: Supply chain examples
Alerts signal when bottlenecks are forming or quality is straying out of range. Extrapolating from historical trends is the first step toward modeling. Extrapolation lets you begin to anticipate future supply and demand. In the “insight” row, modeling reveals the causes of problems, so you may improve process and quality control. Real-time recommendations enable immediate responses: for example, trucks may need to take alternative routes or machines may be taken offline for emergency maintenance. And prediction, simulation, and optimization facilitate more dynamic scheduling and more precise product mix and yield management.
Establishing Your Ambition
If you’ve done some big-picture thinking and taken a systematic inventory of even one business domain, chances are you’ve got plenty of candidates for improvement through analytics. How then to prioritize, to zero in on your best targets? By carefully calibrating both your expected benefits and your available capability:
• Benefits. Is the business process a strategic or otherwise high priority? How big a difference might the analytical application make in business performance? Will excelling at the process yield marketplace advantage, such as setting a difficult-to-match performance standard or building a differentiated capability? Is the process high-volume enough to generate significant cost savings from speeding decisions, eliminating steps, or selecting the best process variation? If the business potential is large enough to pursue, what level of effort and investment does it warrant? And how fast must you act to realize the benefits?
• Capabilities. Are the necessary pieces in place—especially if the application is new? If you do lack ingredients, is there a way to buy, rent, or build them in time? Keep in mind that the five DELTA elements are all interrelated, but targets may be the most dependent variable. They may need to be adjusted based on the availability of data and skilled analysts, the scope of an enterprise perspective, and the commitment of enterprise and business unit leadership.
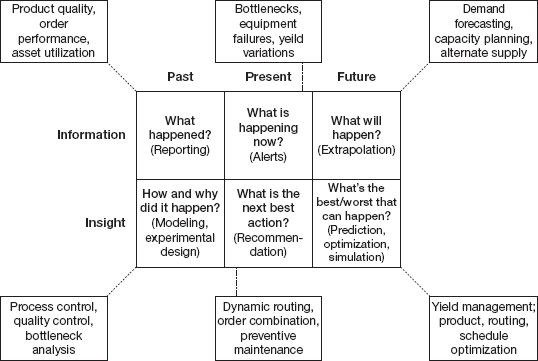
We find it instructive to visualize potential ambitions on a “ladder” of analytical applications as shown in figure 5-4. Going up the ladder entails more sophisticated analytics, so the higher rungs are less populated. Skipping rungs, like on any ladder, can lead to nasty falls. Starting at the bottom rung:
• The foundation is good data—it is accurate, consistent, integrated, accessible, and relevant.
• Statistical analysis of that data yields useful segmentation—of customers, products, and transactions or other business events.
• Segmentation in turn enables differentiated action—treating individual customers differently, or choosing the most efficient path in a flexible business process.
• Incorporating predictive action enables a business to marshal its resources where opportunity is greatest.
• At the institutional action rung, differentiation and prediction are embedded in ongoing business processes and accomplished automatically.
• The top rung is the domain of real-time optimization, where the process adjusts on the fly to maintain optimal business yield. And yes, unlike most ladders, this is one ladder where you can stand on the top rung.
FIGURE 5-4
Ladder of analytical applications
The ladder in figure 5-4 is the general pattern. Within any major business process area, it’s enlightening to ask: How high have we climbed? How high can we climb? How high does the market want us to climb? Have we compromised our performance by skipping or only partially covering a rung? And can we boost performance or gain advantage by moving up a rung? As you move up the ladder, the rungs below you will still need attention. For example, if your company acquires a competitor or if a third-party data feed changes, you need to make adjustments to keep your data in order. So maintain your perspective by keeping the entire ladder—what you’ve accomplished and what opportunities remain—in mind.
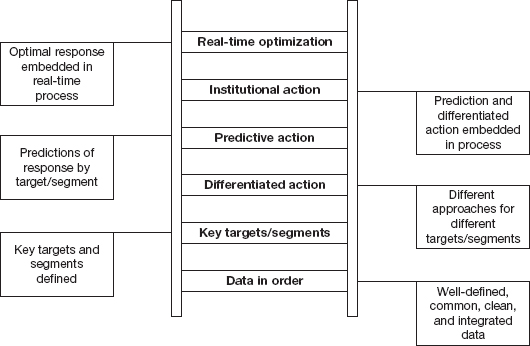
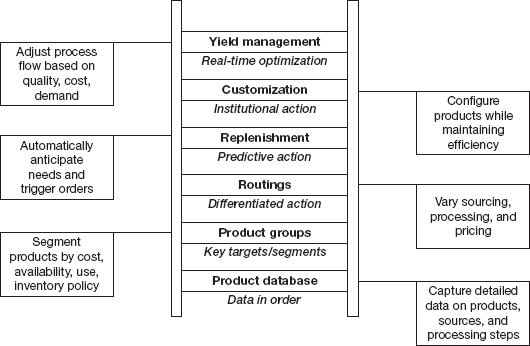
Of course, every business process will have its own ladder, one that reflects industry practices and standard process characteristics. For example, figure 5-5 depicts the ladder for supply chain, starting at the bottom with information about products, their sources, and what happens to them. At the second rung products are meaningfully grouped, often in terms of cost, availability from suppliers, or customers. At the third rung products are processed or priced differently, based on customer and market information. The fourth rung is more predictive, tackling the challenge of “replenishment” in a broad sense—what amount of goods and resources should you keep in the pipeline to fill anticipated orders? On the fifth rung you customize efficiently to create variety in products and processes. The top rung is the realm of real-time optimization of product flow and yield that maximizes profit.
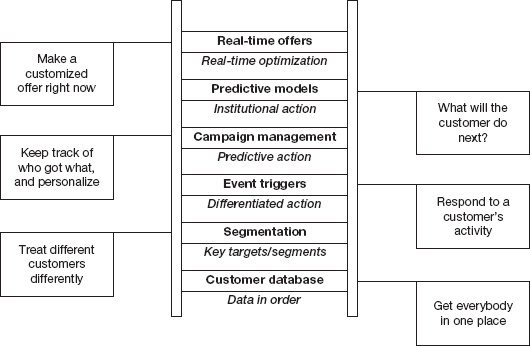
Figure 5-6 depicts a ladder for applications of marketing analytics. At the first rung is the development of an integrated and high-quality customer database, starting with an agreed-upon definition of what constitutes a customer. Segmentation, at the second rung, is not just a categorization scheme, but should be the basis for treating customers differently and targeting the most valuable ones. For example, high spenders at a casino may be offered a complimentary upgrade or dinner upon check-in, or digital camera buyers can receive a coupon for a new printer four weeks after initial purchase. At the third rung, a business process can trigger immediate actions in response to a customer’s activity. For example, banks might send a simple “thank-you” or confirmation e-mail after an online transaction, or a call after a large deposit is made into a checking account. The fourth rung represents overall campaign management and personalization—for example, tracking which customers received which offers and how they responded. At the fifth rung predictive analytics help forecast how customers will behave in the future and predict which offers will conclude in a sale. One insurance company used predictive analytics to cut direct marketing volume by 50 percent while doubling revenue. Finally, at the top rung of the ladder is the ability for a company to make a real-time offer to a customer with a high probability of acceptance. For example, if an online travel booking site sees a customer search for flights but then log off without purchasing, the site could immediately send the customer an e-mail offering a reduced price or a hotel or rental car for that trip.
Ladder of analytical applications: Supply chain
Ladder of analytical applications: Marketing
We recommend developing ladders for every major business process area, including internal processes like employee management, finance, and overall business performance management. They will help you see both how far you’ve come analytically and where you can aspire to go next.
Be warned that the targeting methods we’ve discussed won’t yield a scoped and specified project, complete with resource plan, timetable, and metrics. You’ve got more work to do at that level. Chances are, your targeting will trigger commitment to a pilot or experiment that can enable you to further refine the target. And even after a major analytics project is under way, you’ll want to revisit these targeting questions (see “Do We Have a Good Target?”) periodically and adjust accordingly. As your organization grows more analytical, targeting becomes a continuous exercise—seeking additional opportunities in areas where you’re already applying analytics, as well as keeping an eye out for opportunities not yet conceived.
• Is it aimed at a distinctive capability, an area that can make a difference in business performance, competitiveness, and profitability?
• Are executive management and relevant business area managers behind the initiative?
• Does it contain elements of innovation and differentiation (e.g., by bringing together information and capabilities from adjoining parts of the business)?
• Does it have specific goals and metrics, including ways to gauge both progress and eventual success?
• Is it feasible given the availability of resources and capabilities (including the other DELTA elements)?
Targets Through the Stages
How does targeting happen at the most analytically advanced, stage 5 companies? The company targets analytics where it has the greatest effect on business performance and differentiation. Ambitions are clear, and analytical projects enjoy the momentum that comes with compelling business rationale and specific strategic objectives. At any given time, the company is probably working on one major, competitively differentiating target and perhaps several minor ones. Once it reaches a major goal, it moves on to another one—while maintaining its edge in the first. And the analytical techniques employed successfully are translated quickly to targets in other parts of the business. For example, Google was founded on analytics about page rank and search. It later moved on to analytics about which ads to display under what circumstances. The company continually researches and innovates around both targets.
The methods of targeting are very sophisticated at stage 5. The company always has its eyes and ears—both human and electronic—alert to changing times, new ways to differentiate, and tomorrow’s targets. It taps all sources of insight into potential targets—both big-picture thinking about the structure and purpose of the business (based on industry trends and market demand) and systematic inventory of business processes and decisions. Perhaps most important, at stage 5 there is an enterprisewide perspective (the E of DELTA) on the evaluation and pursuit of analytical opportunities—those targets that can make the most difference in overall business performance.
Moving to the next stage: Targets
| From stage 1 Analytically Impaired to stage 2 Localized Analytics |
From stage 2 Localized Analytics to stage 3 Analytical Aspirations |
From stage 3 Analytical Aspirations to stage 4 Analytical Companies |
From stage 4 Analytical Companies to stage 5 Analytical Competitors |
| Work wherever there is sponsorship and some decent data. Target “low-hanging fruit.” |
Work with business areas that are already somewhat analytical or can benefit greatly from analytics. Target business process or cross-functional applications. Start taking systematic inventories of analytical opportunities by business area. |
Work with major business processes and their owners. Focus on high value and high impact targets. Take an enterprisewide approach to finding and evaluating targets. Formalize the process of targeting as a collaboration among business executives, IT and analytics leaders. |
Work with the executive team. Focus on strategic initiatives, value creation, and building distinctive capability that will enhance competitive differentiation. Infiltrate the strategic planning process so analytics can shape (not just respond to) business strategy. |
Table 5-2 summarizes what it takes to advance from stage to stage in terms of targeting.
From Stage 1 to Stage 2. At stage 1, you’re starting from scratch, and you are largely targetless. To progress to stage 2, you’ve got to generate interest and show some early success. Start with a business manager who has a problem and some decent data for addressing it. If you start with good data that requires minimal cleanup before analysis, you avoid delay the first time out of the box. It’s also best to show success early, so the first targets should be “low-hanging fruit”—business problems and objectives that are clear, definitely worthwhile, and doable fairly quickly. Once you’ve established a bit of a track record, your ambition and degree of difficulty can rise.
From Stage 2 to Stage 3. The first few projects may be opportunistically selected, but after a few successes you should enlist business sponsors who are interested in taking systematic inventory of analytical opportunities in their process or decision areas. Once you’ve reached stage 2, there may a veritable shooting gallery of targets in play, but few if any of high business importance because they are too local. To move to stage 3, you need to focus on important targets and raise your ambition in those areas. Targets become cross-functional, involving more businesspeople in analytics projects, thus necessitating a more collaborative targeting process. Now is a good time to introduce some big-picture thinking about analytical opportunities and business impact, and to encourage an enterprisewide perspective in targeting.
From Stage 3 to Stage 4. At stage 3, your analytical targets are important, but are you pursuing the most important ones? To move to stage 4, you need to formalize the methods of finding high-impact business opportunities, evaluate them from an enterprise viewpoint, and fund them with adequate money and resources. In a decentralized company that has analytical opportunities spanning the business units, establish a small “program management office” to coordinate analytical projects and their resourcing. Get senior executives across the enterprise not just involved in, but supportive of the methods the company uses to deploy analytics.
From Stage 4 to Stage 5. Congratulations! You’ve reached stage 4. Analytics is now a regular part of how the company works. The final step is to put analytics to work strategically where it adds greatest value for your customers and differentiates you from your competitors. To put it another way, make your organization’s analytical capabilities and expertise an essential part of how you go to market. Now you’ve got to be working with the CEO and executive team, as well as analytical leaders across the enterprise. Analytical thinking and opportunity finding are embedded in the strategic planning process, and targeting analytical applications is no different from targeting any strategic business initiative. In fact, analytics are part of any strategic business initiative.
Keep in Mind…
• Look beyond what’s happening in your industry. Better to differentiate than just run with the pack.
• Qualify your targets based not only on business potential, but also on whether necessary resources—starting with data—are available.
• Think ahead. Anticipate how your analytical capability will advance as you “move up the ladder” in a target business area.
• Be willing to experiment to discover what’s possible.
• Don’t spread your analytical efforts too thin across too many targets. Especially while the organization is still learning, focus on one major target and perhaps a few minor ones.
• Don’t ignore your hunches about analytical opportunities. Just be sure to test them!